Population change combines births, deaths, immigration, and emigration.
Compare Malthusian and demographic-transition models and interpret population pyramids and projections
Population change combines births, deaths, immigration, and emigration. Malthus argued that population could grow faster than food supply without checks, but technological change, distribution, and fertility transitions complicate a simple inevitable-scarcity prediction. Demographic-transition models describe movement from high birth and death rates to lower rates, commonly with mortality falling before fertility and producing temporary rapid growth. Later low fertility can yield aging or decline; the sequence is not a universal timetable. Population pyramids display age and sex composition: a broad base suggests many young people, while a narrow base suggests fewer recent births. Projections depend on assumptions and are not guaranteed forecasts.
Calculate and interpret crude, total, and age-specific fertility or mortality rates
The crude birth rate is annual live births divided by the midyear population, often per 1,000 people; the crude death rate similarly uses annual deaths. The general fertility rate uses women of specified reproductive ages as denominator, while age-specific fertility rates use births to women in each age band. Total fertility rate sums age-specific rates across reproductive ages with interval widths, estimating births per woman under current rates rather than actual completed family size. Age-specific mortality uses deaths and population within the same age band. Infant mortality uses deaths before age one per 1,000 live births. Age standardization helps compare populations with different age structures.
Explain migration push and pull factors and demographic consequences
Push factors make departure more likely, such as conflict, persecution, environmental disruption, or limited employment; pull factors attract migrants through opportunity, safety, family networks, or services. Migration may be internal or international, voluntary or forced, with overlapping motives. Net migration equals arrivals minus departures, while gross flows count both directions. Selective migration can alter age structure, labor supply, dependency ratios, and skill distribution in both origin and destination. Remittances transfer resources to origin communities, while separation and restrictive institutions can create costs. A growing city may reflect migration, natural increase, or changed boundaries, so population totals alone do not identify the mechanism.
Worked question. A population of 50,000 has 600 births, 400 deaths, 300 immigrants, and 200 emigrants in one year. Using 50,000 as the approximate midyear denominator for the crude rates, calculate birth and death rates and population change. Why could an older population have a higher crude death rate despite good care?
Birth rate = 600/50,000 × 1,000 = 12 per 1,000; death rate = 8 per 1,000. Natural increase is 200 and net migration 100, so total increase is 300, or 0.6% of the starting population. Older age structure can raise crude mortality even when age-specific rates are lower; compare standardized or age-specific rates before ranking health systems.
20.1 Demography and Population — figures and tables
Figure 20.3 — 20.1 Demography and Population
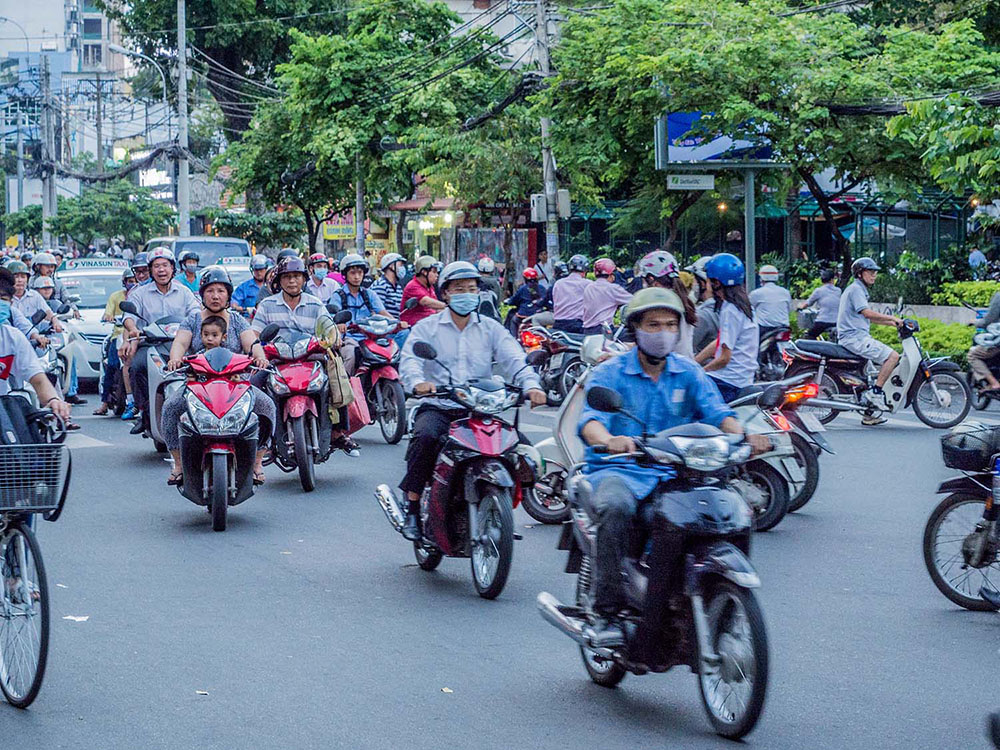
Figure 20.3 At nearly 8 billion, Earth’s population is always on the move, but the methods vary. As you see here, bicycles, motorcycles, and scooters are more common in Vietnam than they are in many U.S. cities. And in some countries, masks were common well before COVID-19. (Credit: Esin Üstün/flickr)
Tonja R. Conerly, Kathleen Holmes, and Asha Lal Tamang, Introduction Sociology 3E, OpenStax. · CC BY-NC-SA 4.0
· Original image ↗ · Access for free ↗Figure 20.4 — 20.1 Demography and Population
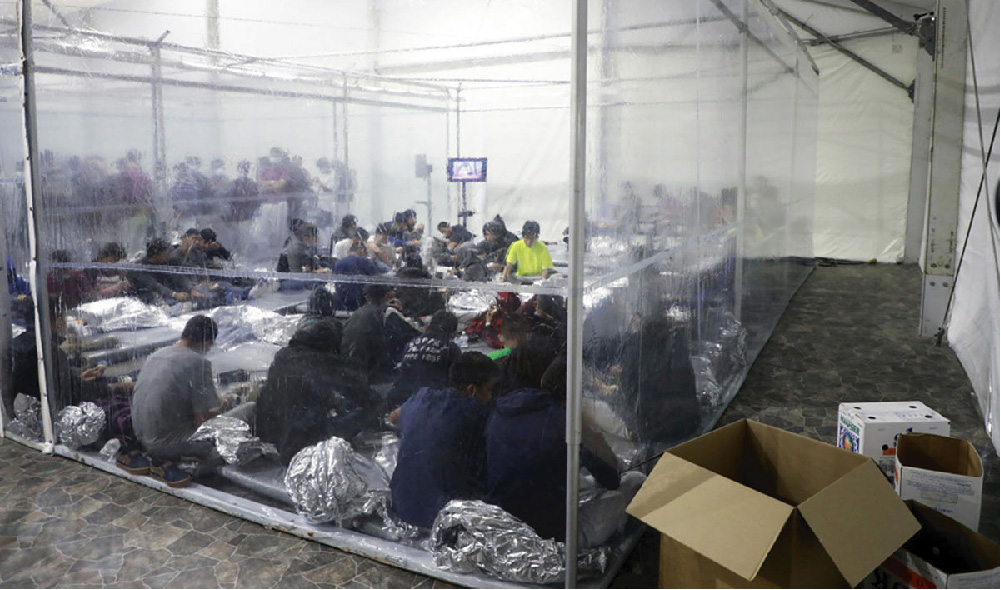
Figure 20.4 This March 2021 image of dozens of children in plastic-lined holding areas was one of a group of photos that sparked public outcry in the early days of the Biden administration, years after similar scenes and situations in the 2014 and 2018 border crises. (Credit: Defense Visual Information Distribution Service)
Tonja R. Conerly, Kathleen Holmes, and Asha Lal Tamang, Introduction Sociology 3E, OpenStax. · CC BY-NC-SA 4.0
· Original image ↗ · Access for free ↗Figure 20.5 — 20.1 Demography and Population
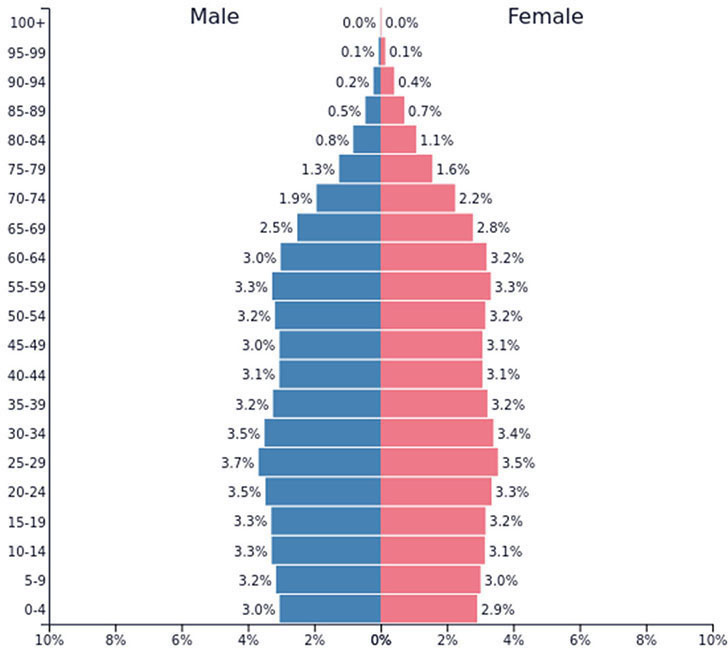
Figure 20.5 This population pyramid shows the breakdown of the 2019 U.S. population according to age and sex. (Credit: Populationpyramid.net)
Tonja R. Conerly, Kathleen Holmes, and Asha Lal Tamang, Introduction Sociology 3E, OpenStax. · CC BY-NC-SA 4.0
· Original image ↗ · Access for free ↗Figure 20.6 — 20.1 Demography and Population
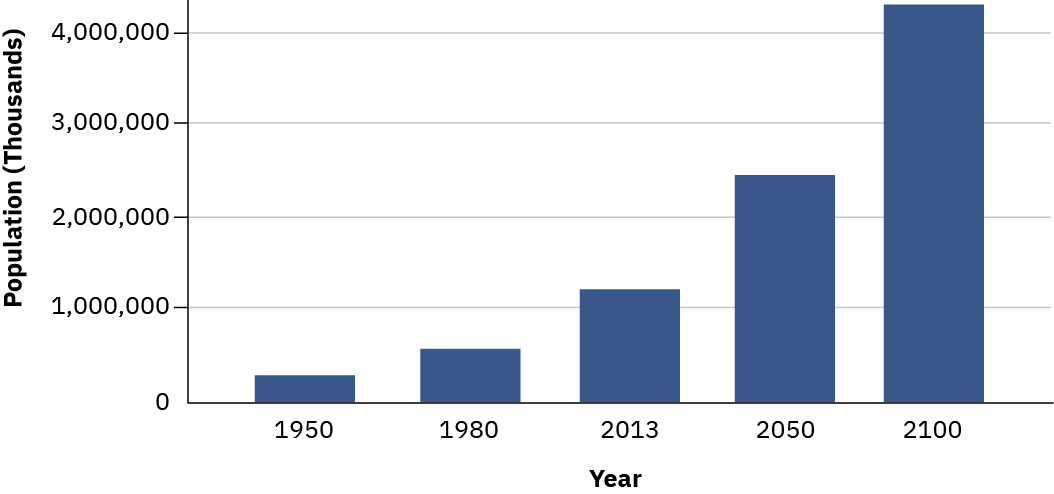
Figure 20.6 Projected Population in Africa This graph shows the population growth of countries located on the African continent, many of which have high fertility rates. (Credit: USAID)
Tonja R. Conerly, Kathleen Holmes, and Asha Lal Tamang, Introduction Sociology 3E, OpenStax. · CC BY-NC-SA 4.0
· Original image ↗ · Access for free ↗Figure 20.7 — 20.1 Demography and Population
Figure 20.7 Projected Population in the United States The United States has an intermediate fertility rate, and therefore, a comparatively moderate projected population growth. (Credit: USAID)
Tonja R. Conerly, Kathleen Holmes, and Asha Lal Tamang, Introduction Sociology 3E, OpenStax. · CC BY-NC-SA 4.0
· Original image ↗ · Access for free ↗Figure 20.8 — 20.1 Demography and Population
Figure 20.8 Projected Population in Europe This chart shows the projected population growth of Europe for the remainder of this century. (Credit: USAID)
Fertility Rate (number of children per adult women)
Mortality Rate (per 1,000 births)
Sex Ratio Male to Female
Afghanistan
38.4
4.4
48
1.05
Finland
5.52
1.4
2.0
1.04
United States of America
328.3
1.7
5.7
0.97
Table 20.1 Varying Fertility and Mortality Rated by Country As the table illustrates, countries vary greatly in fertility rates and mortality rates—the components that make up a population composition. This data is from 2018, and changes occur continually. For example, in 2014, the number of children per adult woman in Afghanistan was 5.4 – generally an average of one more child per family. And the U.S. was slightly higher at 2.0 (World Bank 2019). Tonja R. Conerly, Kathleen Holmes, and Asha Lal Tamang, Introduction Sociology 3E, OpenStax.
11.5 Race and Ethnicity in the United States — figures and tables
Figure 11.8 — 11.5 Race and Ethnicity in the United States
Figure 11.8 Many Native Americans (and others) believe sports teams with names like the Indians, Braves, and Warriors perpetuate unwelcome stereotypes. The Not Your Mascot protest was one of many directed at the then Washington Redskins, which eventually changed its name. (Credit: Fibonacci Blue/fickr)
Figure 11.9 This gathering at the site of George Floyd's death took place five days after he was killed. The location, at Chicago Avenue and 38th Street in Minneapolis, became a memorial. (Credit: Fibbonacci Blue/flickr)
Figure 11.10 Thirty-five Vietnamese refugees wait to be taken aboard the amphibious USS Blue Ridge (LCC-19) . They are being rescued from a thirty-five-foot fishing boat 350 miles northeast of Cam Ranh Bay, Vietnam, after spending eight days at sea. (Credit: U.S. Navy/Wikimedia Commons)
Figure 11.11 In response to widespread attacks against Asian people, partly linked to incorrect associations regarding Asian people and the COVID-19 pandemic, groups around the country and world held Stop Asian Hate rallies like this one in Canada. (Credit: GoToVan/flickr)
Figure 11.12 The Islamic Center of America in Dearborn, Michigan is the largest mosque, or Islamic religious place of worship, in the United States. Muslim women and girls often wear head coverings, which sometimes makes them a target of harassment. (Credit A: Ryan Ready/flickr; B: U.S. Department of Agriculture/flickr)
Table 11.1 Percentage of Race and Hispanic Origin Population 2019 (Table courtesy of U.S. Census Bureau). Tonja R. Conerly, Kathleen Holmes, and Asha Lal Tamang, Introduction Sociology 3E, OpenStax.
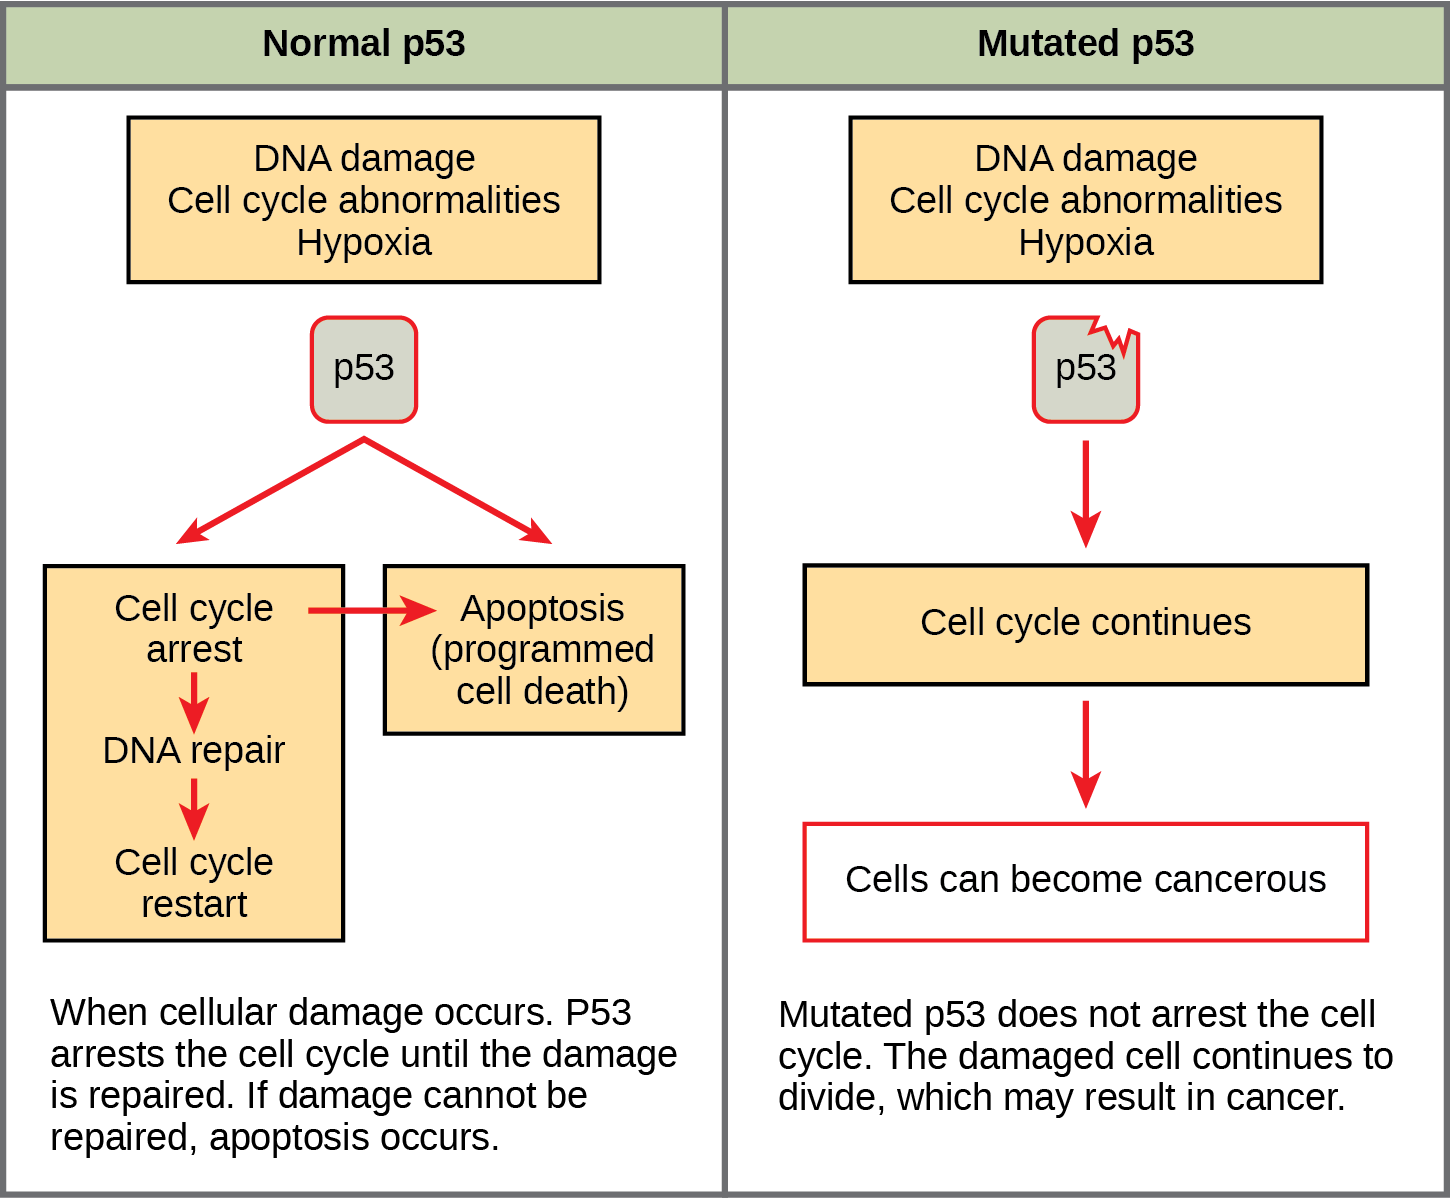
Figure 10.16 The role of normal p53 is to monitor DNA and the supply of oxygen (hypoxia is a condition of reduced oxygen supply). If damage is detected, p53 triggers repair mechanisms. If repairs are unsuccessful, p53 signals apoptosis. A cell with an abnormal p53 protein cannot repair damaged DNA and thus cannot signal apoptosis. Cells with abnormal p53 can become cancerous. (credit: modification of work by Thierry Soussi)
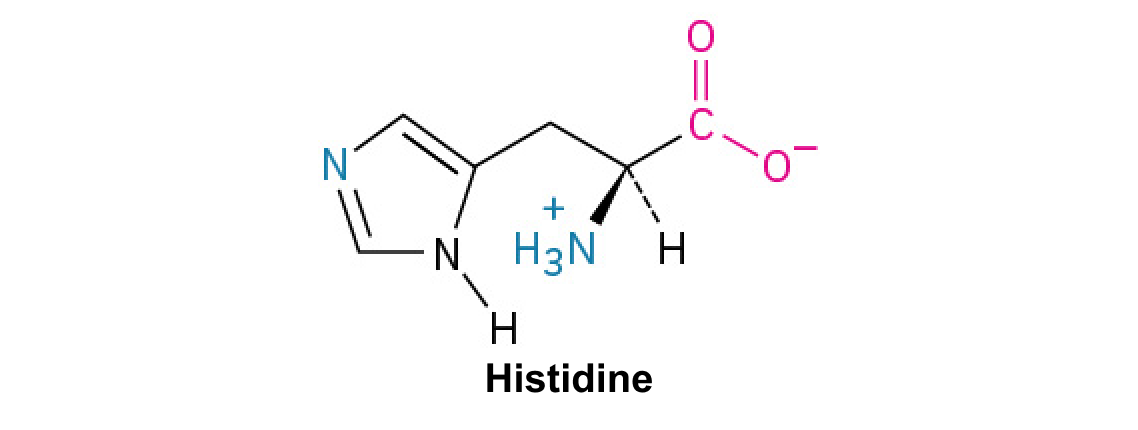
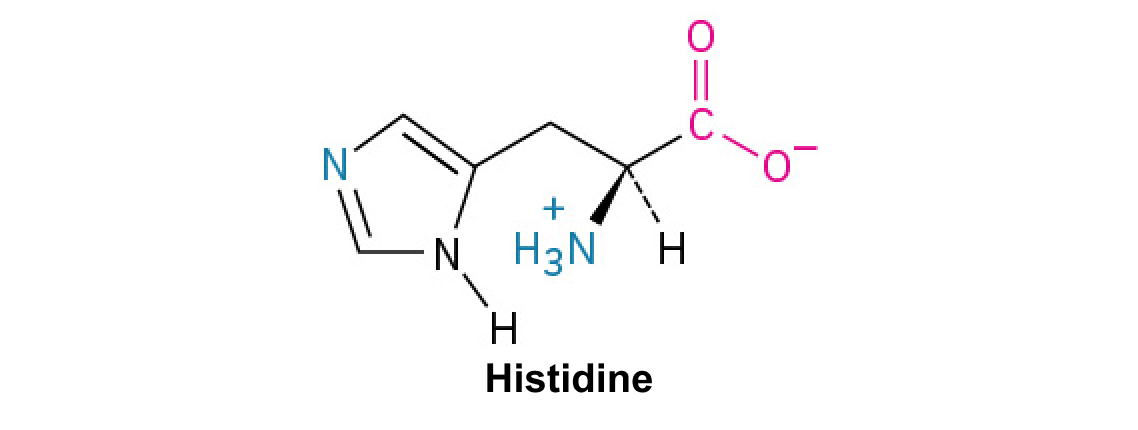
A nitrogen-containing functional group. A free amino acid’s amino group is typically protonated (NH₃⁺) near physiological pH; proline’s ring nitrogen is an exception to this formula.
Figure 15.4 This figure shows the genetic code for translating each nucleotide triplet in mRNA into an amino acid or a termination signal in a protein. (credit: modification of work by NIH)
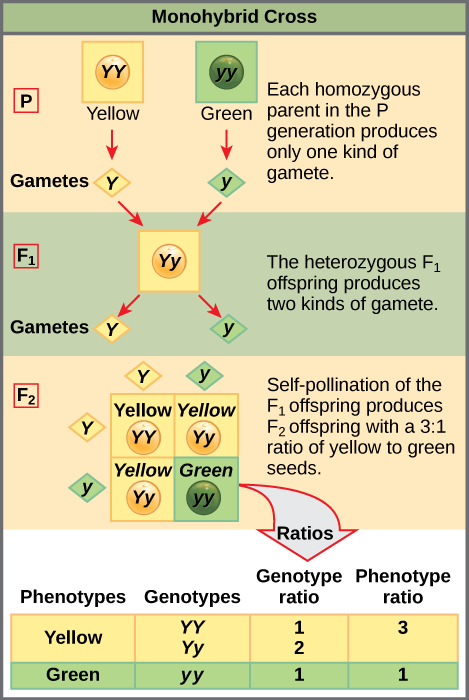
Figure 12.4 In the P generation, pea plants that are true-breeding for the dominant yellow phenotype are crossed with plants with the recessive green phenotype. This cross produces F 1 heterozygotes with a yellow phenotype. Punnett square analysis can be used to predict the genotypes of the F 2 generation.
An electrical property that can be positive or negative. Opposite charges attract and like charges repel; net charge is the sum of all charges on a particle.
Figure 15.10 A generalized promoter of a gene transcribed by RNA polymerase II is shown. Transcription factors recognize the promoter. RNA polymerase II then binds and forms the transcription initiation complex.
Figure 12.4 In the P generation, pea plants that are true-breeding for the dominant yellow phenotype are crossed with plants with the recessive green phenotype. This cross produces F 1 heterozygotes with a yellow phenotype. Punnett square analysis can be used to predict the genotypes of the F 2 generation.
Figure 12.4 In the P generation, pea plants that are true-breeding for the dominant yellow phenotype are crossed with plants with the recessive green phenotype. This cross produces F 1 heterozygotes with a yellow phenotype. Punnett square analysis can be used to predict the genotypes of the F 2 generation.
The exponent needed to obtain a number from a chosen fixed number. For decimal logarithms, log₁₀(100) = 2 because 10² = 100; pH uses the negative decimal logarithm of hydrogen ion activity.
A thin boundary or sheet. Cell membranes are lipid bilayers containing proteins; blotting membranes are synthetic supports that hold proteins or nucleic acids for detection.
Figure 15.11 Eukaryotic pre-mRNA processing. In addition to 5’ Cap and 3’ Poly-A Tail addition, introns must be precisely removed and exons joined to generate a functional mRNA. Nucleotides upstream (towards the 5’cap) of the translation START codon are part of the 5’ untranslated region (5’ UTR). Nucleotides downstream (towards 3’end) of the STOP codon form the 3’ UTR. Both 5’ and 3’ UTRs are important for regulating translation initiation and mRNA stability. Credit: Rao, A., Ryan, K. Fletcher, S. and Tag, A. Department of Biology, Texas A&M University.
Rao, A., Ryan, K. Fletcher, S. and Tag, A. Department of Biology, Texas A&M University.; Mary Ann Clark, Matthew Douglas, and Jung Choi, Biology 2e, OpenStax. · CC BY-NC-SA 4.0
· Original image ↗ · Access for free ↗
Figure 12.4 In the P generation, pea plants that are true-breeding for the dominant yellow phenotype are crossed with plants with the recessive green phenotype. This cross produces F 1 heterozygotes with a yellow phenotype. Punnett square analysis can be used to predict the genotypes of the F 2 generation.
Figure 12.19 Reaction diagrams for an endothermic process in the absence (red curve) and presence (blue curve) of a catalyst. The catalyzed pathway involves a two-step mechanism (note the presence of two transition states) and an intermediate species (represented by the valley between the two transitions states).
Figure 7.45 - Non-homologous end joining (left) versus homologous recombination (right) - Wikipedia
Wikipedia, as credited by Kevin Ahern, Indira Rajagopal, and Taralyn Tan, Biochemistry Free For All, Oregon State University, via Biology LibreTexts. · Source attribution
· Original image ↗ · Access for free ↗
The amount of a substance that can dissolve in a solvent under specified conditions. Soluble means able to dissolve; insoluble means only very slightly soluble in that solvent.
Figure 15.7 Messenger RNA is a copy of protein-coding information in the coding strand of DNA, with the substitution of U in the RNA for T in the coding sequence. However, new RNA nucleotides base pair with the nucleotides of the template strand. RNA is synthesized in its 5'-3' direction, using the enzyme RNA polymerase. As the template is read, the DNA unwinds ahead of the polymerase and then rewinds behind it.
A fleeting, high-energy arrangement at a reaction barrier. It is an energy maximum along the reaction path, rather than a stable reaction intermediate.
Figure 12.19 Reaction diagrams for an endothermic process in the absence (red curve) and presence (blue curve) of a catalyst. The catalyzed pathway involves a two-step mechanism (note the presence of two transition states) and an intermediate species (represented by the valley between the two transitions states).
Figure 15.18 Translation begins when an initiator tRNA anticodon recognizes a start codon on mRNA bound to a small ribosomal subunit. The large ribosomal subunit joins the small subunit, and a second tRNA is recruited. As the mRNA moves relative to the ribosome, successive tRNAs move through the ribosome and the polypeptide chain is formed. Entry of a release factor into the A site terminates translation and the components dissociate.
No matching terms. Try a different name or abbreviation.
20.1 Demography and Population
OpenStax · 20.1 Demography and Population ↗ Instructional page including learning objectives, examples, figures, source tables and questions. Site navigation and embedded media players are omitted; source media links remain available.
Learning Objectives
By the end of this section, you should be able to:
Explain demographic measurements like fertility and mortality rates
Describe a variety of demographic theories, such as Malthusian, cornucopian, zero population growth, and demographic transition theories
Evaluate current population trends and patterns
Differentiate between an internally displaced person, an asylum-seeker, and a refugee
Figure 20.3 — 20.1 Demography and Population
Figure 20.3 At nearly 8 billion, Earth’s population is always on the move, but the methods vary. As you see here, bicycles, motorcycles, and scooters are more common in Vietnam than they are in many U.S. cities. And in some countries, masks were common well before COVID-19. (Credit: Esin Üstün/flickr)
Between 2011 and 2012, we reached a population milestone of 7 billion humans on the earth’s surface. The rapidity with which this happened demonstrated an exponential increase from the time it took to grow from 5 billion to 6 billion people. In short, the planet is filling up. We'll have 8 billion people in this decade. While the population is increasing overall, there are certain countries and regions where growth is slowing. Relocation and migration also change the makeup and quantity of people in an area. In order to properly understand these dynamics and make decisions regarding them, we turn to demography, or the study of populations. Three critical aspects of demography are fertility, mortality, and migration.
The fertility rate of a society is a measure noting the number of children born. The fertility number is generally lower than the fecundity number, which measures the potential number of children that could be born to women of childbearing age. Sociologists measure fertility using the crude birthrate (the number of live births per 1,000 people per year). Just as fertility measures childbearing, the mortality rate is a measure of the number of people who die. The crude death rate is a number derived from the number of deaths per 1,000 people per year. When analyzed together, fertility and mortality rates help researchers understand the overall growth occurring in a population.
Another key element in studying populations is the movement of people into and out of an area. Migration may take the form of immigration, which describes movement into an area to take up permanent residence, or emigration, which refers to movement out of an area to another place of permanent residence. Migration might be voluntary (as when college students study abroad), involuntary (as when Syrians evacuated war-torn areas), or forced (as when many Native American tribes were removed from the lands they’d lived in for generations).
Big Picture
Mass Migration Crises
Figure 20.4 — 20.1 Demography and Population
Figure 20.4 This March 2021 image of dozens of children in plastic-lined holding areas was one of a group of photos that sparked public outcry in the early days of the Biden administration, years after similar scenes and situations in the 2014 and 2018 border crises. (Credit: Defense Visual Information Distribution Service)
At least once during each of the last three Presidential administrations, the United States has faced a crisis at its southern border. While images of children in crowded holding areas, covered in piles of shiny plastic emergency blankets, were often associated with the Trump Presidency, Presidents Obama and Biden saw children in the same conditions. The holding facilities, described as cages by some and often referred to as “perreras” (dog kennels) or “hieleras” (ice boxes) by the migrating people, are meant to be temporary stopovers while people await hearings or related refugee processes. But during a number of occasions, the number of people crossing the border was so large – including, at times, tens of thousands of children – that the system became overwhelmed. The conditions are deplorable. The outcomes are uncertain. But the people cross the border anyway.
How did we get here? Bipartisan legislation passed in 2008 guarantees unaccompanied minors a hearing with an immigration judge where they may request asylum based on a “credible” fear of persecution or torture (U.S. Congress 2008). In some cases, these children are looking for relatives and can be placed with family while awaiting a hearing on their immigration status; in other cases, they become involved with the foster system or are placed in of the 170 housing facilities run by nonprofit or for-profit groups. Finally, for people who turn 18 while still in the process, they may be transferred to detention centers, sometimes on their birthday (Montoya-Galvez 2021). Many people in America were either accepting or unaware of these policies and situations until crises occurred in 2014 and 2018-19. At those points of incredible influxes of migrant children, border control, refugee services, and advocacy organizations were overwhelmed by the surge. Both the Obama and Trump administrations pushed for changes in laws or guidelines for enforcement (Gomez 2014 and Kanno-Youngs 2020).
The Obama administration sought to make the decision process faster. In 2014, over 50,000 unaccompanied minors were taken into custody, creating the backlog discussed above. The Trump administration sought to discourage immigration through policies such as separating parents and children who arrived together. The policy was decried by members of Trump's own party, as well as many other organizations, and was eventually dealt a series of legal blows before the President reversed it. Later investigations determined that hundreds, if not thousands, of children remained separated from their parents for extended periods of time (Spagat 2019).
While the situations at the border are extremely threatening to children's health and safety, people and policymakers in the United States are divided on how to address the situation. In many cases, these children are fleeing various kinds of violence and extreme poverty. The U.S. government has repeatedly indicated that the best way to avoid these crises is to address those conditions in the migrants' home countries. But even with financial aid for those nations and pressure on their governments to crack down on illegal activity, it is unlikely that the situation will change quickly or consistently. The Biden administration may not be the last to face a surge of immigrant children at its border.
A functional perspective theorist might focus on the dysfunctions caused by the sudden influx of underage asylum seekers, while a conflict perspective theorist might look at the way social stratification influences how the members of a developed country are treating the lower-status migrants from less-developed countries in Latin America. An interactionist theorist might see significance in the attitude of those protesting the presence of migrant children. Which theoretical perspective makes the most sense to you?
Population Growth
Changing fertility, mortality, and migration rates make up the total population composition, a snapshot of the demographic profile of a population. This number can be measured for societies, nations, world regions, or other groups. The population composition includes the sex ratio, the number of men for every hundred women, as well as the population pyramid, a picture of population distribution by sex and age (Figure 20.5).
Figure 20.5 — 20.1 Demography and Population
Figure 20.5 This population pyramid shows the breakdown of the 2019 U.S. population according to age and sex. (Credit: Populationpyramid.net)
Fertility Rate (number of children per adult women)
Mortality Rate (per 1,000 births)
Sex Ratio Male to Female
Afghanistan
38.4
4.4
48
1.05
Finland
5.52
1.4
2.0
1.04
United States of America
328.3
1.7
5.7
0.97
Table
20.1
Varying Fertility and Mortality Rated by Country
As the table illustrates, countries vary greatly in fertility rates and mortality rates—the components that make up a population composition. This data is from 2018, and changes occur continually. For example, in 2014, the number of children per adult woman in Afghanistan was 5.4 – generally an average of one more child per family. And the U.S. was slightly higher at 2.0 (World Bank 2019)
Comparing the three countries in Table 20.1 reveals that there are more men than women in Afghanistan and Finland, whereas the reverse is true in the United States. Afghanistan also has significantly higher fertility and mortality rates than either of the other two countries. In all three cases, the fertility rates have dropped in recent years, but Afghanistan's drop (from 5.4 children per woman to 4.4) will likely be the most impactful (World Bank 2019). Do these statistics surprise you? How do you think the population makeup affects the political climate and economics of the different countries?
Demographic Theories
Sociologists have long looked at population issues as central to understanding human interactions. Below we will look at four theories about population that inform sociological thought: Malthusian, zero population growth, cornucopian, and demographic transition theories.
Malthusian Theory
Thomas Malthus (1766–1834) was an English clergyman who made dire predictions about earth’s ability to sustain its growing population. According to Malthusian theory, three factors would control human population that exceeded the earth’s carrying capacity, or how many people can live in a given area considering the amount of available resources. Malthus identified these factors as war, famine, and disease (Malthus 1798). He termed them “positive checks” because they increase mortality rates, thus keeping the population in check. They are countered by “preventive checks,” which also control the population but by reducing fertility rates; preventive checks include birth control and celibacy. Thinking practically, Malthus saw that people could produce only so much food in a given year, yet the population was increasing at an exponential rate. Eventually, he thought people would run out of food and begin to starve. They would go to war over increasingly scarce resources and reduce the population to a manageable level, and then the cycle would begin anew.
Of course, this has not exactly happened. The human population has continued to grow long past Malthus’s predictions. So what happened? Why didn’t we die off? There are three reasons sociologists believe we are continuing to expand the population of our planet. First, technological increases in food production have increased both the amount and quality of calories we can produce per person. Second, human ingenuity has developed new medicine to curtail death from disease. Finally, the development and widespread use of contraception and other forms of family planning have decreased the speed at which our population increases. But what about the future? Some still believe Malthus was correct and that ample resources to support the earth’s population will soon run out.
Zero Population Growth
A neo-Malthusian researcher named Paul Ehrlich brought Malthus’s predictions into the twentieth century. However, according to Ehrlich, it is the environment, not specifically the food supply, that will play a crucial role in the continued health of the planet’s population (Ehrlich 1968). Ehrlich's ideas suggest that the human population is moving rapidly toward complete environmental collapse, as privileged people use up or pollute a number of environmental resources such as water and air. He advocated for a goal of zero population growth (ZPG), in which the number of people entering a population through birth or immigration is equal to the number of people leaving it via death or emigration. While support for this concept is mixed, it is still considered a possible solution to global overpopulation.
Cornucopian Theory
Of course, some theories are less focused on the pessimistic hypothesis that the world’s population will meet a detrimental challenge to sustaining itself. Cornucopian theory scoffs at the idea of humans wiping themselves out; it asserts that human ingenuity can resolve any environmental or social issues that develop. As an example, it points to the issue of food supply. If we need more food, the theory contends, agricultural scientists will figure out how to grow it, as they have already been doing for centuries. After all, in this perspective, human ingenuity has been up to the task for thousands of years and there is no reason for that pattern not to continue (Simon 1981).
Whether you believe that we are headed for environmental disaster and the end of human existence as we know it, or you think people will always adapt to changing circumstances, we can see clear patterns in population growth. Societies develop along a predictable continuum as they evolve from unindustrialized to postindustrial. Demographic transition theory (Caldwell and Caldwell 2006) suggests that future population growth will develop along a predictable four-stage model.
In Stage 1, birth, death, and infant mortality rates are all high, while life expectancy is short. An example of this stage is the 1800s in the United States. As countries begin to industrialize, they enter Stage 2, where birth rates are higher while infant mortality and the death rates drop. Life expectancy also increases. Afghanistan is currently in this stage. Stage 3 occurs once a society is thoroughly industrialized; birth rates decline, while life expectancy continues to increase. Death rates continue to decrease. Mexico’s population is at this stage. In the final phase, Stage 4, we see the postindustrial era of a society. Birth and death rates are low, people are healthier and live longer, and society enters a phase of population stability. Overall population may even decline. For example, Sweden is considered to be in Stage 4.
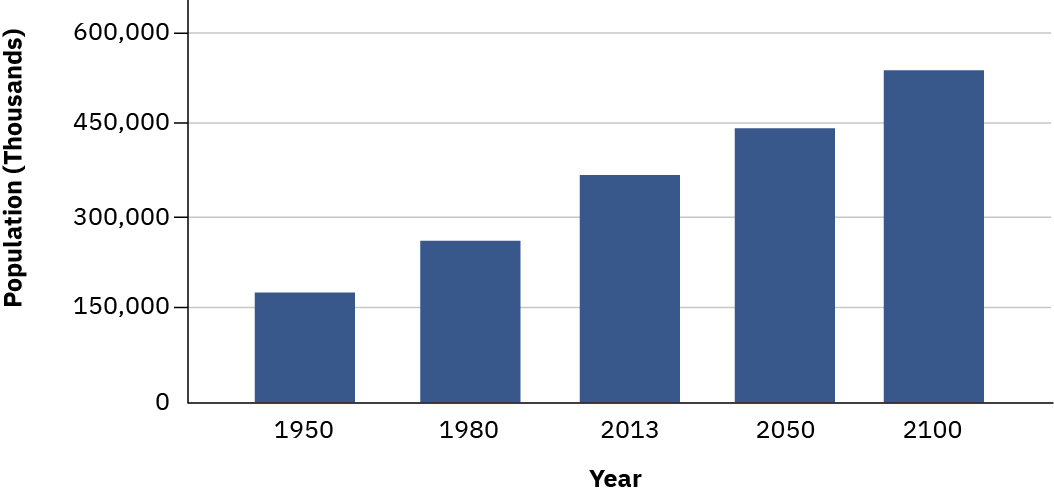
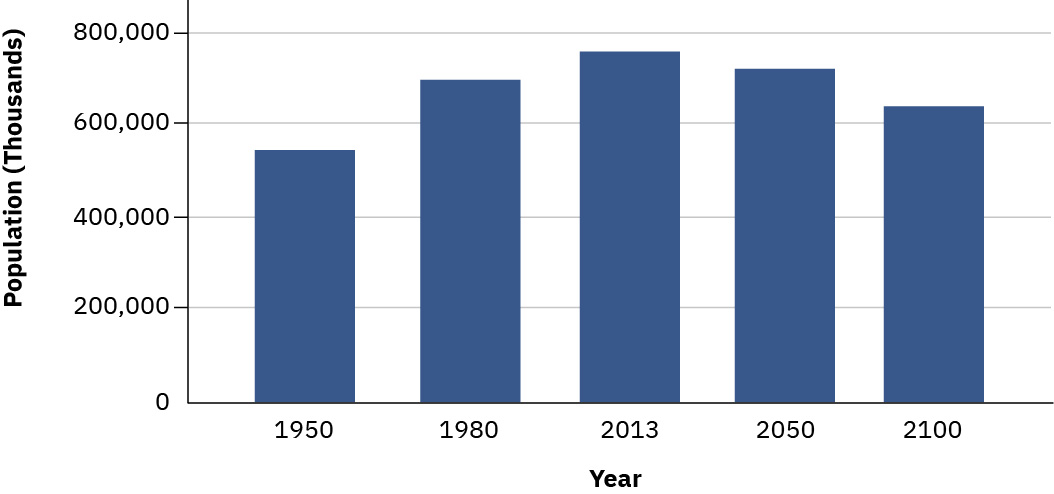
The United Nations Population Fund (2008) categorizes nations as high fertility, intermediate fertility, or low fertility. The United Nations (UN) anticipates the population growth will triple between 2011 and 2100 in high-fertility countries, which are currently concentrated in sub-Saharan Africa. For countries with intermediate fertility rates (the United States, India, and Mexico all fall into this category), growth is expected to be about 26 percent. And low-fertility countries like China, Australia, and most of Europe will actually see population declines of approximately 20 percent. The graphs below illustrate this trend.
Changes in U.S. Immigration Patterns and Attitudes
Figure 20.6 — 20.1 Demography and Population
Figure 20.6 Projected Population in Africa This graph shows the population growth of countries located on the African continent, many of which have high fertility rates. (Credit: USAID)
Figure 20.7 Projected Population in the United States The United States has an intermediate fertility rate, and therefore, a comparatively moderate projected population growth. (Credit: USAID)
Figure 20.8 Projected Population in Europe This chart shows the projected population growth of Europe for the remainder of this century. (Credit: USAID)
Worldwide patterns of migration have changed, though the United States remains the most popular destination. From 1990 to 2013, the number of migrants living in the United States increased from one in six to one in five (The Pew Research Center 2013). Overall, the United States is home to about 45 million foreign-born people, while only about 3 million U.S. citizens lived abroad. Of foreign-born citizens emigrating to the United States, 55 percent originated in Latin America and the Caribbean. However, over the past few years, more people from Asian countries have entered than from Latin American ones (Budiman 2020).
While there are more foreign-born people residing in the United States legally, as of 2017 about 10.5 million resided here without legal status (Budiman 2020). Most immigrants in the U.S. live in either Texas, Florida, or California.
Even before policy changes and COVID-19 affected refugee admittance, a relatively small number of people formally entered the country as refugees. In 2016, about 85,000 refugees were admitted to the U.S. (of over one million total immigrants), with the largest portion arriving from the Democratic Republic of Congo; in 2020, the number of refugees was reduced to 18,000.
Most citizens agree that our national immigration policies need adjustment. More than two-thirds (69 percent) of those in a recent national survey believed unauthorized immigrants should have a path to citizenship provided they meet other requirements, such as paying taxes and passing a background check. Even more people (72 percent) supported passing a DREAM Act, which would allow people who immigrated as children to earn citizenship. In both parts of the survey, majorities of both Republicans and Democrats as well as independents supported the pathway to citizenship (Vox and Data for Progress 2021).
11.5 Race and Ethnicity in the United States
OpenStax · 11.5 Race and Ethnicity in the United States ↗ Instructional page including learning objectives, examples, figures, source tables and questions. Site navigation and embedded media players are omitted; source media links remain available.
Learning Objectives
By the end of this section, you should be able to:
Compare and contrast the different experiences of various ethnic groups in the United States
Apply theories of intergroup relations, race, and ethnicity to different subordinate groups
When colonists came to the New World, they found a land that did not need “discovering” since it was already inhabited. While the first wave of immigrants came from Western Europe, eventually the bulk of people entering North America were from Northern Europe, then Eastern Europe, then Latin America and Asia. And let us not forget the forced immigration of enslaved Africans. Most of these groups underwent a period of disenfranchisement in which they were relegated to the bottom of the social hierarchy before they managed (for those who could) to achieve social mobility. Because of this achievement, the U.S. is still a “dream destination” for millions of people living in other countries. Many thousands of people, including children, arrive here every year both documented and undocumented. Most Americans welcome and support new immigrants wholeheartedly. For example, the Development, Relief, and Education for Alien Minors (DREAM) Act introduced in 2001 provides a means for undocumented immigrants who arrived in the U.S. as children to gain a pathway to permanent legal status. Similarly, the Deferred Action for Childhood Arrivals (DACA) introduced in 2012 gives young undocumented immigrants a work permit and protection from deportation (Georgetown Law 2021). Today, U.S. society is multicultural, multiracial and multiethnic, composed of people from many national origins.
The U.S. Census Bureau collects racial data in accordance with guidelines provided by the U.S. Office of Management and Budget (OMB 2016). These data are based on self-identification, and generally reflect a social definition of race recognized in this country that include racial and national origin or sociocultural groups. People may choose to report more than one race to indicate their racial mixture, such as “American Indian” and “White.” People who identify their origin as Hispanic, Latino, or Spanish may be of any race. OMB requires five minimum categories: White, Black or African American, American Indian or Alaska Native, Asian, and Native Hawaiian or Other Pacific Islander. The U.S. Census Bureau’s QuickFacts as of July 1, 2019 showed that over 328 million people representing various racial groups were living in the U.S. (Table 11.1).
Population estimates, July 1, 2019, (V2019)
328,239,523
Race and Hispanic Origin
Percentage (%)
White alone
76.3
Black or African American alone
13.4
American Indian and Alaska Native alone
1.3
Asian alone
5.9
Native Hawaiian and Other Pacific Islander alone
0.2
Two or More Races
2.8
Hispanic or Latino
18.5
White alone, not Hispanic or Latino
60.1
Table
11.1
Percentage of Race and Hispanic Origin Population 2019 (Table courtesy of U.S. Census Bureau)
To clarify the terminology in the table, note that the U.S. Census Bureau defines racial groups as follows:
White – A person having origins in any of the original peoples of Europe, the Middle East, or North Africa.
Black or African American – A person having origins in any of the Black racial groups of Africa.
American Indian or Alaska Native – A person having origins in any of the original peoples of North and South America (including Central America) and who maintains tribal affiliation or community attachment.
Asian – A person having origins in any of the original peoples of the Far East, Southeast Asia, or the Indian subcontinent including, for example, Cambodia, China, India, Japan, Korea, Malaysia, Pakistan, the Philippine Islands, Thailand, and Vietnam.
Native Hawaiian or Other Pacific Islander – A person having origins in any of the original peoples of Hawaii, Guam, Samoa, or other Pacific Islands.
Information on race is required for many Federal programs and is critical in making policy decisions, particularly for civil rights including racial justice. States use these data to meet legislative redistricting principles. Race data also are used to promote equal employment opportunities and to assess racial disparities in health and environmental risks that demonstrates the extent to which this multiculturality is embraced. The many manifestations of multiculturalism carry significant political repercussions. The sections below will describe how several groups became part of U.S. society, discuss the history of intergroup relations for each faction, and assess each group’s status today.
Native Americans
Native Americans are Indigenous peoples, the only nonimmigrant people in the United States. According to the National Congress of American Indians, Native Americans are “All Native people of the United States and its trust territories (i.e., American Indians, Alaska Natives, Native Hawaiians, Chamorros, and American Samoans), as well as persons from Canadian First Nations and Indigenous communities in Mexico and Central and South America who are U.S. residents (NCAI 2020, p. 11).” Native Americans once numbered in the millions but by 2010 made up only 0.9 percent of U.S. populace; see above (U.S. Census 2010). Currently, about 2.9 million people identify themselves as Native American alone, while an additional 2.3 million identify themselves as Native American mixed with another ethnic group (Norris, Vines, and Hoeffel 2012).
Sociology in the Real World
Sports Teams with Native American Names
Figure 11.8 — 11.5 Race and Ethnicity in the United States
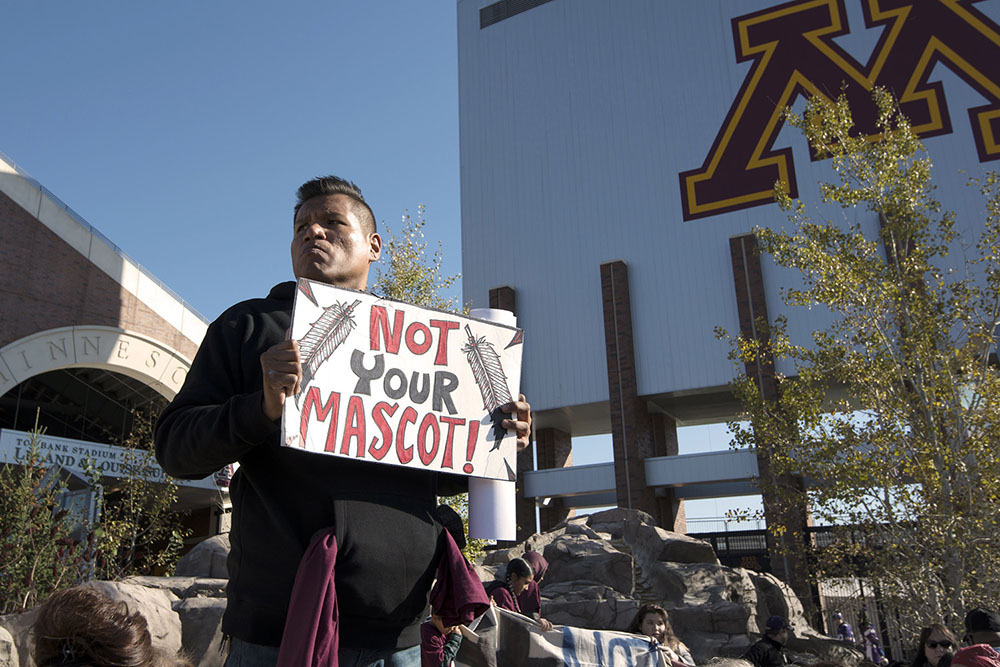
Figure 11.8 Many Native Americans (and others) believe sports teams with names like the Indians, Braves, and Warriors perpetuate unwelcome stereotypes. The Not Your Mascot protest was one of many directed at the then Washington Redskins, which eventually changed its name. (Credit: Fibonacci Blue/fickr)
The sports world abounds with team names like the Indians, the Warriors, the Braves, and even the Savages and Redskins. These names arise from historically prejudiced views of Native Americans as fierce, brave, and strong: attributes that would be beneficial to a sports team, but are not necessarily beneficial to people in the United States who should be seen as more than that.
Since the civil rights movement of the 1960s, the National Congress of American Indians (NCAI) has been campaigning against the use of such mascots, asserting that the “warrior savage myth . . . reinforces the racist view that Indians are uncivilized and uneducated and it has been used to justify policies of forced assimilation and destruction of Indian culture” (NCAI Resolution #TUL-05-087 2005). The campaign has met with limited success. While some teams have changed their names, hundreds of professional, college, and K–12 school teams still have names derived from this stereotype. Another group, American Indian Cultural Support (AICS), is especially concerned with the use of such names at K–12 schools, influencing children when they should be gaining a fuller and more realistic understanding of Native Americans than such stereotypes supply.
After years of pressure and with a wider sense of social justice and cultural sensitivity, the Washington football team removed their offensive name before the 2020 season, and the Cleveland Major League baseball team announced it would change its name after the 2021 season.
What do you think about such names? Should they be allowed or banned? What argument would a symbolic interactionist make on this topic?
History of Intergroup Relations
Native American culture prior to European settlement is referred to as Pre-Columbian: that is, prior to the coming of Christopher Columbus in 1492. Mistakenly believing that he had landed in the East Indies, Columbus named the indigenous people “Indians,” a name that has persisted for centuries despite being a geographical misnomer and one used to blanket hundreds of sovereign tribal nations (NCAI 2020).
The history of intergroup relations between European colonists and Native Americans is a brutal one. As discussed in the section on genocide, the effect of European settlement of the Americans was to nearly destroy the indigenous population. And although Native Americans’ lack of immunity to European diseases caused the most deaths, overt mistreatment and massacres of Native Americans by Europeans were devastating as well.
From the first Spanish colonists to the French, English, and Dutch who followed, European settlers took what land they wanted and expanded across the continent at will. If indigenous people tried to retain their stewardship of the land, Europeans fought them off with superior weapons. Europeans’ domination of the Americas was indeed a conquest; one scholar points out that Native Americans are the only minority group in the United States whose subordination occurred purely through conquest by the dominant group (Marger 1993).
After the establishment of the United States government, discrimination against Native Americans was codified and formalized in a series of laws intended to subjugate them and keep them from gaining any power. Some of the most impactful laws are as follows:
The Indian Removal Act of 1830 forced the relocation of any Native tribes east of the Mississippi River to lands west of the river.
The Indian Appropriation Acts funded further removals and declared that no Indian tribe could be recognized as an independent nation, tribe, or power with which the U.S. government would have to make treaties. This made it even easier for the U.S. government to take land it wanted.
The Dawes Act of 1887 reversed the policy of isolating Native Americans on reservations, instead forcing them onto individual properties that were intermingled with White settlers, thereby reducing their capacity for power as a group.
Native American culture was further eroded by the establishment of boarding schools in the late nineteenth century. These schools, run by both Christian missionaries and the United States government, had the express purpose of “civilizing” Native American children and assimilating them into White society. The boarding schools were located off-reservation to ensure that children were separated from their families and culture. Schools forced children to cut their hair, speak English, and practice Christianity. Physical and sexual abuses were rampant for decades; only in 1987 did the Bureau of Indian Affairs issue a policy on sexual abuse in boarding schools. Some scholars argue that many of the problems that Native Americans face today result from almost a century of mistreatment at these boarding schools.
Current Status
The eradication of Native American culture continued until the 1960s, when Native Americans were able to participate in and benefit from the civil rights movement. The Indian Civil Rights Act of 1968 guaranteed Indian tribes most of the rights of the United States Bill of Rights. New laws like the Indian Self-Determination Act of 1975 and the Education Assistance Act of the same year recognized tribal governments and gave them more power. Indian boarding schools have dwindled to only a few, and Native American cultural groups are striving to preserve and maintain old traditions to keep them from being lost forever. Today, Native Americans are citizens of three sovereigns: their tribal nations, the United States, and the state in which they reside (NCAI 2020).
However, Native Americans (some of whom wish to be called American Indians so as to avoid the “savage” connotations of the term “native”) still suffer the effects of centuries of degradation. Long-term poverty, inadequate education, cultural dislocation, and high rates of unemployment contribute to Native American populations falling to the bottom of the economic spectrum. Native Americans also suffer disproportionately with lower life expectancies than most groups in the United States.
African Americans
As discussed in the section on race, the term African American can be a misnomer for many individuals. Many people with dark skin may have their more recent roots in Europe or the Caribbean, seeing themselves as Dominican American or Dutch American, for example. Further, actual immigrants from Africa may feel that they have more of a claim to the term African American than those who are many generations removed from ancestors who originally came to this country.
The U.S. Census Bureau (2019) estimates that at least 13.4 percent of the United States' population is Black.
How and Why They Came
African Americans are the exemplar minority group in the United States whose ancestors did not come here by choice. A Dutch sea captain brought the first Africans to the Virginia colony of Jamestown in 1619 and sold them as indentured servants. (Indentured servants are people who are committed to work for a certain period of time, typically without formal pay). This was not an uncommon practice for either Black or White people, and indentured servants were in high demand. For the next century, Black and White indentured servants worked side by side. But the growing agricultural economy demanded greater and cheaper labor, and by 1705, Virginia passed the slave codes declaring that any foreign-born non-Christian could be enslaved, and that enslaved people were considered property.
The next 150 years saw the rise of U.S. slavery, with Black Africans being kidnapped from their own lands and shipped to the New World on the trans-Atlantic journey known as the Middle Passage. Once in the Americas, the Black population grew until U.S.-born Black people outnumbered those born in Africa. But colonial (and later, U.S.) slave codes declared that the child of an enslaved person was also an enslaved person, so the slave class was created. By 1808, the slave trade was internal in the United States, with enslaved people being bought and sold across state lines like livestock.
History of Intergroup Relations
There is no starker illustration of the dominant-subordinate group relationship than that of slavery. In order to justify their severely discriminatory behavior, slaveholders and their supporters viewed Black people as innately inferior. Enslaved people were denied even the most basic rights of citizenship, a crucial factor for slaveholders and their supporters. Slavery poses an excellent example of conflict theory’s perspective on race relations; the dominant group needed complete control over the subordinate group in order to maintain its power. Whippings, executions, rapes, and denial of schooling and health care were widely practiced.
Slavery eventually became an issue over which the nation divided into geographically and ideologically distinct factions, leading to the Civil War. And while the abolition of slavery on moral grounds was certainly a catalyst to war, it was not the only driving force. Students of U.S. history will know that the institution of slavery was crucial to the Southern economy, whose production of crops like rice, cotton, and tobacco relied on the virtually limitless and cheap labor that slavery provided. In contrast, the North didn’t directly benefit economically from slavery, resulting in an economic disparity tied to racial/political issues.
A century later, the civil rights movement was characterized by boycotts, marches, sit-ins, and freedom rides: demonstrations by a subordinate group and their supporters that would no longer willingly submit to domination. The major blow to America’s formally institutionalized racism was the Civil Rights Act of 1964. This Act, which is still important today, banned discrimination based on race, color, religion, sex, or national origin.
Current Status
Although government-sponsored, formalized discrimination against African Americans has been outlawed, true equality does not yet exist. The National Urban League’s 2020 Equality Index reports that Black people’s overall equality level with White people has been generally improving. Measuring standards of civic engagement, economics, education, and others, Black people had an equality level of 71 percent in 2010 and had an equality level of 74 percent in 2020. The Index, which has been published since 2005, notes a growing trend of increased inequality with White people, especially in the areas of unemployment, insurance coverage, and incarceration. Black people also trail White people considerably in the areas of economics, health, and education (National Urban League 2020).
To what degree do racism and prejudice contribute to this continued inequality? The answer is complex. 2008 saw the election of this country’s first African American president: Barack Obama. Despite being popularly identified as Black, we should note that President Obama is of a mixed background that is equally White, and although all presidents have been publicly mocked at times (Gerald Ford was depicted as a klutz, Bill Clinton as someone who could not control his libido), a startling percentage of the critiques of Obama were based on his race. In a number of other chapters, we discuss racial disparities in healthcare, education, incarceration, and other areas.
Although Black people have come a long way from slavery, the echoes of centuries of disempowerment are still evident.
Sociology in the Real World
Black People Are Still Seeking Racial Justice
Figure 11.9 — 11.5 Race and Ethnicity in the United States
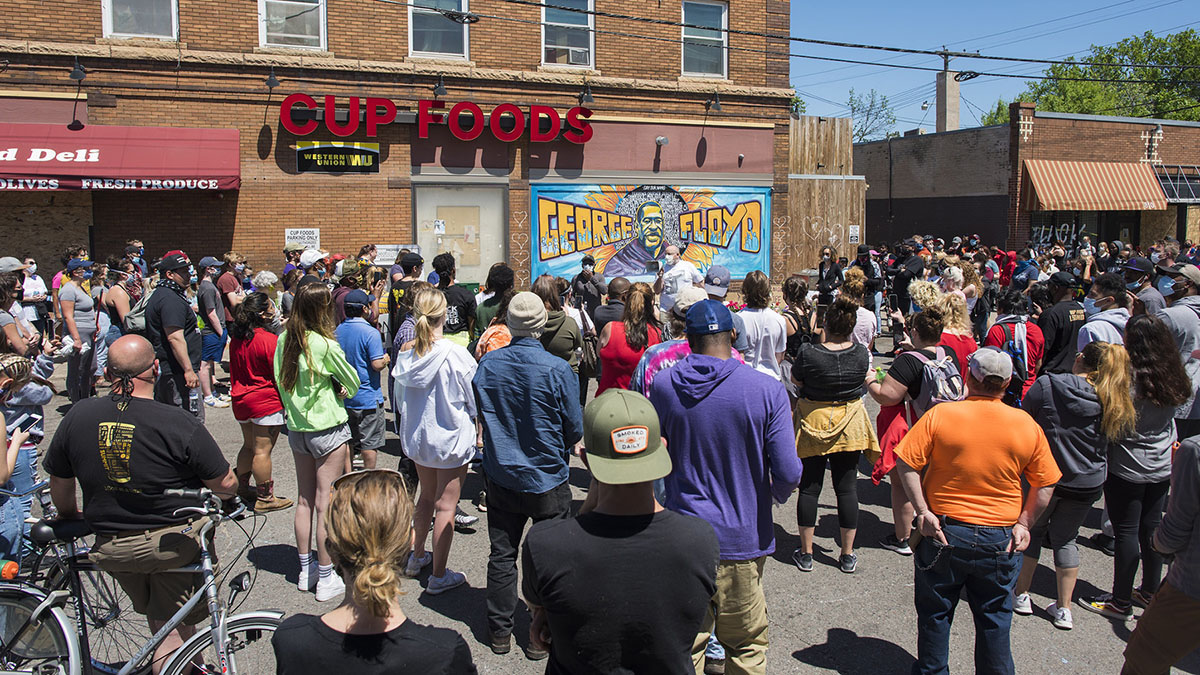
Figure 11.9 This gathering at the site of George Floyd's death took place five days after he was killed. The location, at Chicago Avenue and 38th Street in Minneapolis, became a memorial. (Credit: Fibbonacci Blue/flickr)
In 2020, racial justice movements expanded their protests against incidents of police brutality and all racially motivated violence against Black people. Black Lives Matter (BLM), an organization founded in 2013 in response to the acquittal of George Zimmerman, was a core part of the movement to protest the killings of George Floyd, Breonna Taylor and other Black victims of police violence. Millions of people from all racial backgrounds participated in the movement directly or indirectly, demanding justice for the victims and their families, redistributing police department funding to drive more holistic and community-driven law enforcement, addressing systemic racism, and introducing new laws to punish police officers who kill innocent people.
The racial justice movement has been able to achieve some of these demands. For example, Minneapolis City Council unanimously approved a $27 million settlement to the family of George Floyd in March 2021, the largest pre-trial settlement in a civil rights wrongful death case in history (Shapiro and Lloyd, 2021). $500,000 from the settlement amount is intended to enhance the business district in the area where Floyd died. Floyd, a 46-year-old Black man, was arrested and murdered in Minneapolis on May 25, 2020. Do you think such a settlement is adequate to provide justice for the victims, their families and communities affected by the horrific racism? What else should be done more? How can you contribute to bring desired changes?
Asian Americans
Asian Americans represent a great diversity of cultures and backgrounds. The experience of a Japanese American whose family has been in the United States for three generations will be drastically different from a Laotian American who has only been in the United States for a few years. This section primarily discusses Chinese, Japanese, Korean, and Vietnamese immigrants and shows the differences between their experiences. The most recent estimate from the U.S. Census Bureau (2019) suggest about 5.9 percent of the population identify themselves as Asian.
How and Why They Came
The national and ethnic diversity of Asian American immigration history is reflected in the variety of their experiences in joining U.S. society. Asian immigrants have come to the United States in waves, at different times, and for different reasons.
The first Asian immigrants to come to the United States in the mid-nineteenth century were Chinese. These immigrants were primarily men whose intention was to work for several years in order to earn incomes to support their families in China. Their main destination was the American West, where the Gold Rush was drawing people with its lure of abundant money. The construction of the Transcontinental Railroad was underway at this time, and the Central Pacific section hired thousands of migrant Chinese men to complete the laying of rails across the rugged Sierra Nevada mountain range. Chinese men also engaged in other manual labor like mining and agricultural work. The work was grueling and underpaid, but like many immigrants, they persevered.
Japanese immigration began in the 1880s, on the heels of the Chinese Exclusion Act of 1882. Many Japanese immigrants came to Hawaii to participate in the sugar industry; others came to the mainland, especially to California. Unlike the Chinese, however, the Japanese had a strong government that negotiated with the U.S. government to ensure the well-being of their immigrants. Japanese men were able to bring their wives and families to the United States, and were thus able to produce second- and third-generation Japanese Americans more quickly than their Chinese counterparts.
The most recent large-scale Asian immigration came from Korea and Vietnam and largely took place during the second half of the twentieth century. While Korean immigration has been fairly gradual, Vietnamese immigration occurred primarily post-1975, after the fall of Saigon and the establishment of restrictive communist policies in Vietnam. Whereas many Asian immigrants came to the United States to seek better economic opportunities, Vietnamese immigrants came as political refugees, seeking asylum from harsh conditions in their homeland. The Refugee Act of 1980 helped them to find a place to settle in the United States.
Figure 11.10 — 11.5 Race and Ethnicity in the United States
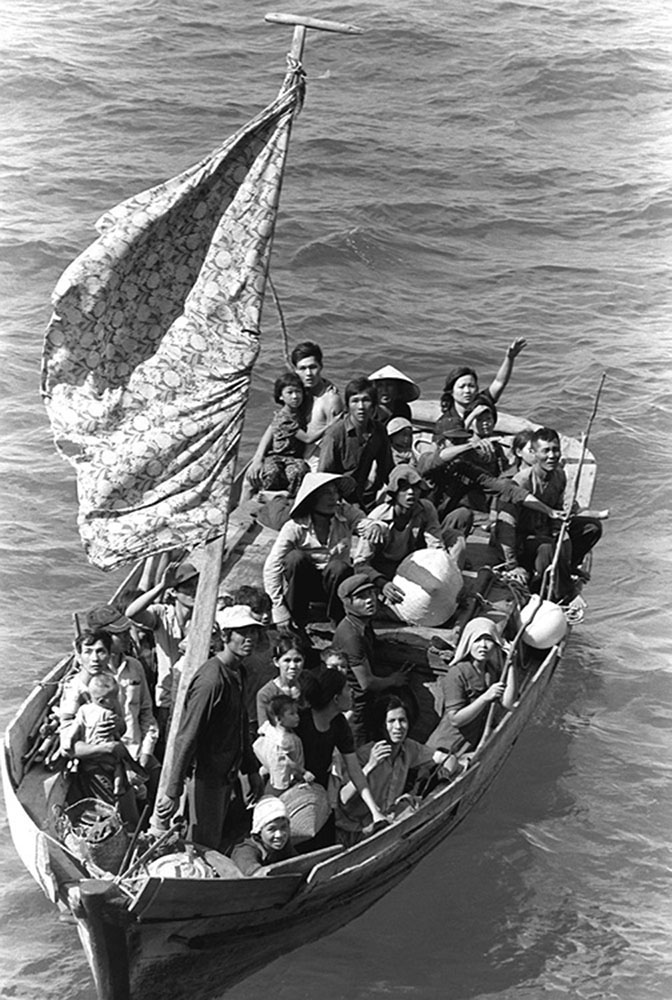
Figure 11.10 Thirty-five Vietnamese refugees wait to be taken aboard the amphibious USS Blue Ridge (LCC-19) . They are being rescued from a thirty-five-foot fishing boat 350 miles northeast of Cam Ranh Bay, Vietnam, after spending eight days at sea. (Credit: U.S. Navy/Wikimedia Commons)
Chinese immigration came to an abrupt end with the Chinese Exclusion Act of 1882. This act was a result of anti-Chinese sentiment burgeoned by a depressed economy and loss of jobs. White workers blamed Chinese migrants for taking jobs, and the passage of the Act meant the number of Chinese workers decreased. Chinese men did not have the funds to return to China or to bring their families to the United States, so they remained physically and culturally segregated in the Chinatowns of large cities. Later legislation, the Immigration Act of 1924, further curtailed Chinese immigration. The Act included the race-based National Origins Act, which was aimed at keeping U.S. ethnic stock as undiluted as possible by reducing “undesirable” immigrants. It was not until after the Immigration and Nationality Act of 1965 that Chinese immigration again increased, and many Chinese families were reunited.
Although Japanese Americans have deep, long-reaching roots in the United States, their history here has not always been smooth. The California Alien Land Law of 1913 was aimed at them and other Asian immigrants, and it prohibited immigrants from owning land. An even uglier action was the Japanese internment camps of World War II, discussed earlier as an illustration of expulsion.
Current Status
Asian Americans certainly have been subject to their share of racial prejudice, despite the seemingly positive stereotype as the model minority. The model minoritystereotype is applied to a minority group that is seen as reaching significant educational, professional, and socioeconomic levels without challenging the existing establishment.
This stereotype is typically applied to Asian groups in the United States, and it can result in unrealistic expectations by putting a stigma on members of this group that do not meet the expectations. Stereotyping all Asians as smart and capable can also lead to a lack of much-needed government assistance and to educational and professional discrimination.
Sociology in the Real World
Hate Crimes Against Asian Americans
Figure 11.11 — 11.5 Race and Ethnicity in the United States
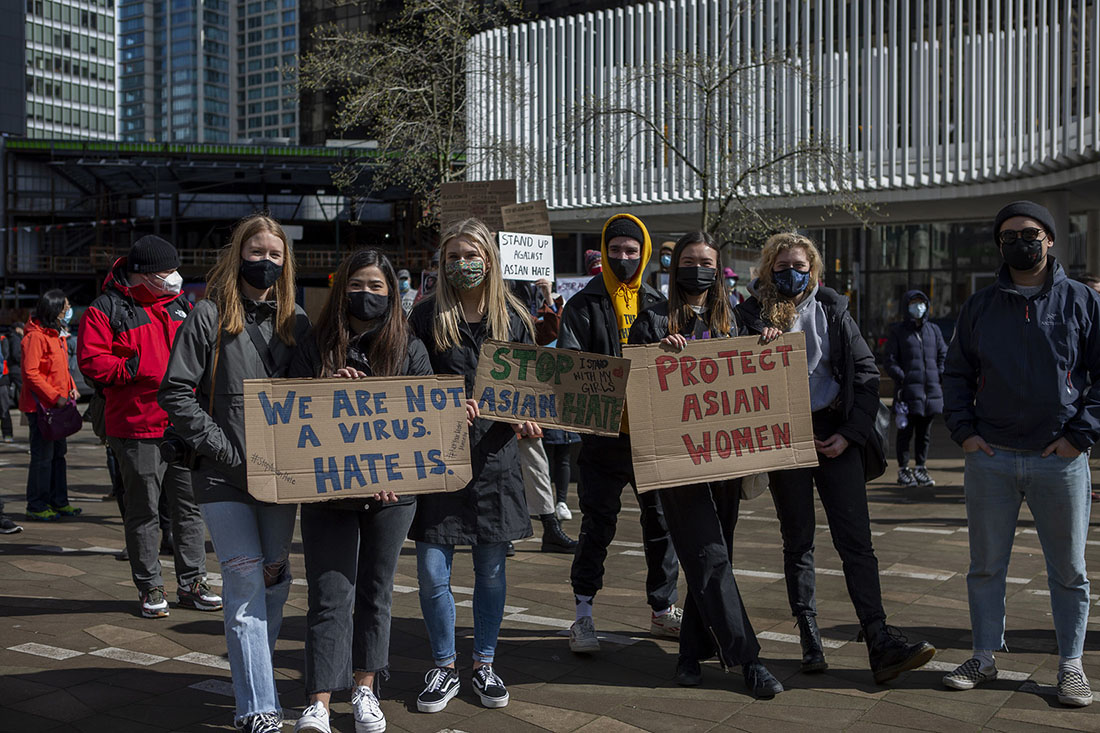
Figure 11.11 In response to widespread attacks against Asian people, partly linked to incorrect associations regarding Asian people and the COVID-19 pandemic, groups around the country and world held Stop Asian Hate rallies like this one in Canada. (Credit: GoToVan/flickr)
Asian Americans across the United States experienced a significant increase in hate crimes, harassment and discrimination tied to the spread of the COVID-19 pandemic. Community trackers recorded more than 3,000 anti-Asian attacks nationwide during 2020 in comparison to about 100 such incidents recorded annually in the prior years (Abdollah 2021). Asian American leaders have been urging community members to report any criminal incidents and demanding local law enforcement agencies commit to greater enforcement of existing hate-crime laws.
Many Asian Americans feel their communities have long been ignored by mainstream politics, media and entertainment although they are considered as a “model minority.” Recently, Asian American journalists are sharing their own stories of discrimination on social media and a growing chorus of federal lawmakers are demanding actions. Do you think you can do something to stop violence against Asian Americans? Can any of your actions not only help Asian Americans but also wider people in the United States?
White Americans
White Americans are the dominant racial group in the United States. According to the U.S. Census Bureau (2019), 76.3 percent of U.S. adults currently identify themselves as White alone. In this section, we will focus on German, Irish, Italian, and Eastern European immigrants.
Why They Came
White ethnic Europeans formed the second and third great waves of immigration, from the early nineteenth century to the mid-twentieth century. They joined a newly minted United States that was primarily made up of White Protestants from England. While most immigrants came searching for a better life, their experiences were not all the same.
The first major influx of European immigrants came from Germany and Ireland, starting in the 1820s. Germans came both for economic opportunity and to escape political unrest and military conscription, especially after the Revolutions of 1848. Many German immigrants of this period were political refugees who wanted to escape from an oppressive government. They were well-off enough to make their way inland, and they formed heavily German enclaves in the Midwest that exist to this day.
The Irish immigrants of the same time period were not always as well off financially, especially after the Irish Potato Famine of 1845. Irish immigrants settled mainly in the cities of the East Coast, where they were employed as laborers and where they faced significant discrimination.
German and Irish immigration continued into the late 19th century and earlier 20th century, at which point the numbers for Southern and Eastern European immigrants started growing as well. Italians, mainly from the Southern part of the country, began arriving in large numbers in the 1890s. Eastern European immigrants—people from Russia, Poland, Bulgaria, and Austria-Hungary—started arriving around the same time. Many of these Eastern Europeans were peasants forced into a hardscrabble existence in their native lands; political unrest, land shortages, and crop failures drove them to seek better opportunities in the United States. The Eastern European immigration wave also included Jewish people escaping pogroms (anti-Jewish massacres) of Eastern Europe and the Pale of Settlement in what was then Poland and Russia.
History of Intergroup Relations
In a broad sense, German immigrants were not victimized to the same degree as many of the other subordinate groups this section discusses. While they may not have been welcomed with open arms, they were able to settle in enclaves and establish roots. A notable exception to this was during the lead up to World War I and through World War II, when anti-German sentiment was virulent.
Irish immigrants, many of whom were very poor, were more of a working poor class than the Germans. In Ireland, the English had oppressed the Irish for centuries, eradicating their language and culture and discriminating against their religion (Catholicism). Although the Irish had a larger population than the English, they were a subordinate group. This dynamic reached into the New World, where Anglo-Americans saw Irish immigrants as a race apart: dirty, lacking ambition, and suitable for only the most menial jobs. In fact, Irish immigrants were subject to criticism identical to that with which the dominant group characterized African Americans. By necessity, Irish immigrants formed tight communities segregated from their Anglo neighbors.
The later wave of immigrants from Southern and Eastern Europe was also subject to intense discrimination and prejudice. In particular, the dominant group—which now included second- and third-generation Germans and Irish—saw Italian immigrants as the dregs of Europe and worried about the purity of the American race (Myers 2007). Italian immigrants lived in segregated slums in Northeastern cities, and in some cases were even victims of violence and lynching similar to what African Americans endured. They undertook physical labor at lower pay than other workers, often doing the dangerous work that other laborers were reluctant to take on, such as earth moving and construction.
Current Status
German Americans are the largest group among White ethnic Americans in the country. For many years, German Americans endeavored to maintain a strong cultural identity, but they are now culturally assimilated into the dominantculture.
There are now more Irish Americans in the United States than there are Irish in Ireland. One of the country’s largest cultural groups, Irish Americans have slowly achieved acceptance and assimilation into the dominant group.
Myers (2007) states that Italian Americans’ cultural assimilation is “almost complete, but with remnants of ethnicity.” The presence of “Little Italy” neighborhoods—originally segregated slums where Italians congregated in the nineteenth century—exist today. While tourists flock to the saints’ festivals in Little Italies, most Italian Americans have moved to the suburbs at the same rate as other White groups. Italian Americans also became more accepted after World War II, partly because of other, newer migrating groups and partly because of their significant contribution to the war effort, which saw over 500,000 Italian Americans join the military and fight against the Axis powers, which included Italy itself.
As you will see in the Religion chapter, Jewish people were also a core immigrant group to the United States. They often resided in tight-knit neighborhoods in a similar way to Italian people. Jewish identity is interesting and varied, in that many Jewish people consider themselves as members of a collective ethnic group as well as a religion, and many Jewish people feel connected by their ancestry as well as their religion. In fact, much of the data around the number of Jewish Americans is presented with caveats about different definitions and identifications of what it means to be Jewish (Lipka 2013).
As we have seen, there is no minority group that fits easily in a category or that can be described simply. While sociologists believe that individual experiences can often be understood in light of their social characteristics (such as race, class, or gender), we must balance this perspective with awareness that no two individuals’ experiences are alike. Making generalizations can lead to stereotypes and prejudice. The same is true for White ethnic Americans, who come from diverse backgrounds and have had a great variety of experiences.
Social Policy and Debate
Thinking about White Ethnic Americans: Arab Americans
Figure 11.12 — 11.5 Race and Ethnicity in the United States
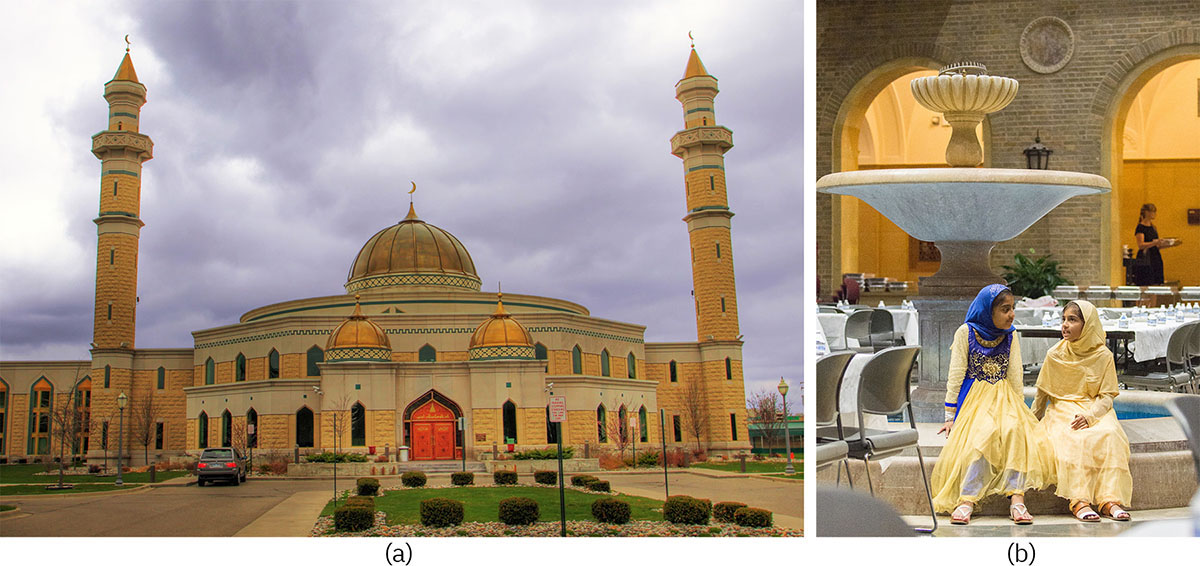
Figure 11.12 The Islamic Center of America in Dearborn, Michigan is the largest mosque, or Islamic religious place of worship, in the United States. Muslim women and girls often wear head coverings, which sometimes makes them a target of harassment. (Credit A: Ryan Ready/flickr; B: U.S. Department of Agriculture/flickr)
The first Arab immigrants came to this country in the late nineteenth and early twentieth centuries. They were predominantly Syrian, Lebanese, and Jordanian Christians, and they came to escape persecution and to make a better life. These early immigrants and their descendants, who were more likely to think of themselves as Syrian or Lebanese than Arab, represent almost half of the Arab American population today (Myers 2007). Restrictive immigration policies from the 1920s until 1965 curtailed immigration, but Arab immigration since 1965 has been steady. Immigrants from this time period have been more likely to be Muslim and more highly educated, escaping political unrest and looking for better opportunities.
The United States was deeply affected by the terrorist attacks of September 11, 2001 and racial profiling has proceeded against Arab Americans since then. Particularly when engaged in air travel, being young and Arab-looking is enough to warrant a special search or detainment. This Islamophobia (irrational fear of or hatred against Muslims) does not show signs of abating. Arab Americans represent all religious practices, despite the stereotype that all Arabic people practice Islam. Geographically, the Arab region comprises the Middle East and parts of North Africa (MENA). People whose ancestry lies in that area or who speak primarily Arabic may consider themselves Arabs.
The U.S. Census has struggled with the issue of Arab identity. The 2020 Census, as in previous years, did not offer a (MENA) category under the question of race. The US government rejected a push by Arab American advocates and organizations to add the new category, meaning that people stemming from the Arab region will be counted as "white" (Harb 2018). Do you think an addition of MENA category is appropriate to reduce prejudice and discrimination against Arab Americans? What other categories should be added to promote racial justice in the United States?
Hispanic Americans
The U.S. Census Bureau uses two ethnicities in collecting and reporting data: “Hispanic or Latino” and “Not Hispanic or Latino." Hispanic or Latino is a person of Cuban, Mexican, Puerto Rican, South or Central American, or other Spanish culture or origin regardless of race. Hispanic Americans have a wide range of backgrounds and nationalities.
The segment of the U.S. population that self-identifies as Hispanic in 2019 was recently estimated at 18.5 percent of the total (U.S. Census Bureau 2019). According to the 2010 U.S. Census, about 75 percent of the respondents who identify as Hispanic report being of Mexican, Puerto Rican, or Cuban origin. Remember that the U.S. Census allows people to report as being more than one ethnicity.
Not only are there wide differences among the different origins that make up the Hispanic American population, but there are also different names for the group itself. Hence, there have been some disagreements over whether Hispanic or Latino is the correct term for a group this diverse, and whether it would be better for people to refer to themselves as being of their origin specifically, for example, Mexican American or Dominican American. This section will compare the experiences of Mexican Americans and Cuban Americans.
How and Why They Came
Mexican Americans form the largest Hispanic subgroup and also the oldest. Mexican migration to the United States started in the early 1900s in response to the need for inexepensive agricultural labor. Mexican migration was often circular; workers would stay for a few years and then go back to Mexico with more money than they could have made in their country of origin. The length of Mexico’s shared border with the United States has made immigration easier than for many other immigrant groups.
Cuban Americans are the second-largest Hispanic subgroup, and their history is quite different from that of Mexican Americans. The main wave of Cuban immigration to the United States started after Fidel Castro came to power in 1959 and reached its crest with the Mariel boatlift in 1980. Castro’s Cuban Revolution ushered in an era of communism that continues to this day. To avoid having their assets seized by the government, many wealthy and educated Cubans migrated north, generally to the Miami area.
History of Intergroup Relations
For several decades, Mexican workers crossed the long border into the United States, both "documented" and "undocumented" to work in the fields that provided produce for the developing United States. Western growers needed a steady supply of labor, and the 1940s and 1950s saw the official federal Bracero Program (bracero is Spanish for strong-arm) that offered protection to Mexican guest workers. Interestingly, 1954 also saw the enactment of “Operation Wetback,” which deported thousands of illegal Mexican workers. From these examples, we can see the U.S. treatment of immigration from Mexico has been ambivalent at best.
Sociologist Douglas Massey (2006) suggests that although the average standard of living than in Mexico may be lower in the United States, it is not so low as to make permanent migration the goal of most Mexicans. However, the strengthening of the border that began with 1986’s Immigration Reform and Control Act has made one-way migration the rule for most Mexicans. Massey argues that the rise of illegal one-way immigration of Mexicans is a direct outcome of the law that was intended to reduce it.
Cuban Americans, perhaps because of their relative wealth and education level at the time of immigration, have fared better than many immigrants. Further, because they were fleeing a Communist country, they were given refugee status and offered protection and social services. The Cuban Migration Agreement of 1995 has curtailed legal immigration from Cuba, leading many Cubans to try to immigrate illegally by boat. According to a 2009 report from the Congressional Research Service, the U.S. government applied a “wet foot/dry foot” policy toward Cuban immigrants; Cubans who were intercepted while still at sea were returned to Cuba, while those who reached the shore were permitted to stay in the United States. This policy ended in 2017.
Current Status
Mexican Americans, especially those who are here undocumented, are at the center of a national debate about immigration. Myers (2007) observes that no other minority group (except the Chinese) has immigrated to the United States in such an environment of legal dispute. He notes that in some years, three times as many Mexican immigrants may have entered the United States undocumented as those who arrived documented. It should be noted that this is due to enormous disparity of economic opportunity on two sides of an open border, not because of any inherent inclination to break laws. In his report, “Measuring Immigrant Assimilation in the United States,” Jacob Vigdor (2008) states that Mexican immigrants experience relatively low rates of economic and civic assimilation. He further suggests that “the slow rates of economic and civic assimilation set Mexicans apart from other immigrants, and may reflect the fact that the large numbers of Mexican immigrants residing in the United States undocumented have few opportunities to advance themselves along these dimensions.”
By contrast, Cuban Americans are often seen as a model minority group within the larger Hispanic group. Many Cubans had higher socioeconomic status when they arrived in this country, and their anti-Communist agenda has made them welcome refugees to this country. In South Florida, especially, Cuban Americans are active in local politics and professional life. As with Asian Americans, however, being a model minority can mask the issue of powerlessness that these minority groups face in U.S. society.
Social Policy and Debate
Arizona’s Senate Bill 1070
Figure 11.13 — 11.5 Race and Ethnicity in the United States
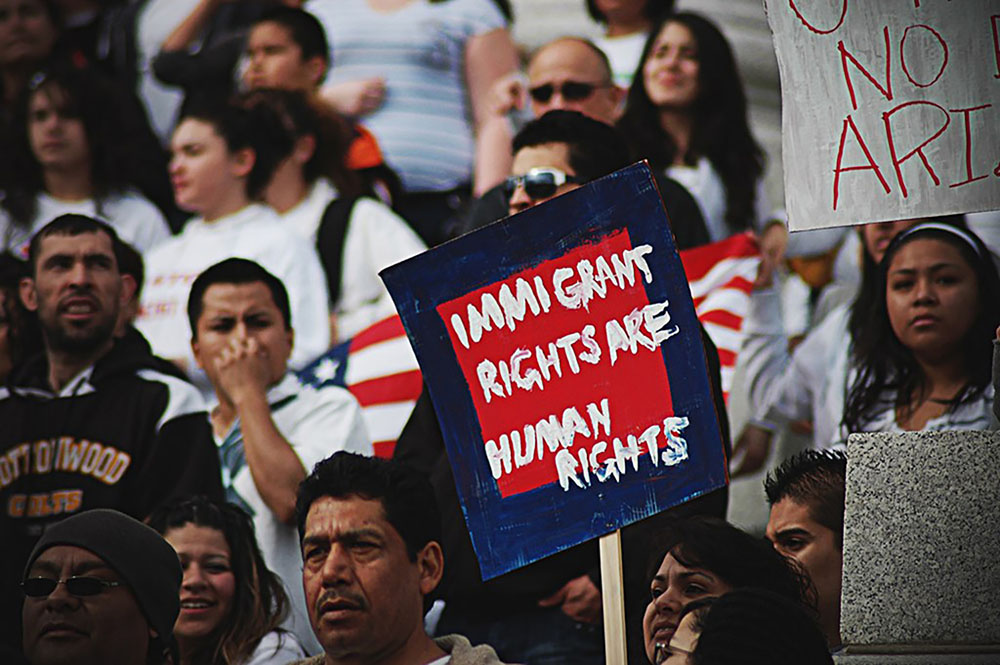
Figure 11.13 Protesters in Arizona dispute the harsh new anti-immigration law. (Credit: rprathap/flickr)
As both legal and unathorized immigrants, and with high population numbers, Mexican Americans are often the target of stereotyping, racism, and discrimination. A harsh example of this is in Arizona, where a stringent immigration law—known as SB 1070 (for Senate Bill 1070)—caused a nationwide controversy. Formally titled "Support Our Law Enforcement and Safe Neighborhoods Act, the law requires that during a lawful stop, detention, or arrest, Arizona police officers must establish the immigration status of anyone they suspect may be here illegally. The law makes it a crime for individuals to fail to have documents confirming their legal status, and it gives police officers the right to detain people they suspect may be in the country illegally.
To many, the most troublesome aspect of this law is the latitude it affords police officers in terms of whose citizenship they may question. Having “reasonable suspicion that the person is an alien who is unlawfully present in the United States” is reason enough to demand immigration papers (Senate Bill 1070 2010). Critics say this law will encourage racial profiling (the illegal practice of law enforcement using race as a basis for suspecting someone of a crime), making it hazardous to be caught “Driving While Brown,” a takeoff on the legal term Driving While Intoxicated (DWI) or the slang reference of “Driving While Black.” Driving While Brown refers to the likelihood of getting pulled over just for being nonWhite.
SB 1070 has been the subject of many lawsuits, from parties as diverse as Arizona police officers, the American Civil Liberties Union, and even the federal government, which sued on the basis of Arizona contradicting federal immigration laws (ACLU 2011). In June 2012, the U.S. Supreme Court ruled on Arizona vs. United States regarding SB 1070. The Court upheld the provision requiring immigration status checks during law enforcement stops but struck down three other provisions. The Court ruled that these provisions violated the Supremacy Clause of the U.S. Constitution.