An age cohort shares a birth period and related historical exposures; age effects reflect development or aging, period effects reflect events affecting many ages, and cohort effects reflect shared timing of experience.
Distinguish age cohorts, life-course processes, and social meanings of aging
An age cohort shares a birth period and related historical exposures; age effects reflect development or aging, period effects reflect events affecting many ages, and cohort effects reflect shared timing of experience. Life-course analysis connects transitions such as schooling, work, caregiving, and retirement with institutions and historical context. Chronological age does not fully describe functional ability or social expectations. Ageism stereotypes or disadvantages people because of age, while age stratification organizes roles and resources by age categories. Comparing young and old people at one time cannot by itself distinguish aging from cohort differences; repeated longitudinal and cohort comparisons improve interpretation.
Source: 13.1 Who Are the Elderly? Aging in Society · 13.2 The Process of Aging · 12.1 Sex, Gender, Identity, and Expression · 12.2 Gender and Gender Inequality · 11.1 Racial, Ethnic, and Minority Groups · 11.4 Intergroup Relationships · 11.5 Race and Ethnicity in the United States
Distinguish sex and gender and explain social construction and gender segregation
Sex refers to biological characteristics such as reproductive anatomy, hormones, and chromosomes, which do not always align in a simple binary. Gender includes socially organized roles, expression, and identities; gender identity is a person’s internal sense of gender. Gender segregation distributes people unevenly across occupations, spaces, or roles. Horizontal segregation separates fields, while vertical segregation concentrates groups at different authority levels. Social construction means meanings and expectations are historically organized, not that biology or lived experience is unreal. Analyze institutional practices and opportunities without assuming an individual’s identity, behavior, or ability from sex-associated traits.
Source: 13.1 Who Are the Elderly? Aging in Society · 13.2 The Process of Aging · 12.1 Sex, Gender, Identity, and Expression · 12.2 Gender and Gender Inequality · 11.1 Racial, Ethnic, and Minority Groups · 11.4 Intergroup Relationships · 11.5 Race and Ethnicity in the United States
Explain the social construction of race, racialization, racial formation, and ethnicity
Race is a socially constructed classification often linked to perceived ancestry and appearance; its categories and boundaries vary historically. Racialization assigns racial meanings to people, practices, or institutions. Racial formation describes how social and political processes create, maintain, and transform categories and their consequences. Ethnicity emphasizes shared cultural history, language, ancestry, or affiliation and is not interchangeable with race. Social construction does not make discrimination or health consequences imaginary. Within-group genetic variation and overlapping ancestry mean racial labels are unreliable substitutes for individual genotype, exposure, or physiology; mechanisms must be measured directly.
Source: 13.1 Who Are the Elderly? Aging in Society · 13.2 The Process of Aging · 12.1 Sex, Gender, Identity, and Expression · 12.2 Gender and Gender Inequality · 11.1 Racial, Ethnic, and Minority Groups · 11.4 Intergroup Relationships · 11.5 Race and Ethnicity in the United States
Relate immigration patterns and sexual orientation to demographic structure and intersecting social experiences
Immigration changes population composition through migrants’ ages, origins, family ties, and settlement patterns; legal and institutional contexts shape opportunity after arrival. Selection can make migrants differ from both origin and receiving populations, complicating simple health comparisons. Sexual orientation concerns patterns of attraction and identity and differs from gender identity; identity, attraction, and behavior are related but not identical survey measures. Intersectional experiences depend on combinations of age, class, race, migration status, gender, and orientation. Counting one category without examining measurement, underreporting, and context can hide important differences within it.
Source: 13.1 Who Are the Elderly? Aging in Society · 13.2 The Process of Aging · 12.1 Sex, Gender, Identity, and Expression · 12.2 Gender and Gender Inequality · 11.1 Racial, Ethnic, and Minority Groups · 11.4 Intergroup Relationships · 11.5 Race and Ethnicity in the United States
Apply the ideas
Worked question. A survey finds that older adults use a new app less often than younger adults. Can the result be labeled an aging effect? What changes if the same birth cohorts are followed over time?
The cross-sectional result can reflect age, cohort experience, access, or period conditions. Following cohorts helps observe within-person change, though period effects and selective attrition remain. Measure device access and training as well as age. Likewise, a racial difference in app access would require investigation of resources and institutions rather than an unsupported biological explanation.
Source: 13.1 Who Are the Elderly? Aging in Society · 13.2 The Process of Aging · 12.1 Sex, Gender, Identity, and Expression · 12.2 Gender and Gender Inequality · 11.1 Racial, Ethnic, and Minority Groups · 11.4 Intergroup Relationships · 11.5 Race and Ethnicity in the United States
13.1 Who Are the Elderly? Aging in Society — figures and tables
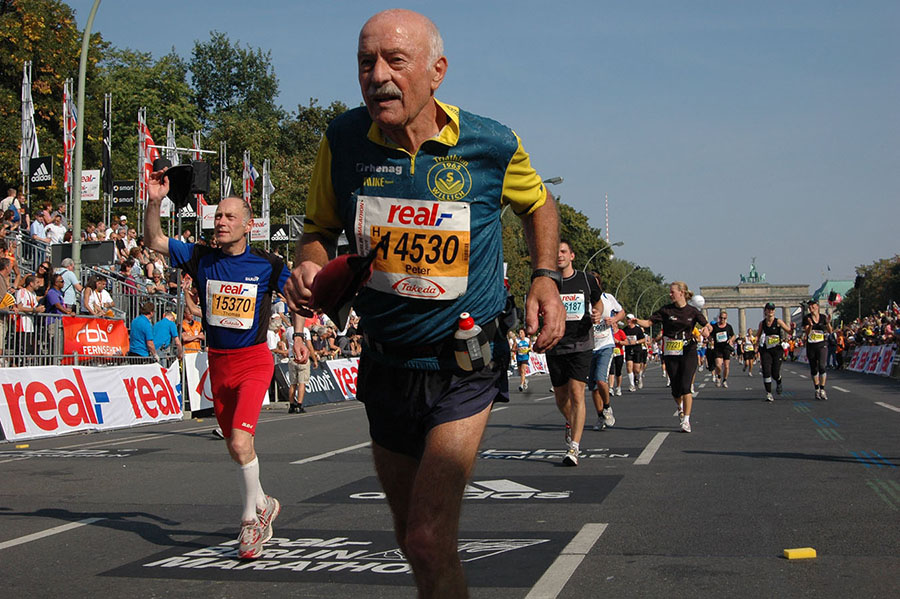
Figure 13.2 Elderly people may not always conform to society's expectations of their attitudes or their abilities. While we don't know whether or not these marathon participants are running competitively, it's clear the older person in the foreground is ahead of many younger people. (Credit: Mike Kaden/flickr)
Tonja R. Conerly, Kathleen Holmes, and Asha Lal Tamang, Introduction Sociology 3E, OpenStax. · CC BY-NC-SA 4.0 · Original image ↗ · Access for free ↗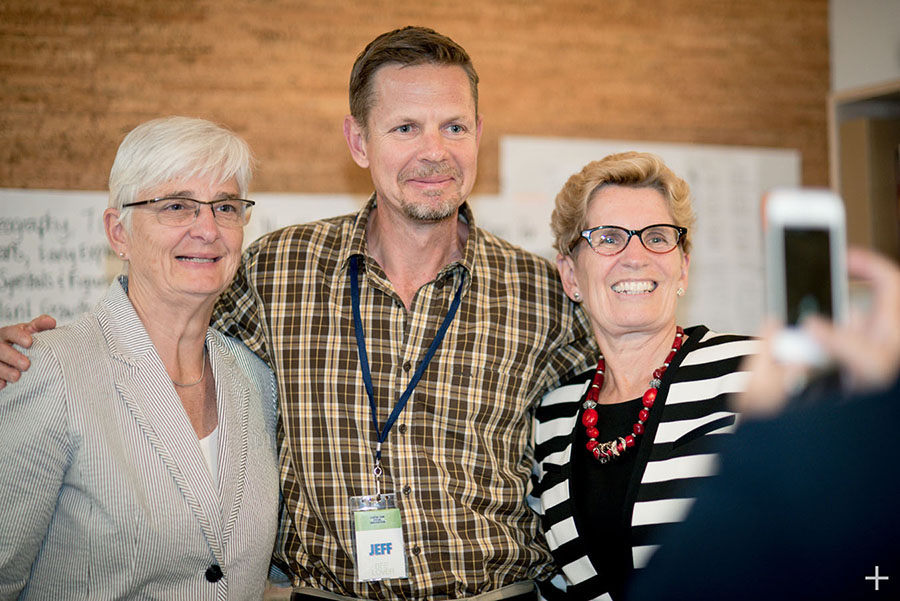
Figure 13.3 How old are these people? In modern U.S. society, appearance is not a reliable indicator of age. In addition to genetic differences, health habits, hair dyes, and attitudes make traditional signs of aging increasingly unreliable. (Credit: Jason Hargrove/flickr)
Tonja R. Conerly, Kathleen Holmes, and Asha Lal Tamang, Introduction Sociology 3E, OpenStax. · CC BY-NC-SA 4.0 · Original image ↗ · Access for free ↗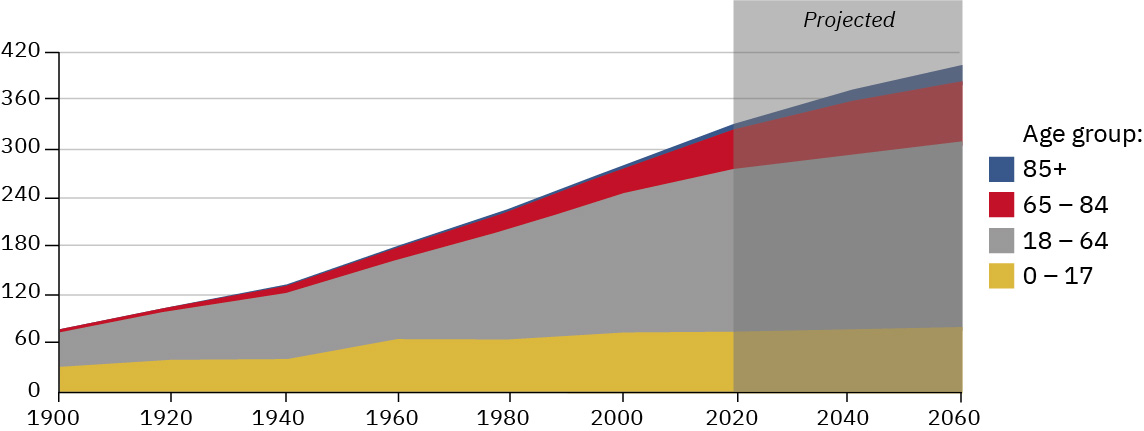
Figure 13.4 This population chart shows the population size of people in different age groups. The youngest age group, at the bottom, remains largely static. The 18-64 age group has been growing and will continue to do so. But most notable is the increasing size of the third tier (orange) representing ages 65-84. As the chapter discusses, this group is growing significantly, shown by the increasing share of the overall graph it takes up. Also of note is the group at the very top, which is also growing in size. (For comparison, can you even detect the line representing 85+ on the left side of the graph, closer to the year 1900?) (Credit: US Census Bureau.)
Tonja R. Conerly, Kathleen Holmes, and Asha Lal Tamang, Introduction Sociology 3E, OpenStax. · CC BY-NC-SA 4.0 · Original image ↗ · Access for free ↗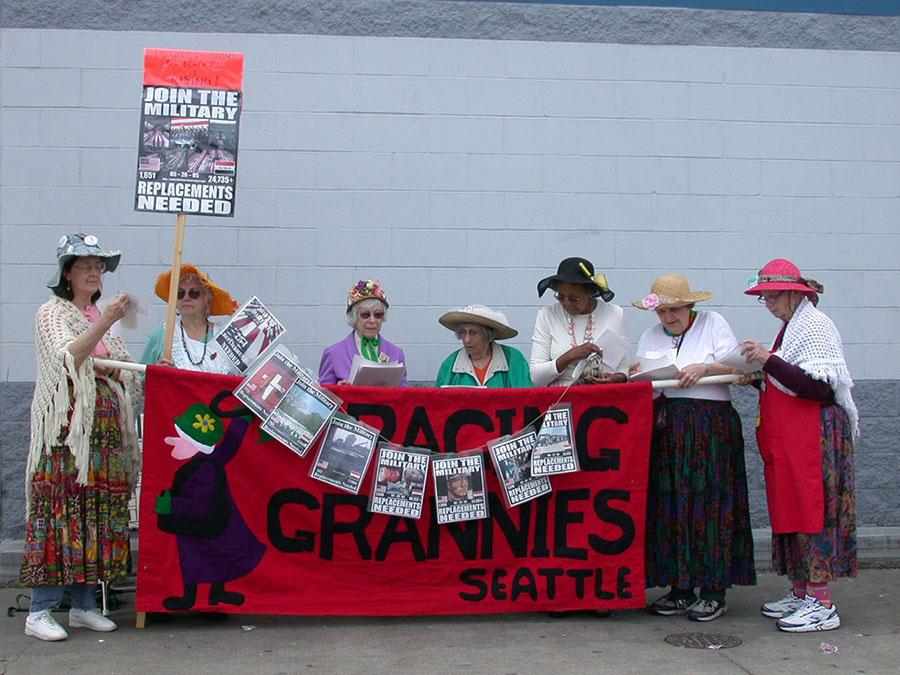
Figure 13.5 Senior citizens are an important political constituency, and they may use their age to their advantage. Originating in Canada in the late 1980s, groups of Raging Grannies have protested nuclear weapons, the Iraq War, pesticides, genetically modified foods, and racial injustice. (Credit: Brave New Films/flickr)
Tonja R. Conerly, Kathleen Holmes, and Asha Lal Tamang, Introduction Sociology 3E, OpenStax. · CC BY-NC-SA 4.0 · Original image ↗ · Access for free ↗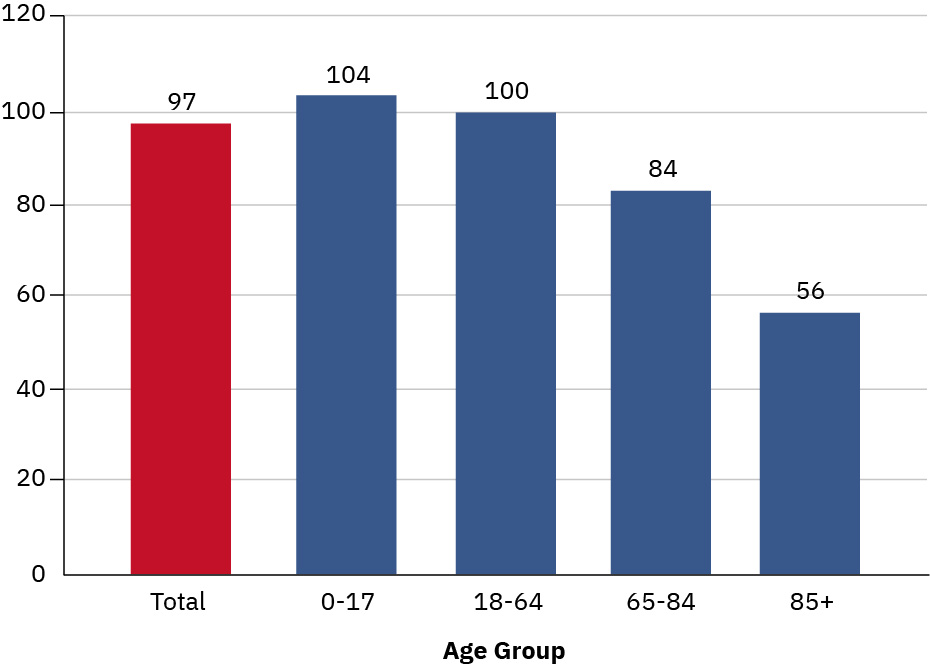
Figure 13.6 This U.S. Census graph shows the number of males per 100 females. However, over the past two decades, men have narrowed the percentage by which women outlive them. (Credit: the U.S. Census Bureau)
Tonja R. Conerly, Kathleen Holmes, and Asha Lal Tamang, Introduction Sociology 3E, OpenStax. · CC BY-NC-SA 4.0 · Original image ↗ · Access for free ↗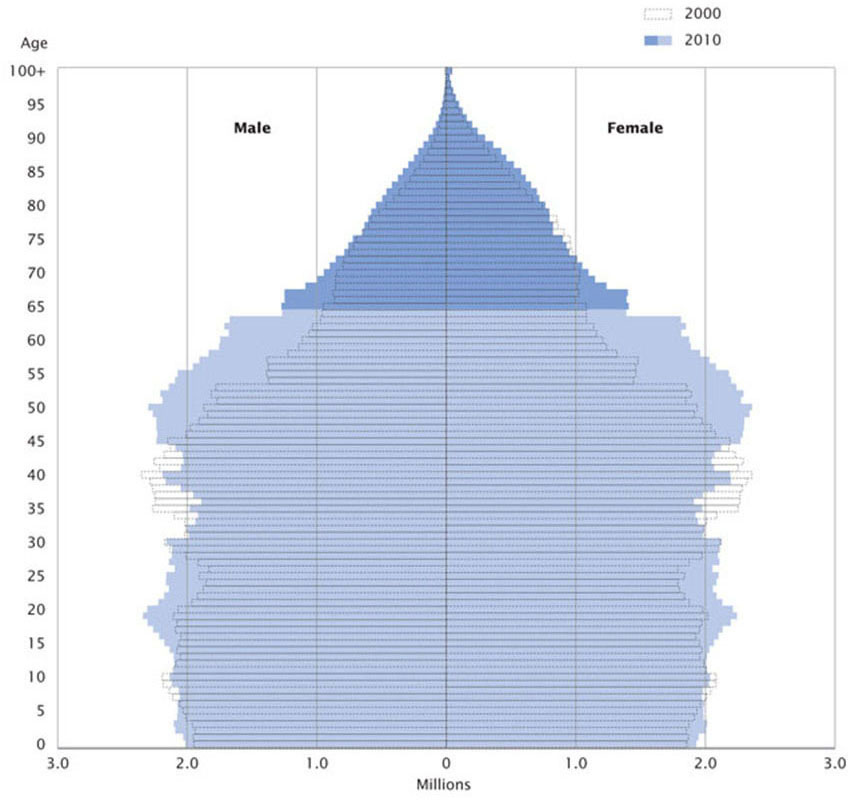
Figure 13.7 Population by Age and Sex: 2000 and 2010. In this U.S. Census pyramid chart, the baby boom bulge was aged thirty-five to fifty-five in 2000. In 2020, they were aged fifty-five to seventy-five. (Credit: the U.S. Census Bureau)
Tonja R. Conerly, Kathleen Holmes, and Asha Lal Tamang, Introduction Sociology 3E, OpenStax. · CC BY-NC-SA 4.0 · Original image ↗ · Access for free ↗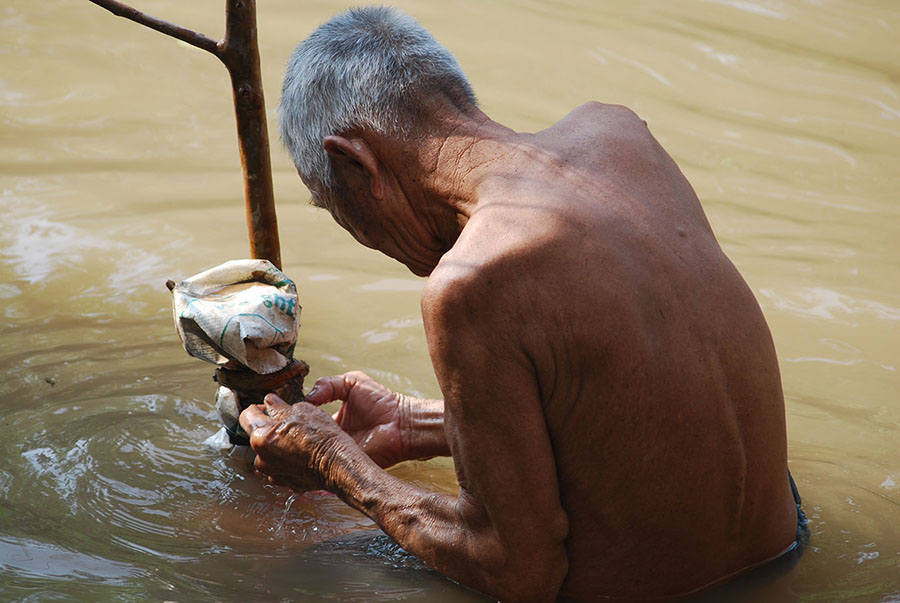
Figure 13.8 Cultural values and attitudes can shape people’s experience of aging. (Credit: Tom Coppen/flickr)
Tonja R. Conerly, Kathleen Holmes, and Asha Lal Tamang, Introduction Sociology 3E, OpenStax. · CC BY-NC-SA 4.0 · Original image ↗ · Access for free ↗| Boomer response | Gen X response | Millennial response | |
|---|---|---|---|
| At what age does youth end? | 31 | 31 | 40 |
| At what age is the prime of life? | 50 | 47 | 36 |
| At what age is someone old? | 73 | 65 | 59 |
Table 13.1 A survey conducted by the U.S. Trust gathered opinion data on the aging milestones and categories. Boomers, Gen X people, and Millennials had generally different views.. Tonja R. Conerly, Kathleen Holmes, and Asha Lal Tamang, Introduction Sociology 3E, OpenStax.
13.2 The Process of Aging — figures and tables
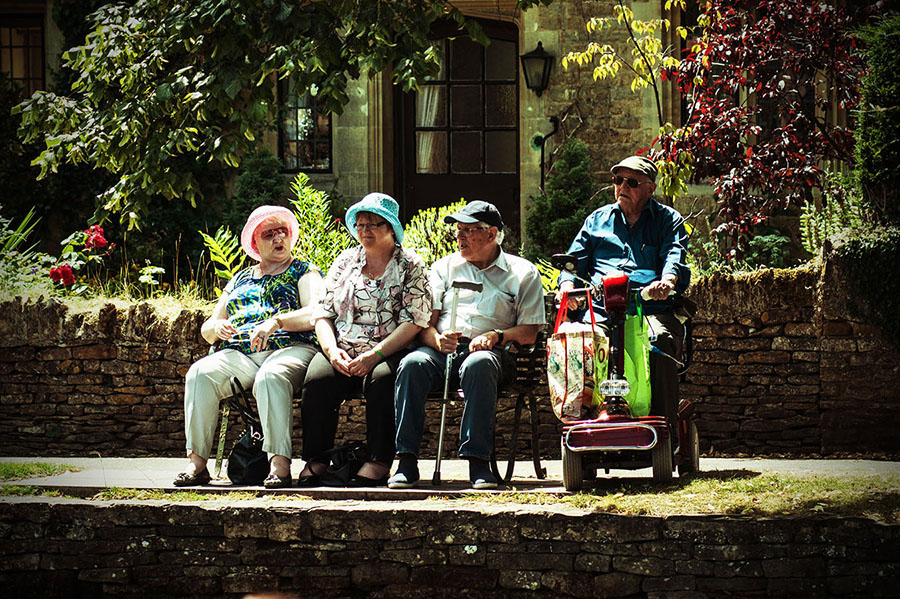
Figure 13.9 Aging can be a visible, public experience. Canes, scooters, and other necessities are recognized signs of aging. Because of the meanings that culture assigns to these changes, people believe that being older means being in physical decline. Many older people, however, remain healthy, active, and happy. (Credit: Phil Dolby/flickr)
Tonja R. Conerly, Kathleen Holmes, and Asha Lal Tamang, Introduction Sociology 3E, OpenStax. · CC BY-NC-SA 4.0 · Original image ↗ · Access for free ↗
Figure 13.10 Aging is accompanied by a host of biological, social, and psychological changes. Depending on their health, older people can engage in the same activities they always have, or even try new ones. (Credit: Forest Service Alaska Region/flickr)
Tonja R. Conerly, Kathleen Holmes, and Asha Lal Tamang, Introduction Sociology 3E, OpenStax. · CC BY-NC-SA 4.0 · Original image ↗ · Access for free ↗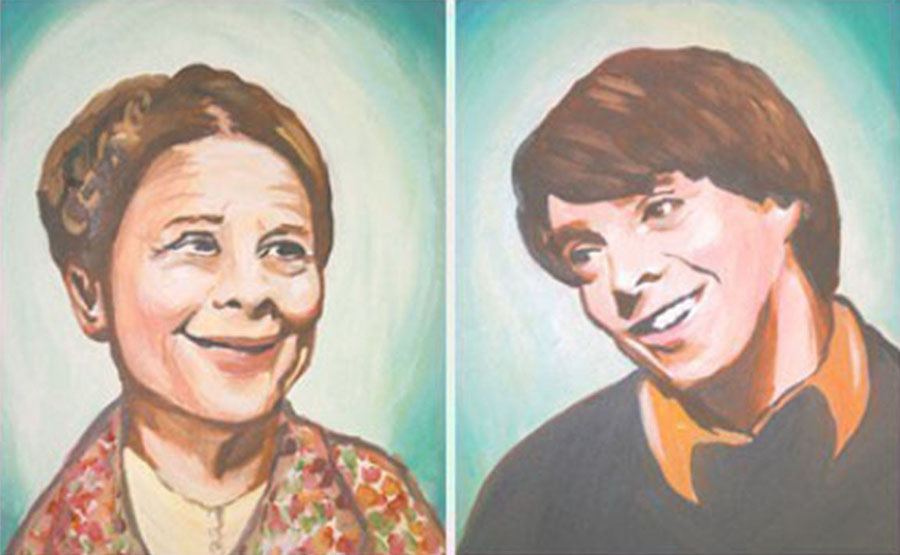
Figure 13.11 In Harold and Maude , a 1971 cult classic movie, a twenty-something young man falls in love with a seventy-nine-year-old woman. The world disapproves. (Credit: luckyjackson/flickr)
Tonja R. Conerly, Kathleen Holmes, and Asha Lal Tamang, Introduction Sociology 3E, OpenStax. · CC BY-NC-SA 4.0 · Original image ↗ · Access for free ↗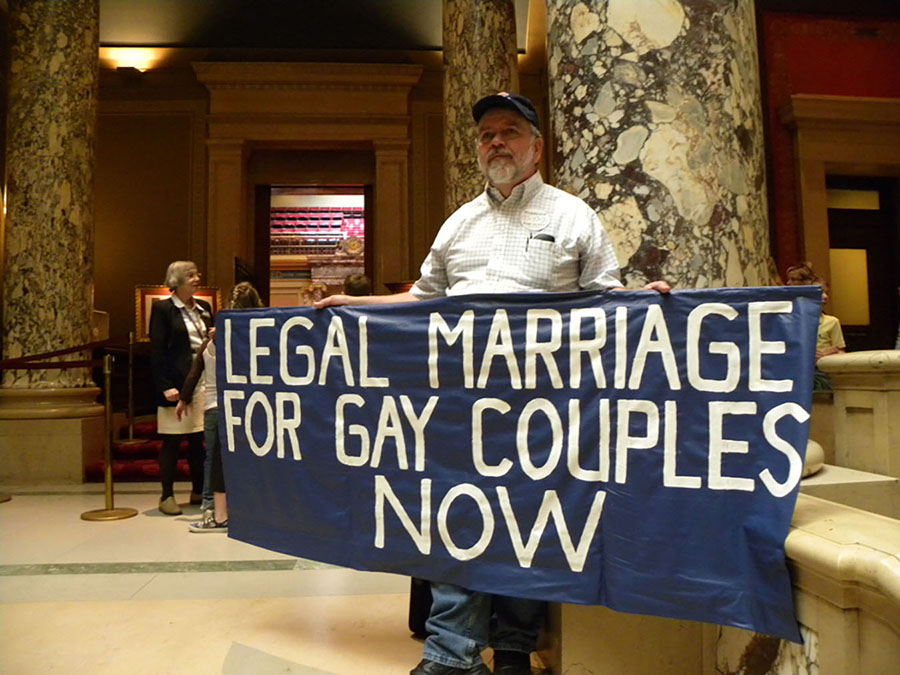
Figure 13.12 As same-sex marriage becomes a possibility, many gay and lesbian couples are finally able to tie the knot—sometimes as seniors—after decades of waiting. (Credit: Fibonacci Blue/flickr).
Tonja R. Conerly, Kathleen Holmes, and Asha Lal Tamang, Introduction Sociology 3E, OpenStax. · CC BY-NC-SA 4.0 · Original image ↗ · Access for free ↗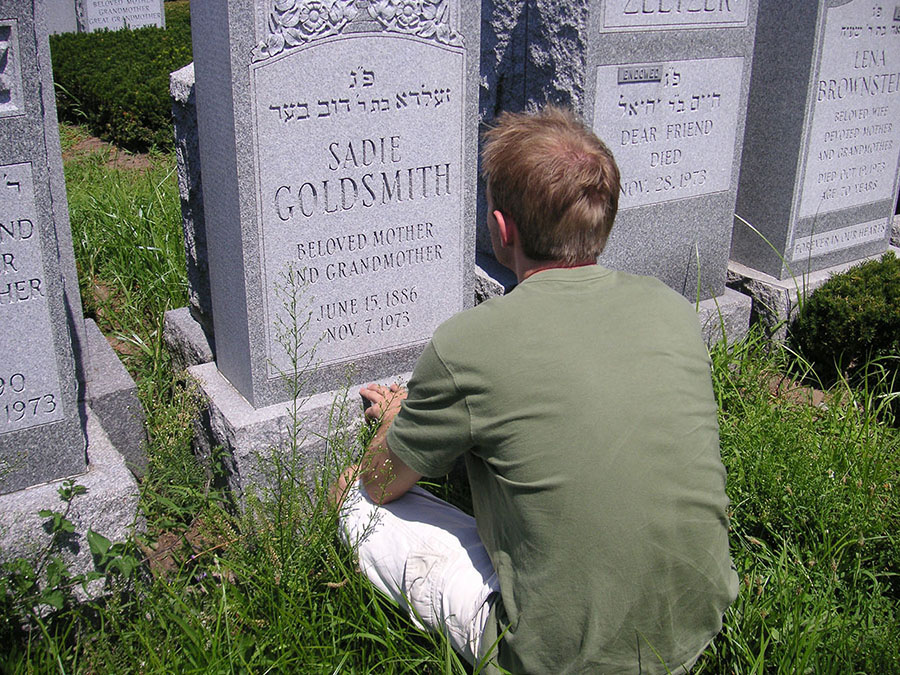
Figure 13.13 A young man sits at the grave of his great-grandmother. (Credit: Sara Goldsmith/flickr)
Tonja R. Conerly, Kathleen Holmes, and Asha Lal Tamang, Introduction Sociology 3E, OpenStax. · CC BY-NC-SA 4.0 · Original image ↗ · Access for free ↗Source: 13.2 The Process of Aging
12.1 Sex, Gender, Identity, and Expression — figures and tables

Figure 12.2 While the biological differences between males and females are fairly straightforward, the social and cultural aspects of being a man or woman can be complicated. (Credit: Mapbox Uncharted ERG /flickr)
Tonja R. Conerly, Kathleen Holmes, and Asha Lal Tamang, Introduction Sociology 3E, OpenStax. · CC BY-NC-SA 4.0 · Original image ↗ · Access for free ↗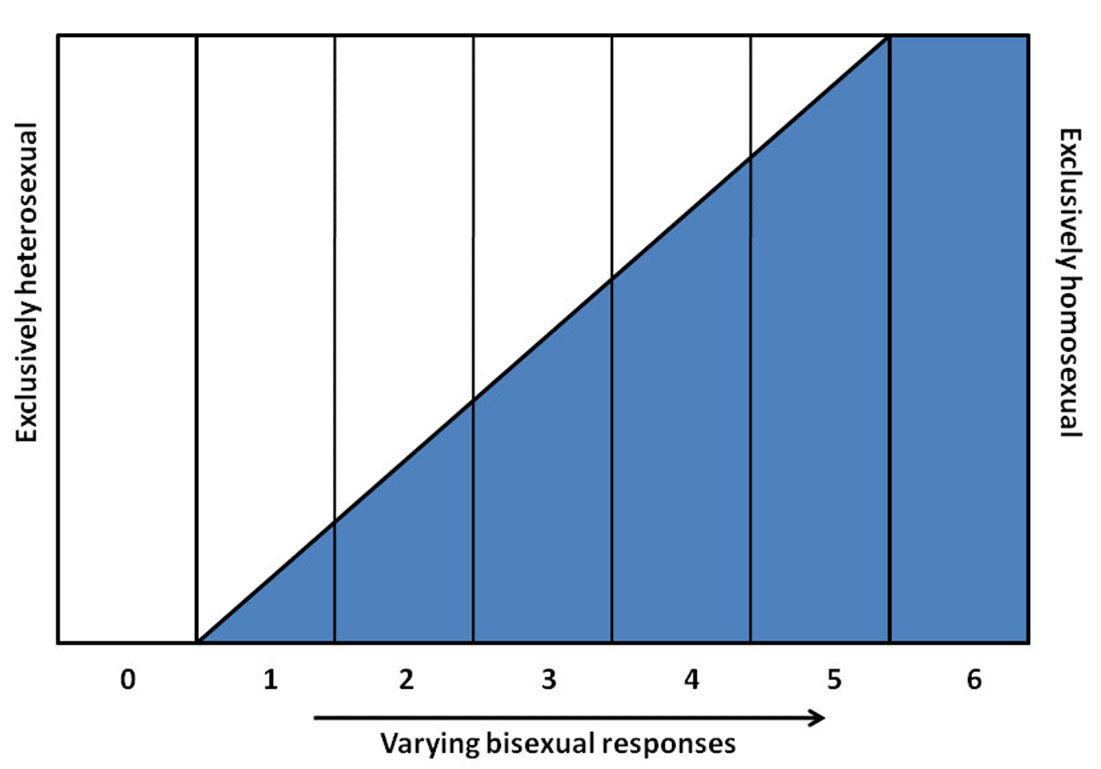
Figure 12.3 The Kinsey scale was one of the first attempts to frame the diversity of human sexual orientation.
Tonja R. Conerly, Kathleen Holmes, and Asha Lal Tamang, Introduction Sociology 3E, OpenStax. · CC BY-NC-SA 4.0 · Original image ↗ · Access for free ↗
Figure 12.4 Childhood activities and instruction, like this father-daughter duck-hunting trip, can influence people's lifelong views on gender roles. (Credit: Tim Miller, USFWS Midwest Region/flickr)
Tonja R. Conerly, Kathleen Holmes, and Asha Lal Tamang, Introduction Sociology 3E, OpenStax. · CC BY-NC-SA 4.0 · Original image ↗ · Access for free ↗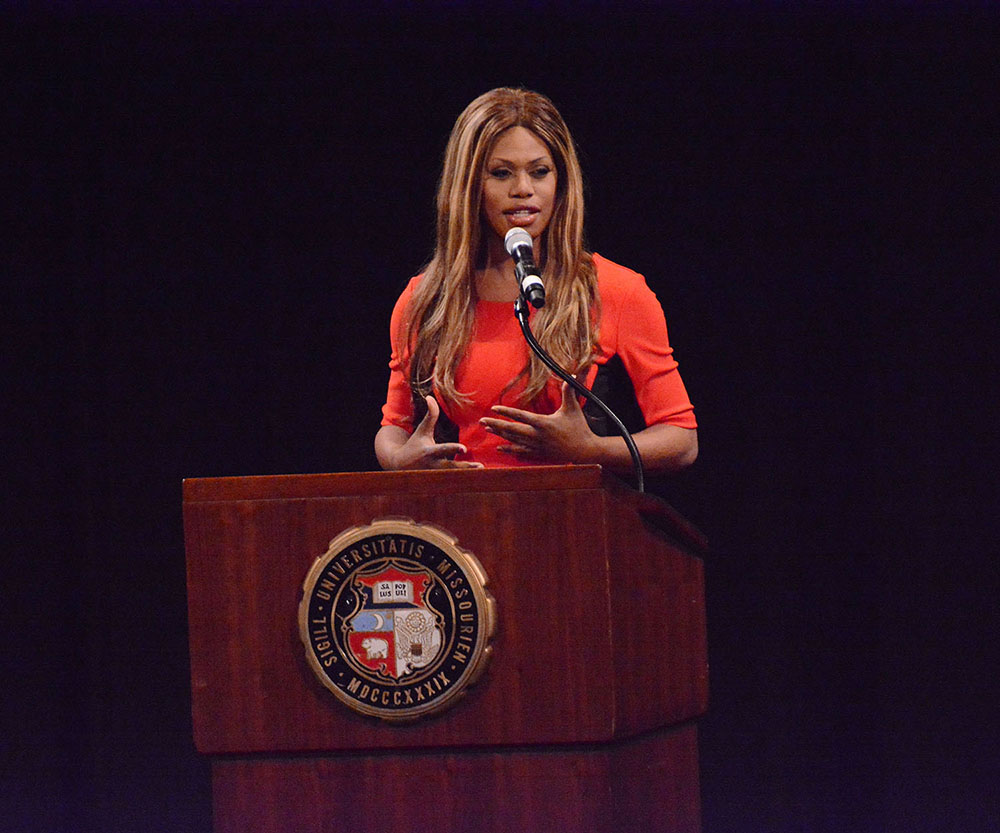
Figure 12.5 Actress Laverne Cox is the first openly transgender person to play a transgender character on a major show. She won a producing Emmy and was nominated four times for the Best Actress Emmy. She is also an advocate for LGBTQ issues outside of her career, such as in this "Ain't I a Woman?" speaking tour. (Credit: modification of work by "KOMUnews_Flickr"/Flickr)
Tonja R. Conerly, Kathleen Holmes, and Asha Lal Tamang, Introduction Sociology 3E, OpenStax. · CC BY-NC-SA 4.0 · Original image ↗ · Access for free ↗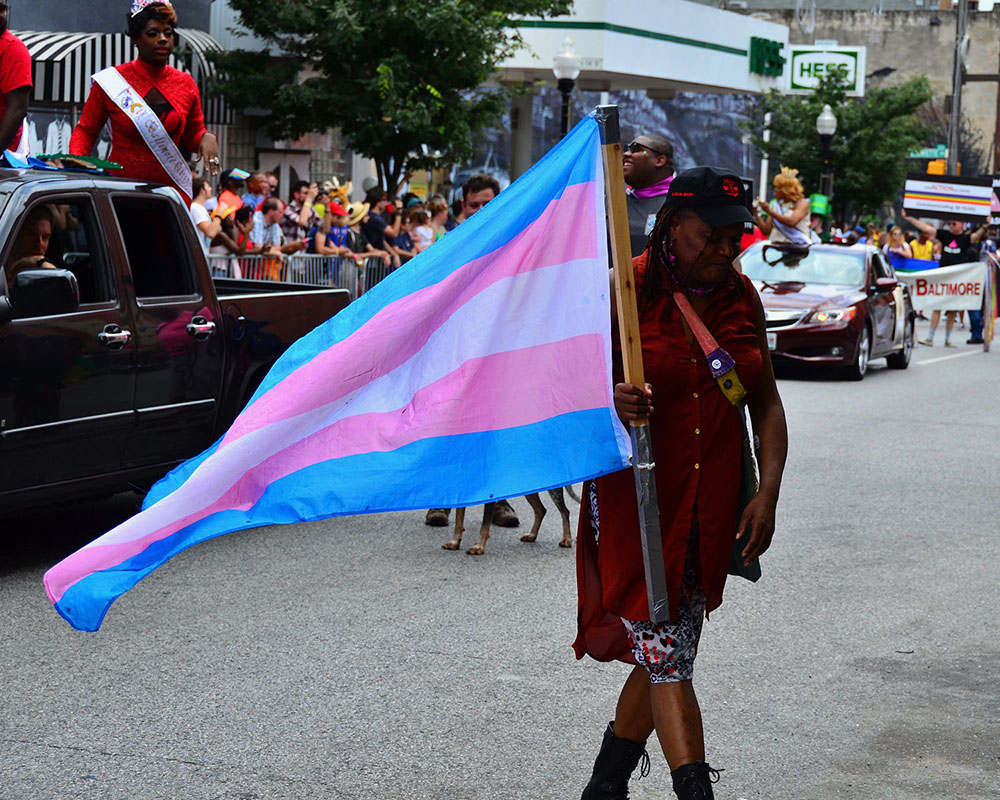
Figure 12.6 The most widely known transgender pride flag was designed by transgender woman and U.S. Navy veteran Monica Helms. Other designers have different interpretation of the transgender flag, and other groups within the LGBTQ community have their own flags and symbols. Interestingly, Gilbert Baker, the designer of the first widely adopted pride flag, made a point to avoid trademark or other limits on the flag, so that it could be reinterpreted and reused by others. (Credit: crudmucosa/flickr)
Tonja R. Conerly, Kathleen Holmes, and Asha Lal Tamang, Introduction Sociology 3E, OpenStax. · CC BY-NC-SA 4.0 · Original image ↗ · Access for free ↗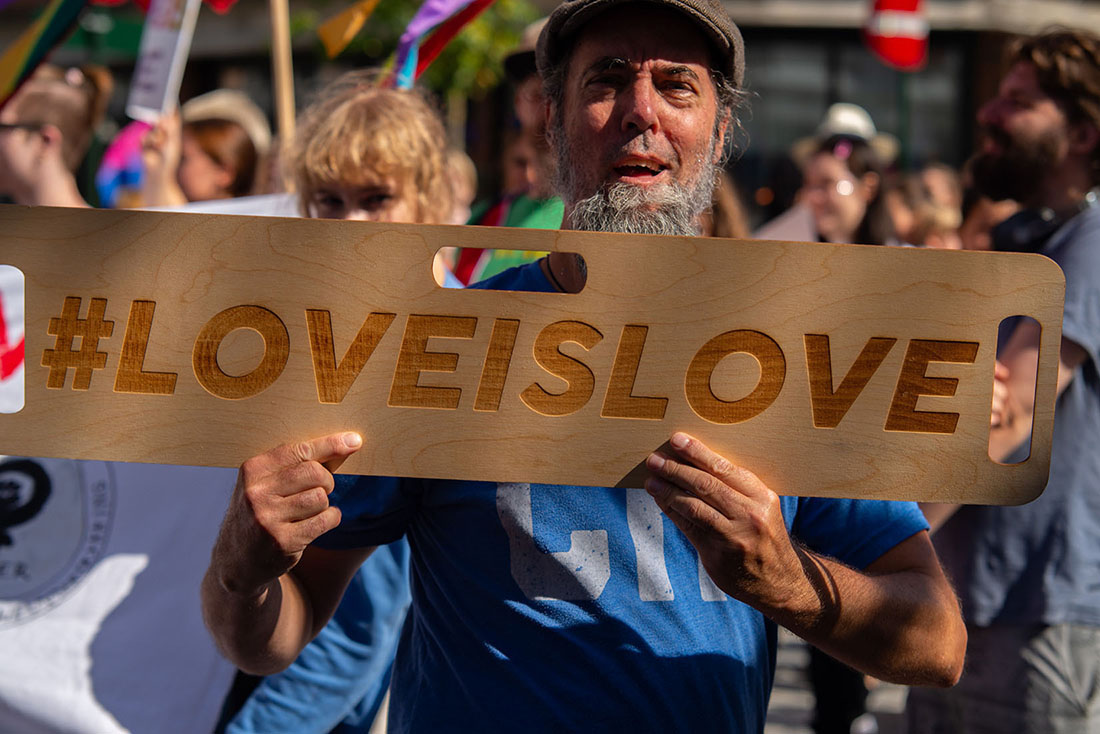
Figure 12.7 Hashtags, pride parades, and other activism are important elements of supporting LGBTQ people, but most experts and advocates agree that some of the most important steps are ones taken internally to better educate ourselves, and on interpersonal levels with friends, coworkers, and family members. (Credit: Lars Verket/flickr)
Tonja R. Conerly, Kathleen Holmes, and Asha Lal Tamang, Introduction Sociology 3E, OpenStax. · CC BY-NC-SA 4.0 · Original image ↗ · Access for free ↗12.2 Gender and Gender Inequality — figures and tables
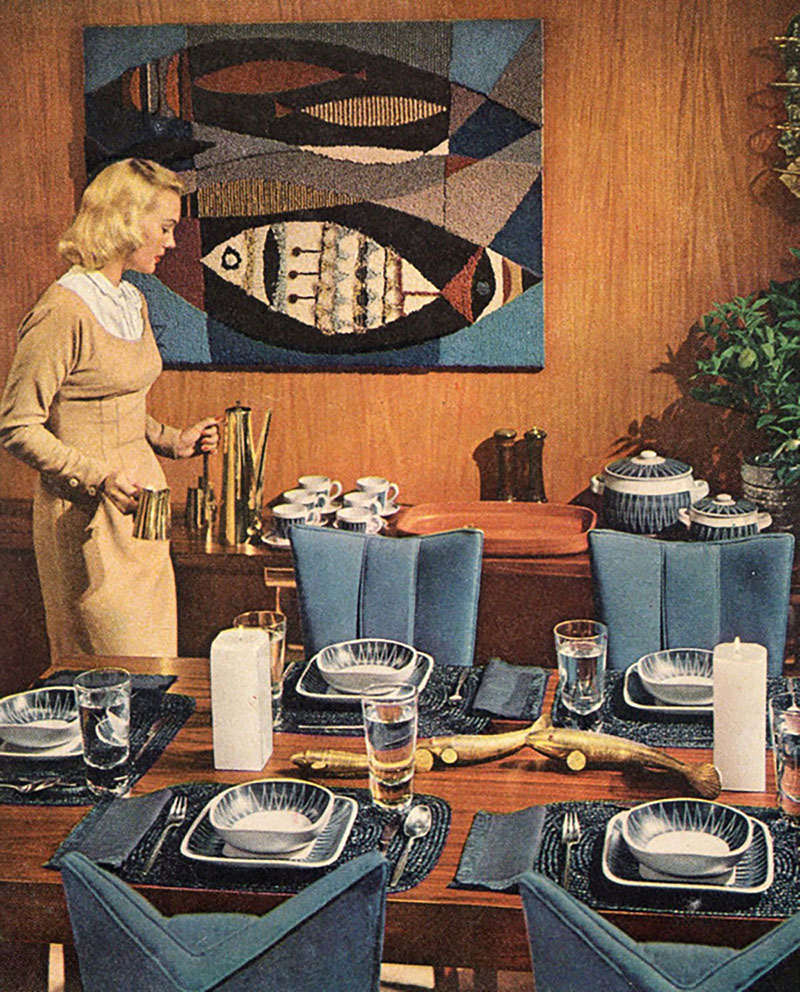
Figure 12.8 Traditional images of U.S. gender roles reinforce the idea that women should be subordinate to men. (Credit: Sport Suburban/flickr)
Tonja R. Conerly, Kathleen Holmes, and Asha Lal Tamang, Introduction Sociology 3E, OpenStax. · CC BY-NC-SA 4.0 · Original image ↗ · Access for free ↗
Figure 12.9 Although our society may have a stereotype that associates motorcycles with men, women make up a sizable portion of the biker community. (Credit: Robert Couse-Baker/flickr)
Tonja R. Conerly, Kathleen Holmes, and Asha Lal Tamang, Introduction Sociology 3E, OpenStax. · CC BY-NC-SA 4.0 · Original image ↗ · Access for free ↗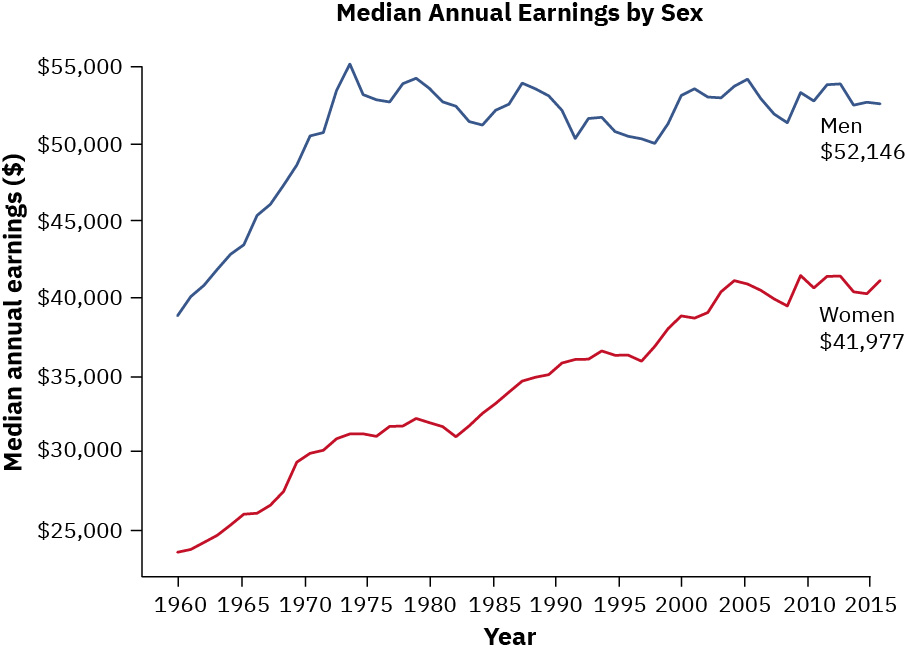
Figure 12.10 In 2017 men’s overall median earnings were $52,146 and women’s were $41,977. This means that women earned 80.1% of what men earned in the United States. (Credit: Women’s Bureau, U.S. Department of Labor)
Tonja R. Conerly, Kathleen Holmes, and Asha Lal Tamang, Introduction Sociology 3E, OpenStax. · CC BY-NC-SA 4.0 · Original image ↗ · Access for free ↗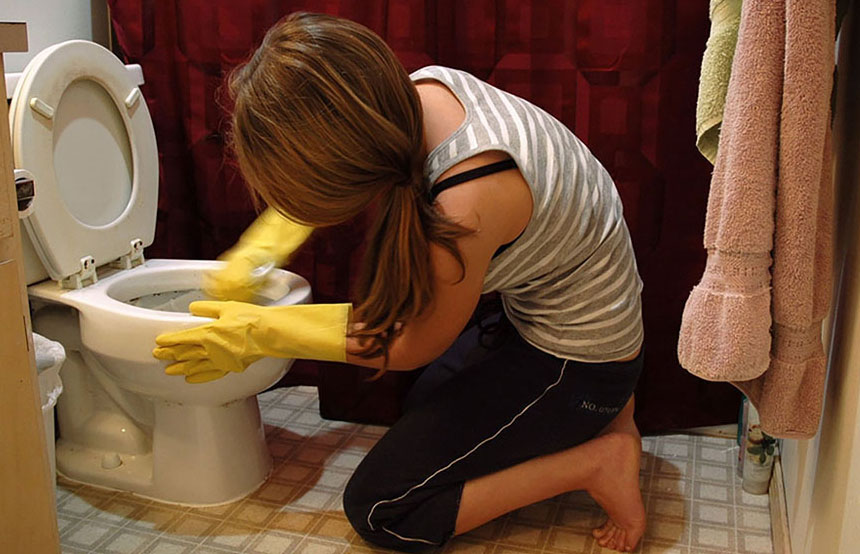
Figure 12.11 In some cultures, women do all of the household chores with no help from men, as doing housework is a sign of weakness, considered by society as a feminine trait. (Credit: Evil Erin/flickr)
Tonja R. Conerly, Kathleen Holmes, and Asha Lal Tamang, Introduction Sociology 3E, OpenStax. · CC BY-NC-SA 4.0 · Original image ↗ · Access for free ↗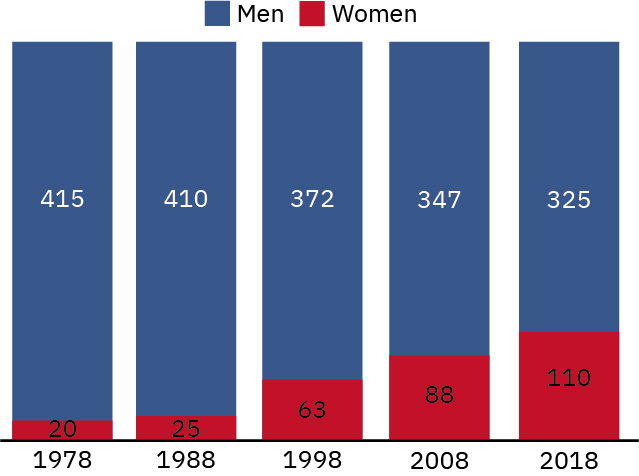
Figure 12.12 Breakdown of Congressional Membership by Gender. 2021 saw a record number of women in Congress, with 120 women serving in the House and 24 serving in the Senate. Gender representation has been steadily increasing over time, but is not close to being equal. (Credit: Based on data from Center for American Women in Politics, Rutgers University)
Tonja R. Conerly, Kathleen Holmes, and Asha Lal Tamang, Introduction Sociology 3E, OpenStax. · CC BY-NC-SA 4.0 · Original image ↗ · Access for free ↗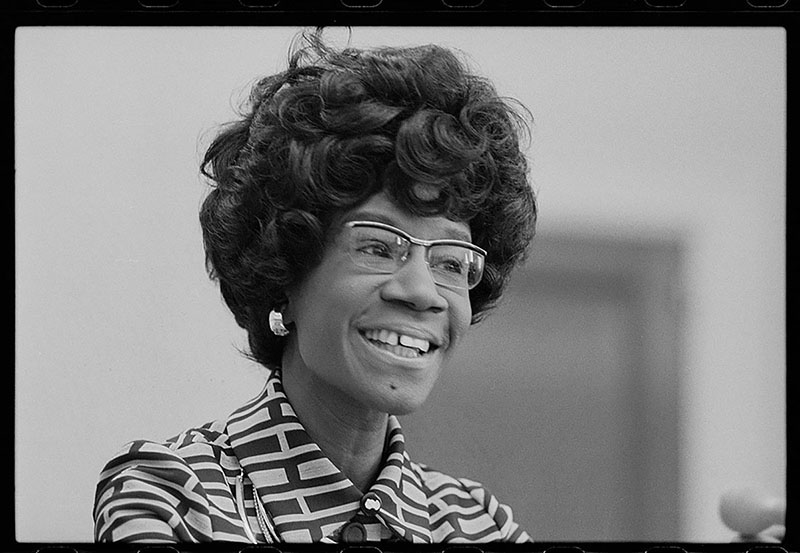
Figure 12.13 “Unbought and Unbossed”: Shirley Chisholm was the first Black United States Congresswoman, the co-founder of the Congressional Black Caucus, and a candidate for a major-party Presidential nomination.
Tonja R. Conerly, Kathleen Holmes, and Asha Lal Tamang, Introduction Sociology 3E, OpenStax. · CC BY-NC-SA 4.0 · Original image ↗ · Access for free ↗11.1 Racial, Ethnic, and Minority Groups — figures and tables
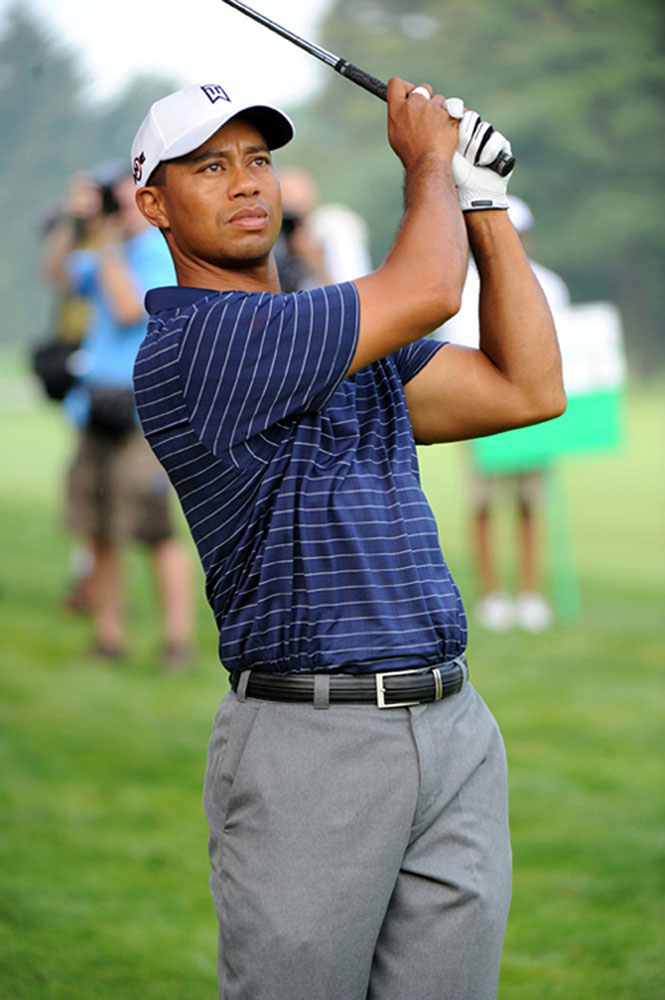
Figure 11.2 Golfer Tiger Woods has Chinese, Thai, African American, Native American, and Dutch heritage. Individuals with multiple ethnic backgrounds are becoming more common. (Credit: familymwr/flickr)
Tonja R. Conerly, Kathleen Holmes, and Asha Lal Tamang, Introduction Sociology 3E, OpenStax. · CC BY-NC-SA 4.0 · Original image ↗ · Access for free ↗11.4 Intergroup Relationships — figures and tables
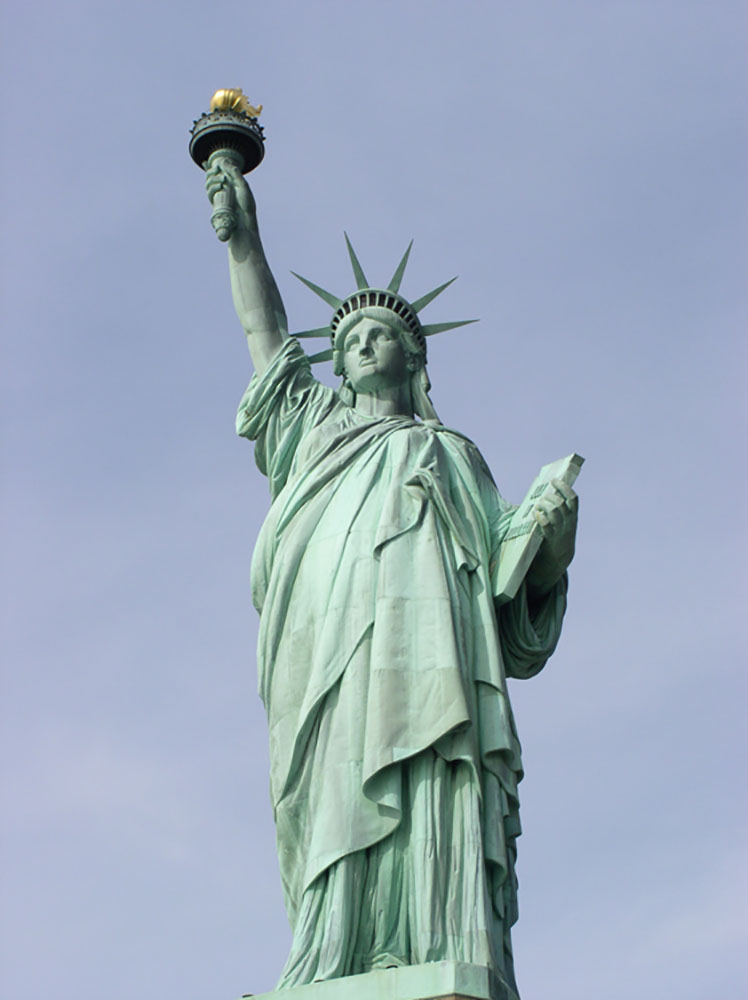
Figure 11.6 For many immigrants to the United States, the Statue of Liberty is a symbol of freedom and a new life. Unfortunately, they often encounter prejudice and discrimination. (Credit: Mark Heard/flickr)
Tonja R. Conerly, Kathleen Holmes, and Asha Lal Tamang, Introduction Sociology 3E, OpenStax. · CC BY-NC-SA 4.0 · Original image ↗ · Access for free ↗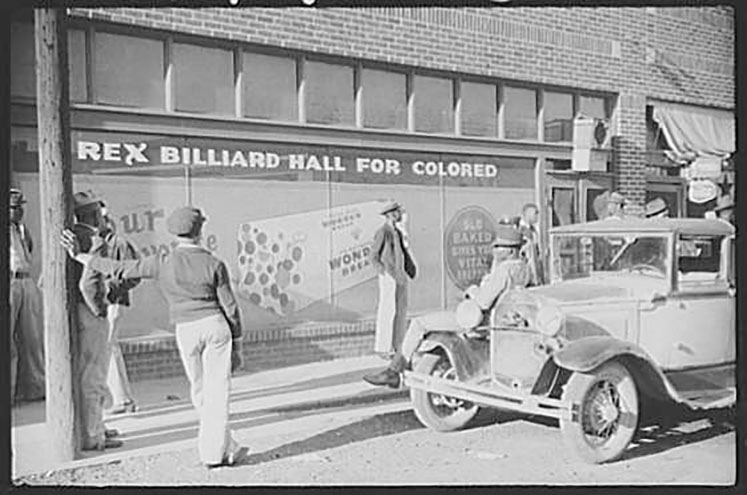
Figure 11.7 In the “Jim Crow” South, it was legal to have “separate but equal” facilities for Black people and White people. (Credit: Library of Congress/Wikimedia Commons)
Tonja R. Conerly, Kathleen Holmes, and Asha Lal Tamang, Introduction Sociology 3E, OpenStax. · CC BY-NC-SA 4.0 · Original image ↗ · Access for free ↗Source: 11.4 Intergroup Relationships
11.5 Race and Ethnicity in the United States — figures and tables
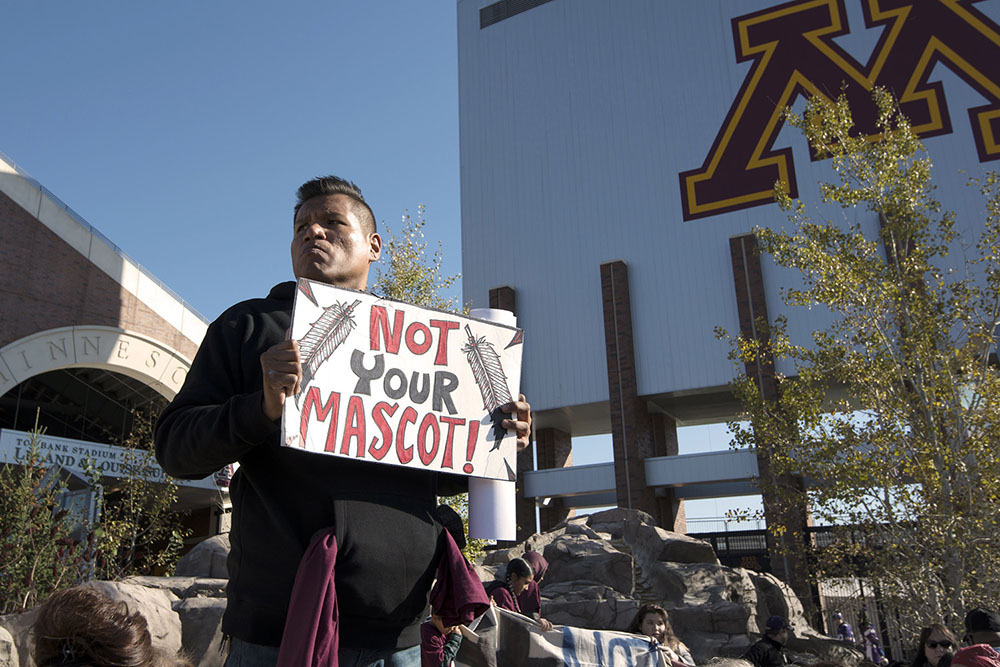
Figure 11.8 Many Native Americans (and others) believe sports teams with names like the Indians, Braves, and Warriors perpetuate unwelcome stereotypes. The Not Your Mascot protest was one of many directed at the then Washington Redskins, which eventually changed its name. (Credit: Fibonacci Blue/fickr)
Tonja R. Conerly, Kathleen Holmes, and Asha Lal Tamang, Introduction Sociology 3E, OpenStax. · CC BY-NC-SA 4.0 · Original image ↗ · Access for free ↗
Figure 11.9 This gathering at the site of George Floyd's death took place five days after he was killed. The location, at Chicago Avenue and 38th Street in Minneapolis, became a memorial. (Credit: Fibbonacci Blue/flickr)
Tonja R. Conerly, Kathleen Holmes, and Asha Lal Tamang, Introduction Sociology 3E, OpenStax. · CC BY-NC-SA 4.0 · Original image ↗ · Access for free ↗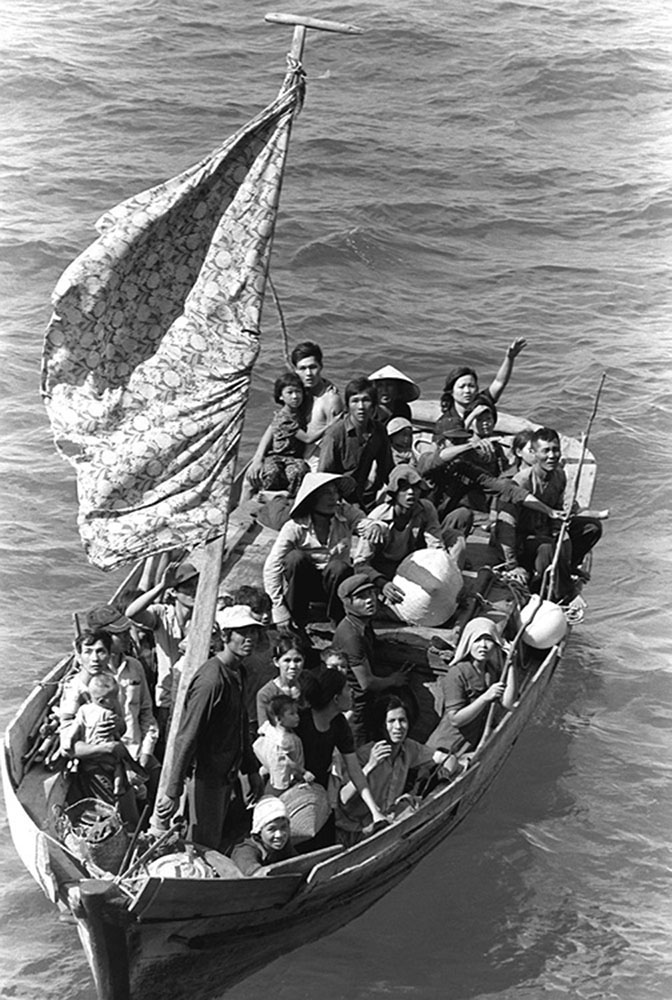
Figure 11.10 Thirty-five Vietnamese refugees wait to be taken aboard the amphibious USS Blue Ridge (LCC-19) . They are being rescued from a thirty-five-foot fishing boat 350 miles northeast of Cam Ranh Bay, Vietnam, after spending eight days at sea. (Credit: U.S. Navy/Wikimedia Commons)
Tonja R. Conerly, Kathleen Holmes, and Asha Lal Tamang, Introduction Sociology 3E, OpenStax. · CC BY-NC-SA 4.0 · Original image ↗ · Access for free ↗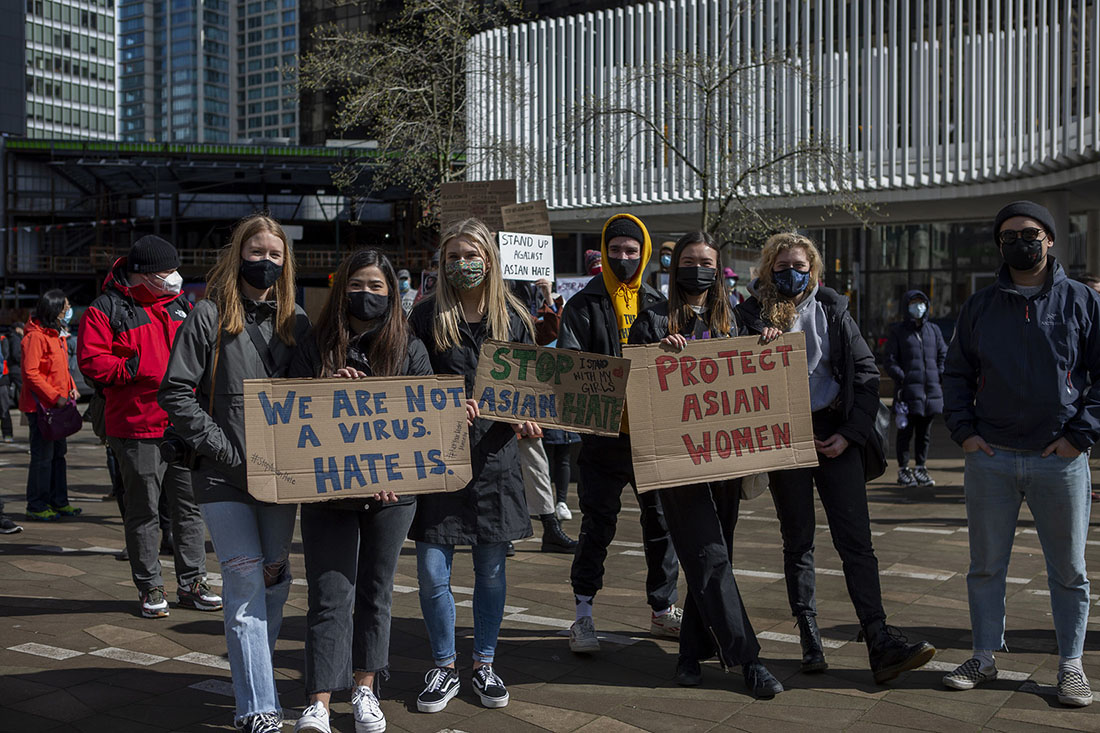
Figure 11.11 In response to widespread attacks against Asian people, partly linked to incorrect associations regarding Asian people and the COVID-19 pandemic, groups around the country and world held Stop Asian Hate rallies like this one in Canada. (Credit: GoToVan/flickr)
Tonja R. Conerly, Kathleen Holmes, and Asha Lal Tamang, Introduction Sociology 3E, OpenStax. · CC BY-NC-SA 4.0 · Original image ↗ · Access for free ↗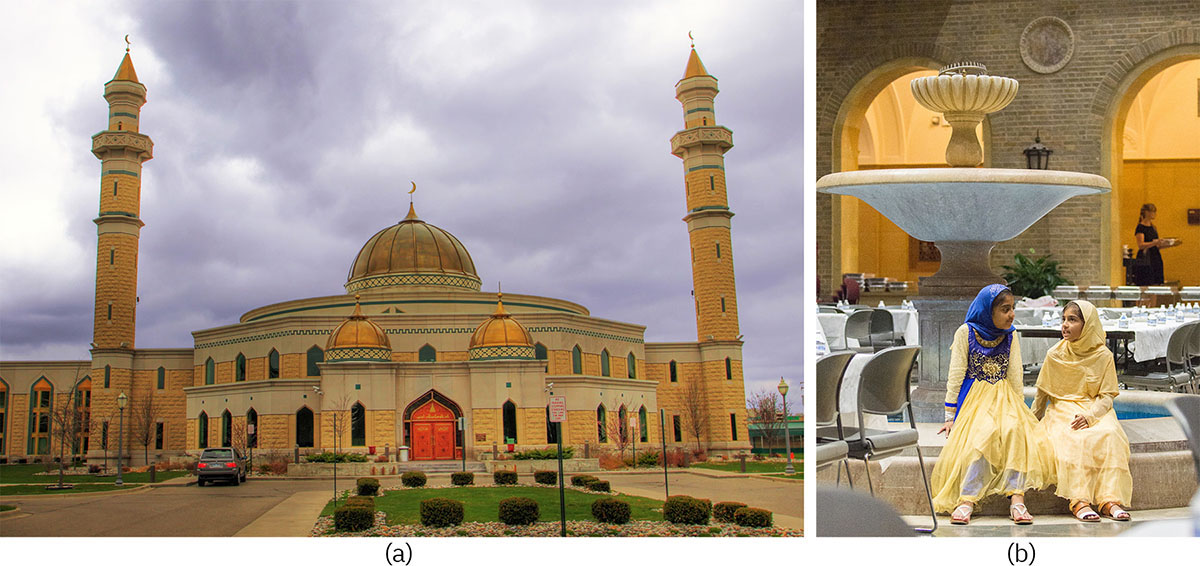
Figure 11.12 The Islamic Center of America in Dearborn, Michigan is the largest mosque, or Islamic religious place of worship, in the United States. Muslim women and girls often wear head coverings, which sometimes makes them a target of harassment. (Credit A: Ryan Ready/flickr; B: U.S. Department of Agriculture/flickr)
Tonja R. Conerly, Kathleen Holmes, and Asha Lal Tamang, Introduction Sociology 3E, OpenStax. · CC BY-NC-SA 4.0 · Original image ↗ · Access for free ↗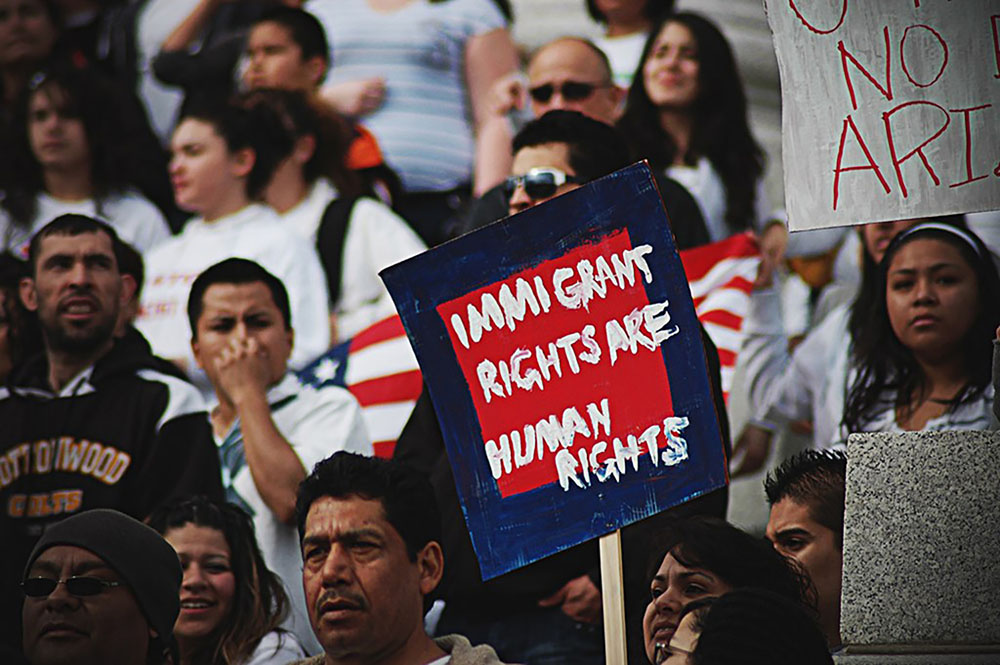
Figure 11.13 Protesters in Arizona dispute the harsh new anti-immigration law. (Credit: rprathap/flickr)
Tonja R. Conerly, Kathleen Holmes, and Asha Lal Tamang, Introduction Sociology 3E, OpenStax. · CC BY-NC-SA 4.0 · Original image ↗ · Access for free ↗| Population estimates, July 1, 2019, (V2019) | 328,239,523 |
| Race and Hispanic Origin | Percentage (%) |
| White alone | 76.3 |
| Black or African American alone | 13.4 |
| American Indian and Alaska Native alone | 1.3 |
| Asian alone | 5.9 |
| Native Hawaiian and Other Pacific Islander alone | 0.2 |
| Two or More Races | 2.8 |
| Hispanic or Latino | 18.5 |
| White alone, not Hispanic or Latino | 60.1 |
Table 11.1 Percentage of Race and Hispanic Origin Population 2019 (Table courtesy of U.S. Census Bureau). Tonja R. Conerly, Kathleen Holmes, and Asha Lal Tamang, Introduction Sociology 3E, OpenStax.