Foundation 4 · 4E · Atoms, periodicity, and chemical amounts

Periodic classification and trends

Sources ↗

Periodic trends follow valence structure and , with predictable exceptions from subshell occupancy.

Families share valence patterns

Alkali metals usually form +1 ; -earth metals commonly form +2. Oxygen-group often form −2 , halogens −1, and noble gases have filled valence shells and low ordinary reactivity. Main-group or representative occupy s and p blocks. Transition involve d subshells and commonly show multiple states, colored complexes, and activity. Metals tend to conduct and lose ; nonmetals commonly gain or share . Metalloids show intermediate behavior. Chemical behavior depends on state and environment, not family labels alone.

Source: 6.5 Periodic Variations in Element Properties · 2.5 The Periodic Table

Apply it

Try before revealing the answer. Rank O²⁻, F⁻, Na⁺, and Mg²⁺ by increasing radius. Why is sodium’s second much larger than its first?

Worked answer

All four have ten . Increasing contracts the same count, so Mg²⁺ < Na⁺ < F⁻ < O²⁻. Sodium first loses its outer 3s ; the second removal would take an from a filled inner shell, requiring much more energy.

Source: 6.5 Periodic Variations in Element Properties · 2.5 The Periodic Table

6.5 Periodic Variations in Element Properties — figures and tables
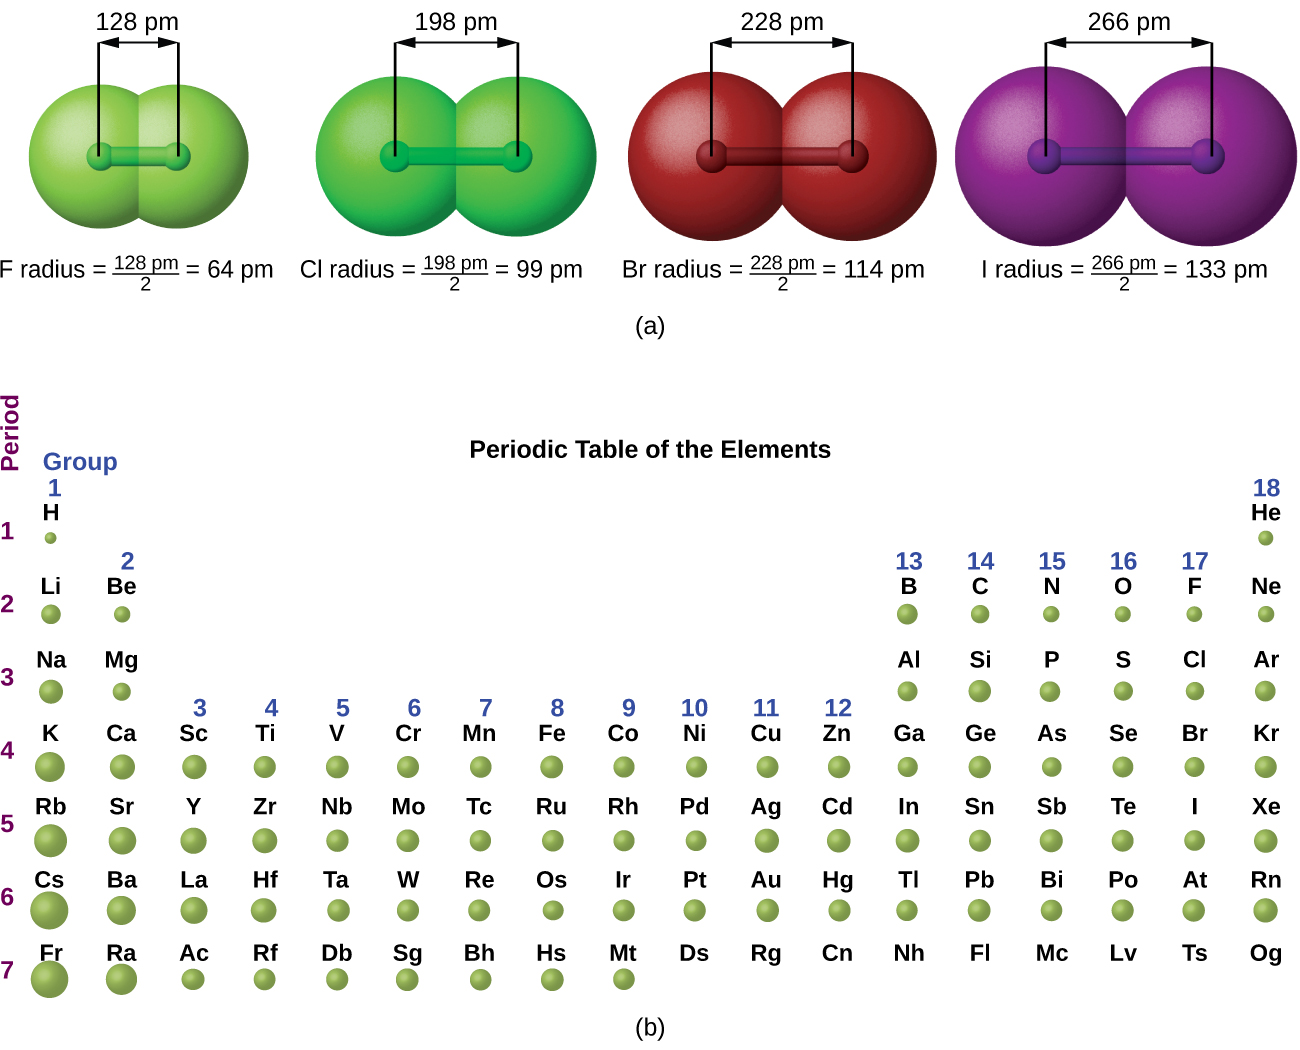
This figure has two parts: a and b. In figure a, four diatomic molecules are shown to illustrate the method of determining the atomic radius of an atom. The first model, in light green, is used to find the F atom radius. Two spheres are pushed very tightly together. The distance between the centers of the two atoms is indicated above the diagram with a double-headed arrow labeled “128 picometers (pm).” The end points of this arrow connect to line segments that extend to the atomic radii below. Beneath the molecule is the label, “F radius equals 128 pm divided by 2 equals 64 pm.” The next three models are similarly used to show the atomic radii of additional atoms. The second diatomic molecule is in a darker shade of green. The distance between the radii is 198 pm. Beneath the molecule is the label, “Cl radius equals 198 pm divided by 2 equals 99 pm.” The third diatomic molecule is in red. The distance between the radii is 228 pm. Beneath the molecule is the label, “Br radius equals 228 pm divided by 2 equals 114 pm.” The fourth diatomic molecule is in purple. The distance between the radii is 266 pm. Beneath the molecule is the label, “I radius equals 266 pm divided by 2 equals 133 pm.” In figure b, a periodic table layout is used to compare relative sizes of atoms, using green spheres. No spheres are provided for the noble or inert gas—group 18 elements. General trends noted are increasing circle size moving from top to bottom in a group, with a general tendency toward increasing atomic radii toward the lower left corner of the periodic table.
Figure 6.30 — 6.5 Periodic Variations in Element Properties

Figure 6.30 (a) The radius of an atom is defined as one-half the distance between the nuclei in a molecule consisting of two identical atoms joined by a covalent bond. The atomic radius for the halogens increases down the group as n increases. (b) Covalent radii of the elements are shown to scale. The general trend is that radii increase down a group and decrease across a period.

Paul Flowers, Klaus Theopold, Richard Langley, and William R. Robinson, Chemistry 2E, OpenStax. · CC BY-NC-SA 4.0 · Original image ↗ · Access for free ↗
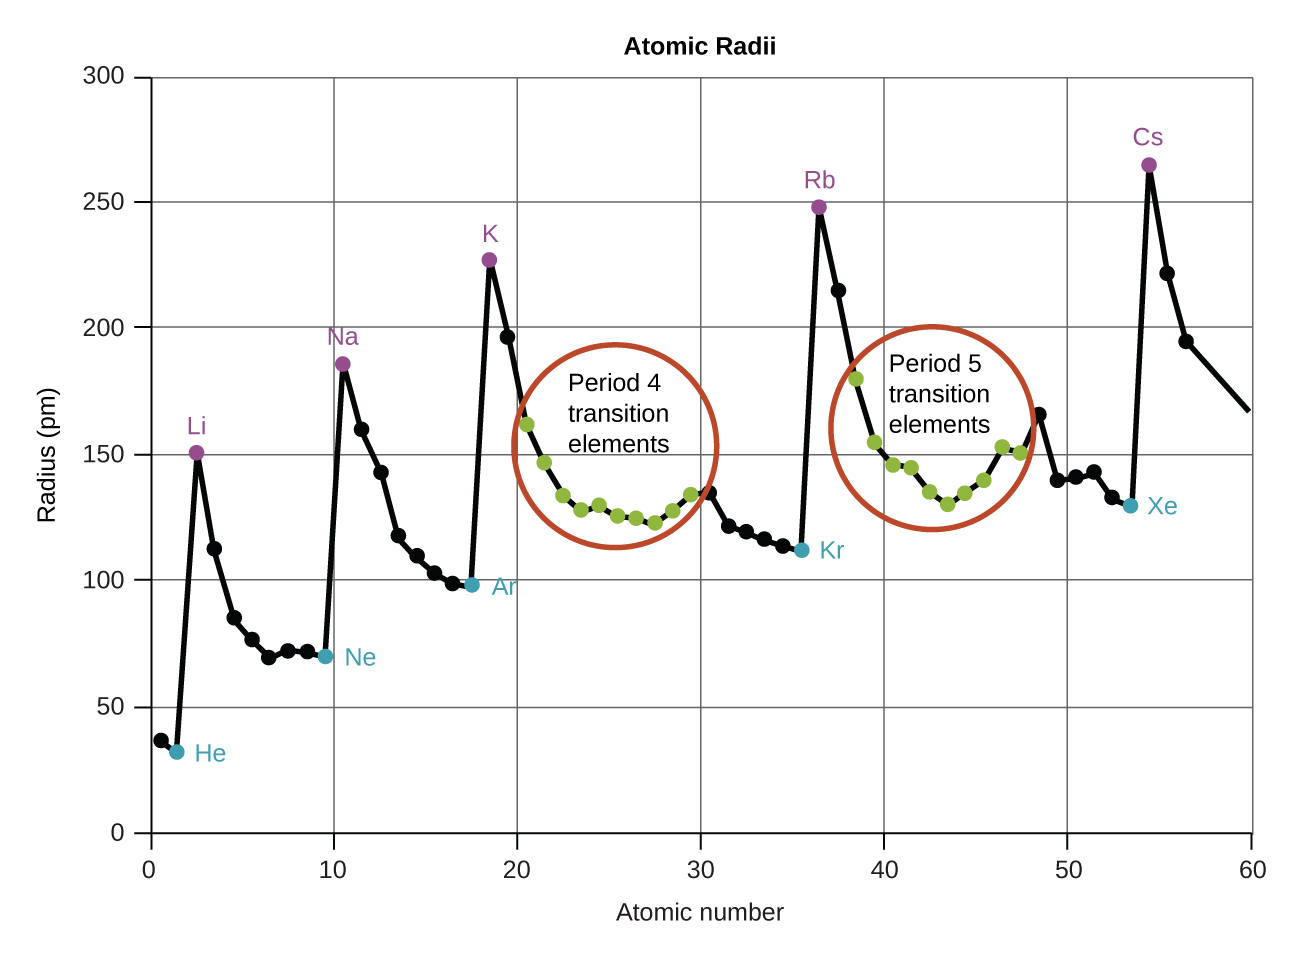
This graph entitled, “Atomic Radii,” is labeled, “Atomic Number,” on the horizontal axis and, “Radius (p m),” on the vertical axis. Markings are provided every 10 units up to 60 on the horizontal axis beginning at zero. Vertical lines extend from the horizontal axis upward at each of these markings. The vertical axis begins at 0 and increases by 50’s up to 300. Horizontal lines are drawn across the graph at multiples of 50. A black jagged line connects the radii values for elements with atomic numbers 1 through 60 on the graph. Peaks are evident at the locations of the alkali metals: L i, N a, K, R b, and C s, at which points on the graph purple dots are placed and elements are labeled in purple. Similarly, minima exist at the locations of noble or inert gases: H e, N e, A r, K r, X e, and R n, at which points blue dots are placed and element symbols are provided in blue. The locations of period 4 and period 5 transition elements are provided with green dots. These points are clustered together in two locations on the graph which are circled in red and labeled accordingly. The green dots for the transition elements along with the line that connects them form a U shape on the graph within each of the red circles drawn. The atomic radii for the alkali metals in picometers are: L i 167, N a 190, K 243, R b 265, and C s 298. The atomic radii of the noble or inert gases included in the graph in picometers are: H e 31, N e 38, A r 71, K r 88, and X e 108.
Figure 6.31 — 6.5 Periodic Variations in Element Properties

Figure 6.31 Within each period, the trend in atomic radius decreases as Z increases; for example, from K to Kr. Within each group (e.g., the alkali metals shown in purple), the trend is that atomic radius increases as Z increases.

Paul Flowers, Klaus Theopold, Richard Langley, and William R. Robinson, Chemistry 2E, OpenStax. · CC BY-NC-SA 4.0 · Original image ↗ · Access for free ↗

The figure includes spheres in green to represent the relative sizes of A l and S atoms. The relatively large A l sphere in the upper left is labeled 118. The significantly smaller S sphere in the upper right is labeled 104. Beneath each of these spheres is a red sphere. The red sphere in the lower left is very small in comparison to the other spheres and is labeled, “A l superscript 3 plus 68.” The red sphere in the lower right is significantly larger than the other spheres and is labeled, “S superscript 2 negative 170. “
Figure 6.32 — 6.5 Periodic Variations in Element Properties

Figure 6.32 The radius for a cation is smaller than the parent atom (Al), due to the lost electrons; the radius for an anion is larger than the parent (S), due to the gained electrons.

Paul Flowers, Klaus Theopold, Richard Langley, and William R. Robinson, Chemistry 2E, OpenStax. · CC BY-NC-SA 4.0 · Original image ↗ · Access for free ↗
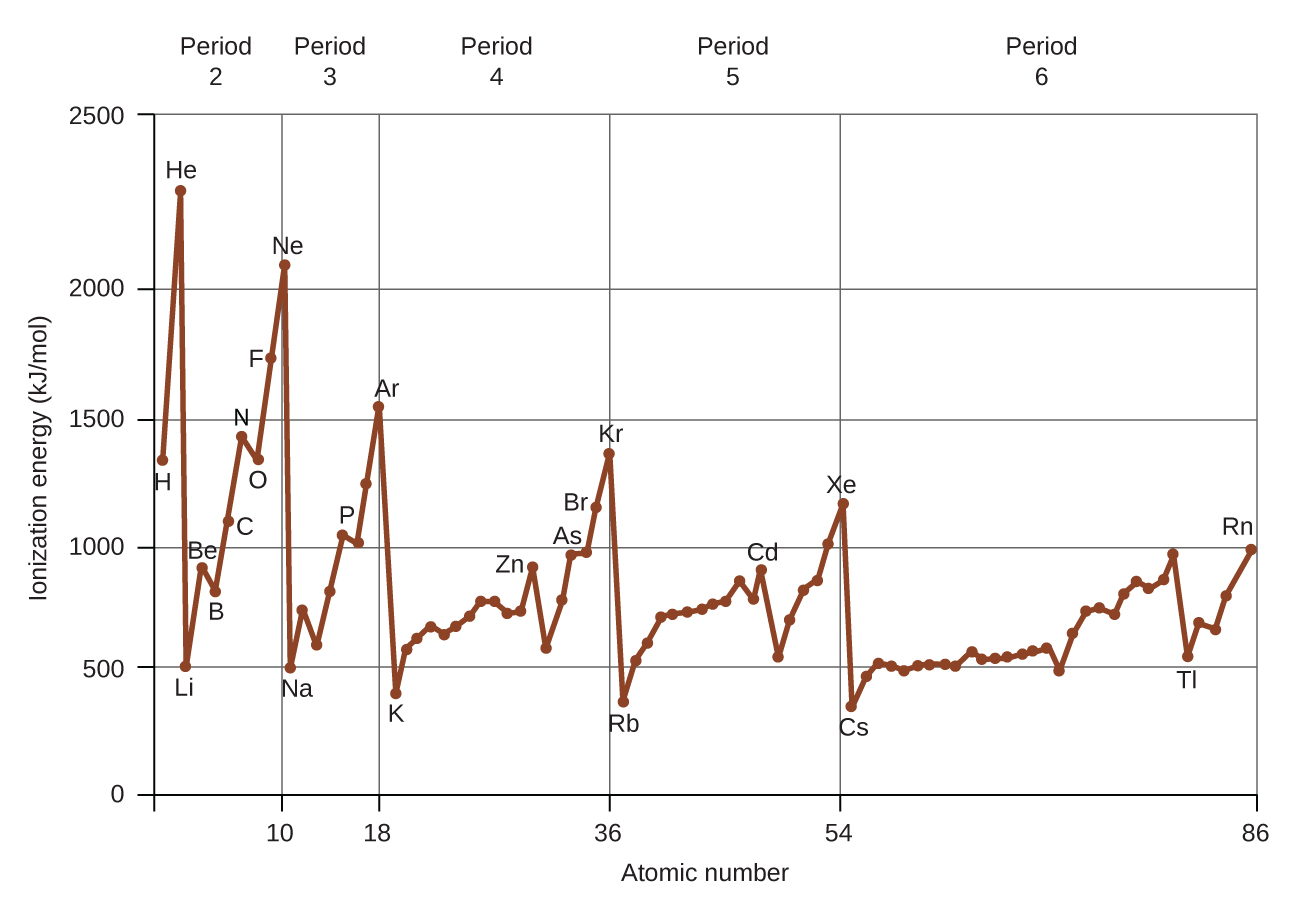
This figure includes a graph labeled, “Atomic Number,” on the horizontal axis and, “Ionization Energy (k J divided by mol),” on the vertical axis. Markings are provided on the horizontal axis at 10, 18, 36, 54, and 86. Vertical lines extend from the horizontal axis upward at each of these values. The vertical axis begins at 0 and increases by 500’s up to 2500. Horizontal lines are drawn across the graph at multiples of 500. A red jagged line connects the ionization energies for elements with atomic numbers 1 through 86 on the graph. Peaks are evident at the locations of the noble or inert gases: H e, N e, A r, K r, X e, and R n. Similarly, minima exist at the locations of the alkali metals: L i, N a, K, R b, and C s. Elements labeled on the graph and their associated ionization energies are as follows: H 1310, H e 2370, L i 520, B e 900, B 800, C 1090, N 1400, O 1310, F 1680, N e 2080, N a 490, M g 730, P 1060, A r 1520, K 420, Z n 910, A s 960, B r 1140, K r 1350, R b 400, C d 870, X e 1170, T l 590, and R n 1030.
Figure 6.33 — 6.5 Periodic Variations in Element Properties

Figure 6.33 The first ionization energy of the elements in the first six periods are plotted against their atomic number.

Paul Flowers, Klaus Theopold, Richard Langley, and William R. Robinson, Chemistry 2E, OpenStax. · CC BY-NC-SA 4.0 · Original image ↗ · Access for free ↗
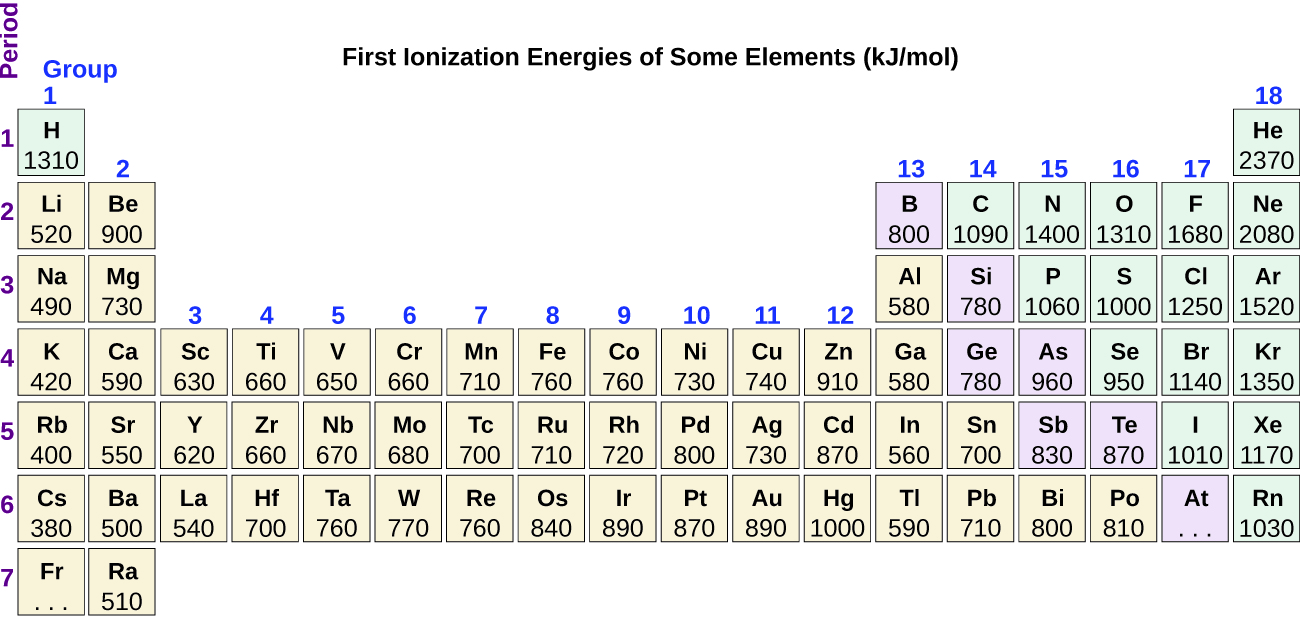
The figure includes a periodic table with the title, “First Ionization Energies of Some Elements (k J per mol).” The table identifies the row or period number at the left in purple, and group or column numbers in blue above each column. First ionization energies listed top to bottom for group 1 are: H 1310, L i 520, N a 490, K 420, R b 400, C s 380, and three dots are placed in the box for F r. In group 2 the values are: B e 900, M g 730, C a 590, S r 550, and B a 500. In group 3 the values are: S c 630, Y 620, and L a 540. In group 4, the values are: T i 660, Z r 660, H f 700. In group 5, the values are: V 650, N b 670, and T a 760. In group 6, the values are: C r 660, M o 680, and W 770. In group 7, the values are: M n 710, T c 700, and R e 760. In group 8, the values are: F e 760, R u 720, and O s 840. In group 9, the values are: C o 760, R h 720, and I r 890. In group 10, the values are: N i 730, P d 800, and P t 870. In group 11, the values are: C u 740, A g 730, and A u 890. In group 12, the values are: Z n 910, C d 870, and H g 1000. In group 13, the values are: B 800, A l 580, G a 580, I n 560, and T l 590. In group 14, the values are: C 1090, S i 780, G e 780, S n 700, and P b 710. In group 15, the values are: N 1400, P 1060, A s 960, S b 830, and B i 800. In group 16, the values are: O 1310, S 1000, S e 950, T e 870, and P o 810. In group 17, the values are: F 1680, C l 1250, B r 1140, I 1010, and A t has three dots. In group 18, the values listed are: B e 2370, N e 2080, A r 1520, K r 1350, X e 1170, and R n 1030.
Figure 6.34 — 6.5 Periodic Variations in Element Properties

Figure 6.34 This version of the periodic table shows the first ionization energy (IE 1 ), in kJ/mol, of selected elements.

Paul Flowers, Klaus Theopold, Richard Langley, and William R. Robinson, Chemistry 2E, OpenStax. · CC BY-NC-SA 4.0 · Original image ↗ · Access for free ↗

This figure includes the element symbol O followed by the electron configuration 1 s superscript 2 2 s superscript 2 2 p superscript 4. An orbital diagram follows, which consists of two individual squares, labeled as, “1 s,” and, “2 s,” below followed by a grouping of three connected squares which are labeled, “2 p.” All boxes are oriented in a row. The two individual squares and the first square in the row of connected squares contain a pair of half arrows. One half arrow in each pair points up, and one points down. The downward pointing arrow in the first square in the row of connected squares is red. The remaining two squares each contain single upward pointing half arrows.
6.5 Periodic Variations in Element Properties — illustration 6 Paul Flowers, Klaus Theopold, Richard Langley, and William R. Robinson, Chemistry 2E, OpenStax. · CC BY-NC-SA 4.0 · Original image ↗ · Access for free ↗
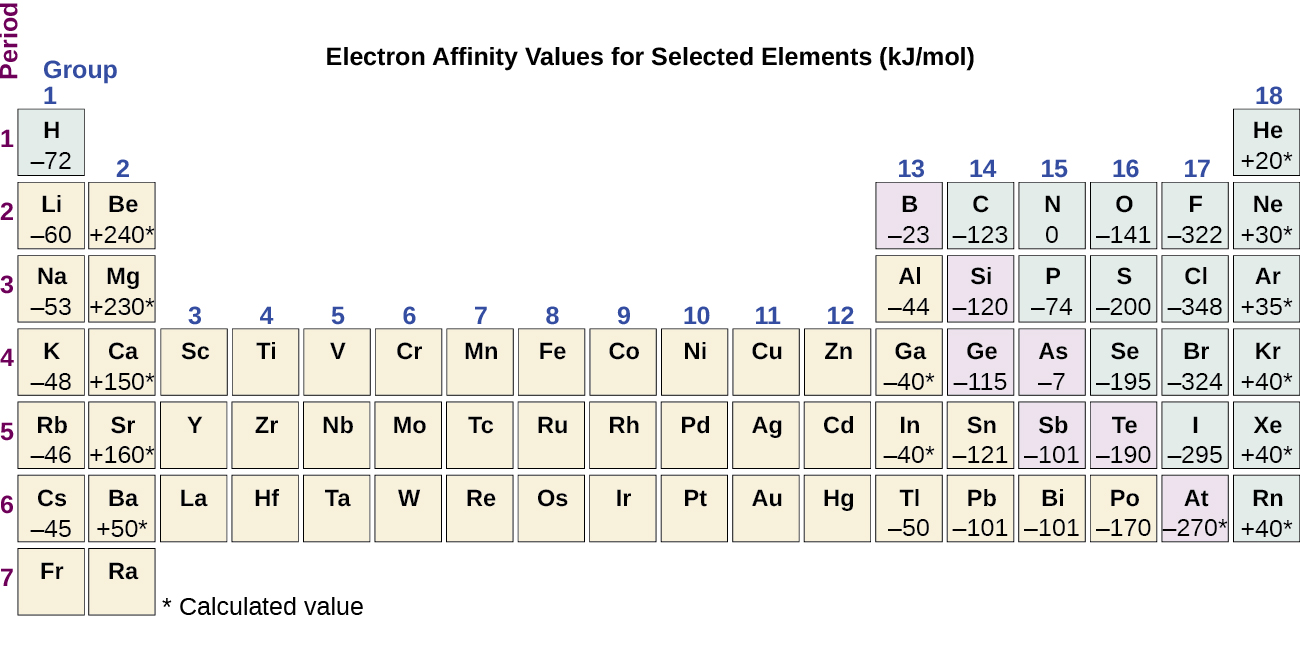
The figure includes a periodic table with the title, “Electron Affinity Values for Selected Elements (k J per mol).” The table identifies the row or period number at the left in purple, and group or column numbers in blue above each column. Electron affinity values for representative elements are indicated with values marked with asterisks identifying calculated values. The electron affinity values for group 1 (column 1) elements are provided with the element symbols in the table as follows: H negative 72, L i negative 60, N a negative 53, K negative 48, R b negative 46, and C s negative 45. In group 2, the values are: B e positive 240 asterisk, M g positive 230 asterisk, C a positive 150 asterisk, S r positive 160 asterisk, and B a positive 50 asterisk. In group 13, the values are: B negative 23, A l negative 44, G a negative 40 asterisk, I n negative 40 asterisk, and T l negative 50. In group 14, the values are: C negative 123, S i negative 120, G e negative 115, S n negative 121, and P b negative 101. In group 15 the values are: N 0, P negative 74, A s negative 7, S b negative 101, and B i negative 101. In group 16, the values are: O negative 141, S negative 20, S e negative 195, T e negative 190, and P o negative 170. In group 17, the values are: F negative 322, C l negative 348, B r negative 324, I negative 295, and A t negative 270 asterisk. In group 18, the values are: H e positive 20 asterisk, N e negative 30, A r positive 35 asterisk, K r positive 40 asterisk, X e positive 40 asterisk, and R n positive 40 asterisk.
Figure 6.35 — 6.5 Periodic Variations in Element Properties

Figure 6.35 This version of the periodic table displays the electron affinity values (in kJ/mol) for selected elements.

Paul Flowers, Klaus Theopold, Richard Langley, and William R. Robinson, Chemistry 2E, OpenStax. · CC BY-NC-SA 4.0 · Original image ↗ · Access for free ↗
Covalent radius (pm)
F 64 +9
Cl 99 +17
Br 114 +35
I 133 +53
At 148 +85

Table 6.2. Paul Flowers, Klaus Theopold, Richard Langley, and William R. Robinson, Chemistry 2E, OpenStax.

Element IE1 IE2 IE3 IE4 IE5 IE6 IE7
K 418.8 3051.8 4419.6 5876.9 7975.5 9590.6 11343
Ca 589.8 1145.4 4912.4 6490.6 8153.0 10495.7 12272.9
Sc 633.1 1235.0 2388.7 7090.6 8842.9 10679.0 13315.0
Ga 578.8 1979.4 2964.6 6180 8298.7 10873.9 13594.8
Ge 762.2 1537.5 3302.1 4410.6 9021.4 Not available Not available
As 944.5 1793.6 2735.5 4836.8 6042.9 12311.5 Not available

Table 6.3. Paul Flowers, Klaus Theopold, Richard Langley, and William R. Robinson, Chemistry 2E, OpenStax.

Source: 6.5 Periodic Variations in Element Properties

2.5 The Periodic Table — figures and tables
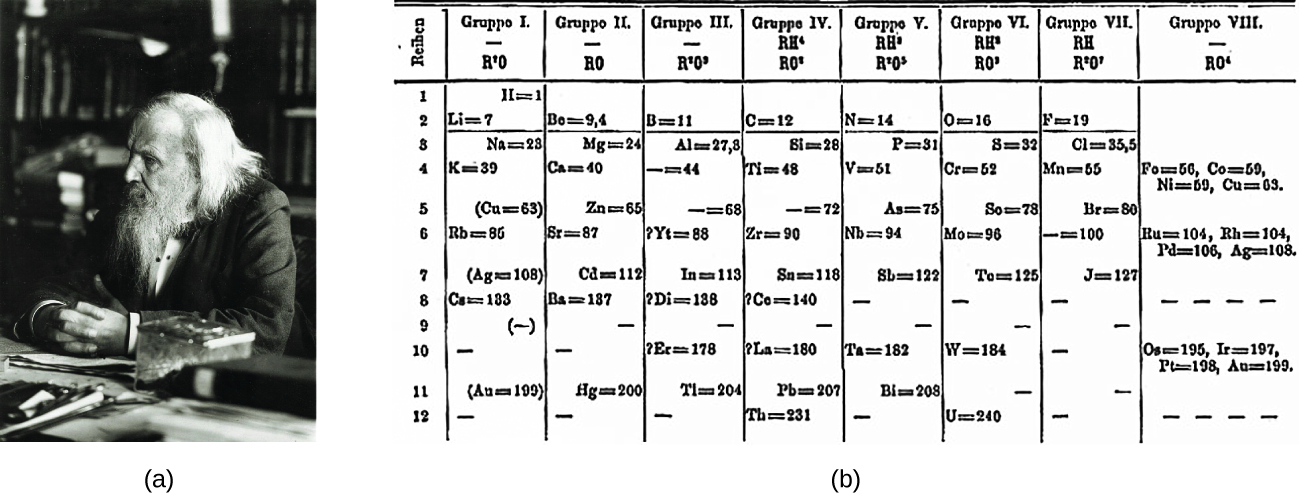
Figure A shows a photograph of Dimitri Mendeleev. Figure B shows the first periodic table developed by Mendeleev, which had eight groups and twelve periods. In the first group (—, R superscript plus sign 0) is the following information: H = 1, L i = 7, N a = 23, K = 39, (C u = 63), R b = 85, (A g = 108), C a = 183, (—),—, (A u = 199) —. Note that each of these entries corresponds to one of the twelve periods respectively. The second group (—, R 0) contains the following information: (not entry for period 1) B o = 9, 4, M g = 24, C a = 40, Z n = 65, S r = 87, C d = 112, B a = 187, —, —, H g = 200, —. Note the ach of these entries corresponds to one of the twelve periods respectively. Group three (—, R superscript one 0 superscript nine) contains the information: (no entry for period 1), B = 11, A l = 27, 8. — = 44, — = 68, ? Y t = 88, I n = 113, ? D I = 138, —, ? E r = 178, T l = 204, —. Note that each of these entries corresponds to one of the twelve periods respectively. Group four (RH superscript four, R0 superscript eight) contains the following information: (no entry for period 1), C = 12, B i = 28, T i = 48, — = 72, Z r = 90, S n = 118, ? C o = 140, ? L a = 180, P b = 207, T h = 231. Note that each of these entries corresponds to one of the twelve periods respectively. Group five (R H superscript two, R superscript two 0 superscript five) contains the following information: (no entry for period 1), N = 14, P = 31, V = 51, A s = 75, N b = 94, S b = 122, —, —, T a = 182, B l = 208, —. Note that each of these entries corresponds to one of the twelve periods respectively. Group six (R H superscript two, R 0 superscript three) contains the following information: (no entry for period 1), O = 16, S = 32, C r = 52, S o = 78, M o = 96, T o = 125, —, —, W = 184, —, U = 240. Note that each of these entries corresponds to one of the twelve periods respectively. Group seven (R H , R superscript plus sing, 0 superscript 7) contains the following information: (no entry for period 1), F = 19, C l = 35, 5, M n = 55, B r = 80, — = 100, J = 127, —, —, —, —, —. Note that each of these entries corresponds to one of the twelve periods respectively. Group 8 (—, R 0 superscript four) contains the following information: (no entry for periods 1, 2, 3), in period 4: F o = 56, C o = 59, N i = 59, C u = 63, no entry for period five, in period 6: R u = 104, R h = 104, P d = 106, A g = 108, no entries for periods 7, 8 , or 9, in period 10: O s = 195, I r = 197, P t = 198, A u = 199, no entries for periods 11 or 12.
Figure 2.25 — 2.5 The Periodic Table

Figure 2.25 (a) Dimitri Mendeleev is widely credited with creating (b) the first periodic table of the elements. (credit a: modification of work by Serge Lachinov; credit b: modification of work by “Den fjättrade ankan”/Wikimedia Commons)

Paul Flowers, Klaus Theopold, Richard Langley, and William R. Robinson, Chemistry 2E, OpenStax. (credit a: modification of work by Serge Lachinov; credit b: modification of work by “Den fjättrade ankan”/Wikimedia Commons) · CC BY-NC-SA 4.0 · Original image ↗ · Access for free ↗
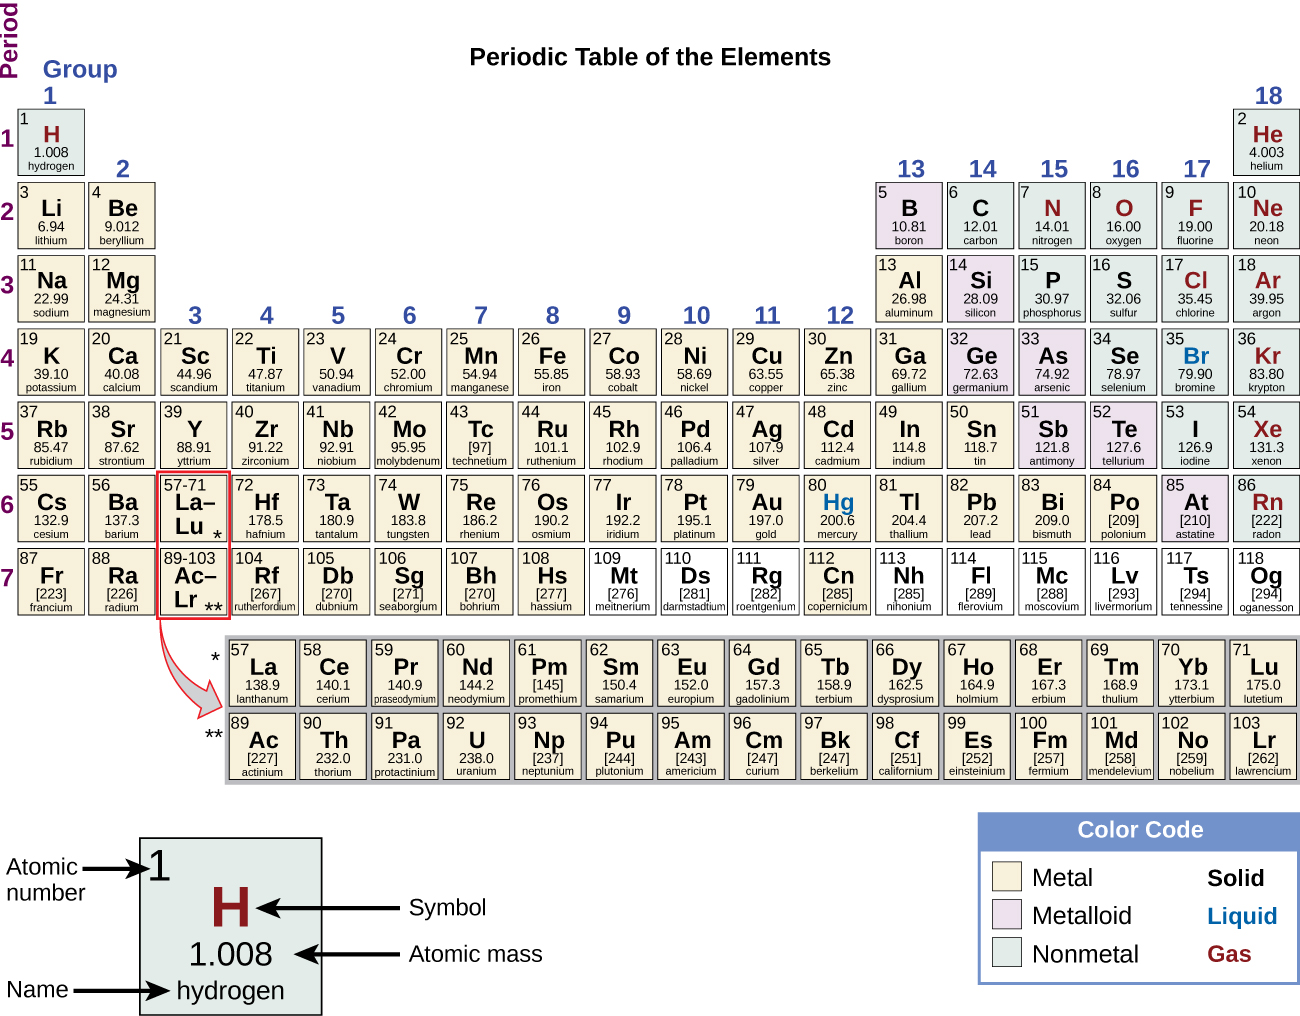
The Periodic Table of Elements is shown. The 18 columns are labeled “Group” and the 7 rows are labeled “Period.” Below the table to the right is a box labeled “Color Code” with different colors for metals, metalloids, and nonmetals, as well as solids, liquids, and gases. To the left of this box is an enlarged picture of the upper-left most box on the table. The number 1 is in its upper-left hand corner and is labeled “Atomic number.” The letter “H” is in the middle in red indicating that it is a gas. It is labeled “Symbol.” Below that is the number 1.008 which is labeled “Atomic Mass.” Below that is the word hydrogen which is labeled “name.” The color of the box indicates that it is a nonmetal. Each element will be described in this order: atomic number; name; symbol; whether it is a metal, metalloid, or nonmetal; whether it is a solid, liquid, or gas; and atomic mass. Beginning at the top left of the table, or period 1, group 1, is a box containing “1; hydrogen; H; nonmetal; gas; and 1.008.” There is only one other element box in period 1, group 18, which contains “2; helium; H e; nonmetal; gas; and 4.003.” Period 2, group 1 contains “3; lithium; L i; metal; solid; and 6.94” Group 2 contains “4; beryllium; B e; metal; solid; and 9.012.” Groups 3 through 12 are skipped and group 13 contains “5; boron; B; metalloid; solid; 10.81.” Group 14 contains “6; carbon; C; nonmetal; solid; and 12.01.” Group 15 contains “7; nitrogen; N; nonmetal; gas; and 14.01.” Group 16 contains “8; oxygen; O; nonmetal; gas; and 16.00.” Group 17 contains “9; fluorine; F; nonmetal; gas; and 19.00.” Group 18 contains “10; neon; N e; nonmetal; gas; and 20.18.” Period 3, group 1 contains “11; sodium; N a; metal; solid; and 22.99.” Group 2 contains “12; magnesium; M g; metal; solid; and 24.31.” Groups 3 through 12 are skipped again in period 3 and group 13 contains “13; aluminum; A l; metal; solid; and 26.98.” Group 14 contains “14; silicon; S i; metalloid; solid; and 28.09.” Group 15 contains “15; phosphorous; P; nonmetal; solid; and 30.97.” Group 16 contains “16; sulfur; S; nonmetal; solid; and 32.06.” Group 17 contains “17; chlorine; C l; nonmetal; gas; and 35.45.” Group 18 contains “18; argon; A r; nonmetal; gas; and 39.95.” Period 4, group 1 contains “19; potassium; K; metal; solid; and 39.10.” Group 2 contains “20; calcium; C a; metal; solid; and 40.08.” Group 3 contains “21; scandium; S c; metal; solid; and 44.96.” Group 4 contains “22; titanium; T i; metal; solid; and 47.87.” Group 5 contains “23; vanadium; V; metal; solid; and 50.94.” Group 6 contains “24; chromium; C r; metal; solid; and 52.00.” Group 7 contains “25; manganese; M n; metal; solid; and 54.94.” Group 8 contains “26; iron; F e; metal; solid; and 55.85.” Group 9 contains “27; cobalt; C o; metal; solid; and 58.93.” Group 10 contains “28; nickel; N i; metal; solid; and 58.69.” Group 11 contains “29; copper; C u; metal; solid; and 63.55.” Group 12 contains “30; zinc; Z n; metal; solid; and 65.38.” Group 13 contains “31; gallium; G a; metal; solid; and 69.72.” Group 14 contains “32; germanium; G e; metalloid; solid; and 72.63.” Group 15 contains “33; arsenic; A s; metalloid; solid; and 74.92.” Group 16 contains “34; selenium; S e; nonmetal; solid; and 78.97.” Group 17 contains “35; bromine; B r; nonmetal; liquid; and 79.90.” Group 18 contains “36; krypton; K r; nonmetal; gas; and 83.80.” Period 5, group 1 contains “37; rubidium; R b; metal; solid; and 85.47.” Group 2 contains “38; strontium; S r; metal; solid; and 87.62.” Group 3 contains “39; yttrium; Y; metal; solid; and 88.91.” Group 4 contains “40; zirconium; Z r; metal; solid; and 91.22.” Group 5 contains “41; niobium; N b; metal; solid; and 92.91.” Group 6 contains “42; molybdenum; M o; metal; solid; and 95.95.” Group 7 contains “43; technetium; T c; metal; solid; and 97.” Group 8 contains “44; ruthenium; R u; metal; solid; and 101.1.” Group 9 contains “45; rhodium; R h; metal; solid; and 102.9.” Group 10 contains “46; palladium; P d; metal; solid; and 106.4.” Group 11 contains “47; silver; A g; metal; solid; and 107.9.” Group 12 contains “48; cadmium; C d; metal; solid; and 112.4.” Group 13 contains “49; indium; I n; metal; solid; and 114.8.” Group 14 contains “50; tin; S n; metal; solid; and 118.7.” Group 15 contains “51; antimony; S b; metalloid; solid; and 121.8.” Group 16 contains “52; tellurium; T e; metalloid; solid; and 127.6.” Group 17 contains “53; iodine; I; nonmetal; solid; and 126.9.” Group 18 contains “54; xenon; X e; nonmetal; gas; and 131.3.” Period 6, group 1 contains “55; cesium; C s; metal; solid; and 132.9.” Group 2 contains “56; barium; B a; metal; solid; and 137.3.” Group 3 breaks the pattern. The box has a large arrow pointing to a row of elements below the table with atomic numbers ranging from 57-71. In sequential order by atomic number, the first box in this row contains “57; lanthanum; L a; metal; solid; and 138.9.” To its right, the next is “58; cerium; C e; metal; solid; and 140.1.” Next is “59; praseodymium; P r; metal; solid; and 140.9.” Next is “60; neodymium; N d; metal; solid; and 144.2.” Next is “61; promethium; P m; metal; solid; and 145.” Next is “62; samarium; S m; metal; solid; and 150.4.” Next is “63; europium; E u; metal; solid; and 152.0.” Next is “64; gadolinium; G d; metal; solid; and 157.3.” Next is “65; terbium; T b; metal; solid; and 158.9.” Next is “66; dysprosium; D y; metal; solid; and 162.5.” Next is “67; holmium; H o; metal; solid; and 164.9.” Next is “68; erbium; E r; metal; solid; and 167.3.” Next is “69; thulium; T m; metal; solid; and 168.9.” Next is “70; ytterbium; Y b; metal; solid; and 173.1.” The last in this special row is “71; lutetium; L u; metal; solid; and 175.0.” Continuing in period 6, group 4 contains “72; hafnium; H f; metal; solid; and 178.5.” Group 5 contains “73; tantalum; T a; metal; solid; and 180.9.” Group 6 contains “74; tungsten; W; metal; solid; and 183.8.” Group 7 contains “75; rhenium; R e; metal; solid; and 186.2.” Group 8 contains “76; osmium; O s; metal; solid; and 190.2.” Group 9 contains “77; iridium; I r; metal; solid; and 192.2.” Group 10 contains “78; platinum; P t; metal; solid; and 195.1.” Group 11 contains “79; gold; A u; metal; solid; and 197.0.” Group 12 contains “80; mercury; H g; metal; liquid; and 200.6.” Group 13 contains “81; thallium; T l; metal; solid; and 204.4.” Group 14 contains “82; lead; P b; metal; solid; and 207.2.” Group 15 contains “83; bismuth; B i; metal; solid; and 209.0.” Group 16 contains “84; polonium; P o; metal; solid; and 209.” Group 17 contains “85; astatine; A t; metalloid; solid; and 210.” Group 18 contains “86; radon; R n; nonmetal; gas; and 222.” Period 7, group 1 contains “87; francium; F r; metal; solid; and 223.” Group 2 contains “88; radium; R a; metal; solid; and 226.” Group 3 breaks the pattern much like what occurs in period 6. A large arrow points from the box in period 7, group 3 to a special row containing the elements with atomic numbers ranging from 89-103, just below the row which contains atomic numbers 57-71. In sequential order by atomic number, the first box in this row contains “89; actinium; A c; metal; solid; and 227.” To its right, the next is “90; thorium; T h; metal; solid; and 232.0.” Next is “91; protactinium; P a; metal; solid; and 231.0.” Next is “92; uranium; U; metal; solid; and 238.0.” Next is “93; neptunium; N p; metal; solid; and N p.” Next is “94; plutonium; P u; metal; solid; and 244.” Next is “95; americium; A m; metal; solid; and 243.” Next is “96; curium; C m; metal; solid; and 247.” Next is “97; berkelium; B k; metal; solid; and 247.” Next is “98; californium; C f; metal; solid; and 251.” Next is “99; einsteinium; E s; metal; solid; and 252.” Next is “100; fermium; F m; metal; solid; and 257.” Next is “101; mendelevium; M d; metal; solid; and 258.” Next is “102; nobelium; N o; metal; solid; and 259.” The last in this special row is “103; lawrencium; L r; metal; solid; and 262.” Continuing in period 7, group 4 contains “104; rutherfordium; R f; metal; solid; and 267.” Group 5 contains “105; dubnium; D b; metal; solid; and 270.” Group 6 contains “106; seaborgium; S g; metal; solid; and 271.” Group 7 contains “107; bohrium; B h; metal; solid; and 270.” Group 8 contains “108; hassium; H s; metal; solid; and 277.” Group 9 contains “109; meitnerium; M t; not indicated; solid; and 276.” Group 10 contains “110; darmstadtium; D s; not indicated; solid; and 281.” Group 11 contains “111; roentgenium; R g; not indicated; solid; and 282.” Group 12 contains “112; copernicium; C n; metal; liquid; and 285.” Group 13 contains “113; ununtrium; U u t; not indicated; solid; and 285.” Group 14 contains “114; flerovium; F l; not indicated; solid; and 289.” Group 15 contains “115; ununpentium; U u p; not indicated; solid; and 288.” Group 16 contains “116; livermorium; L v; not indicated; solid; and 293.” Group 17 contains “117; ununseptium; U u s; not indicated; solid; and 294.” Group 18 contains “118; ununoctium; U u o; not indicated; solid; and 294.”
Figure 2.26 — 2.5 The Periodic Table

Figure 2.26 Elements in the periodic table are organized according to their properties.

Paul Flowers, Klaus Theopold, Richard Langley, and William R. Robinson, Chemistry 2E, OpenStax. · CC BY-NC-SA 4.0 · Original image ↗ · Access for free ↗
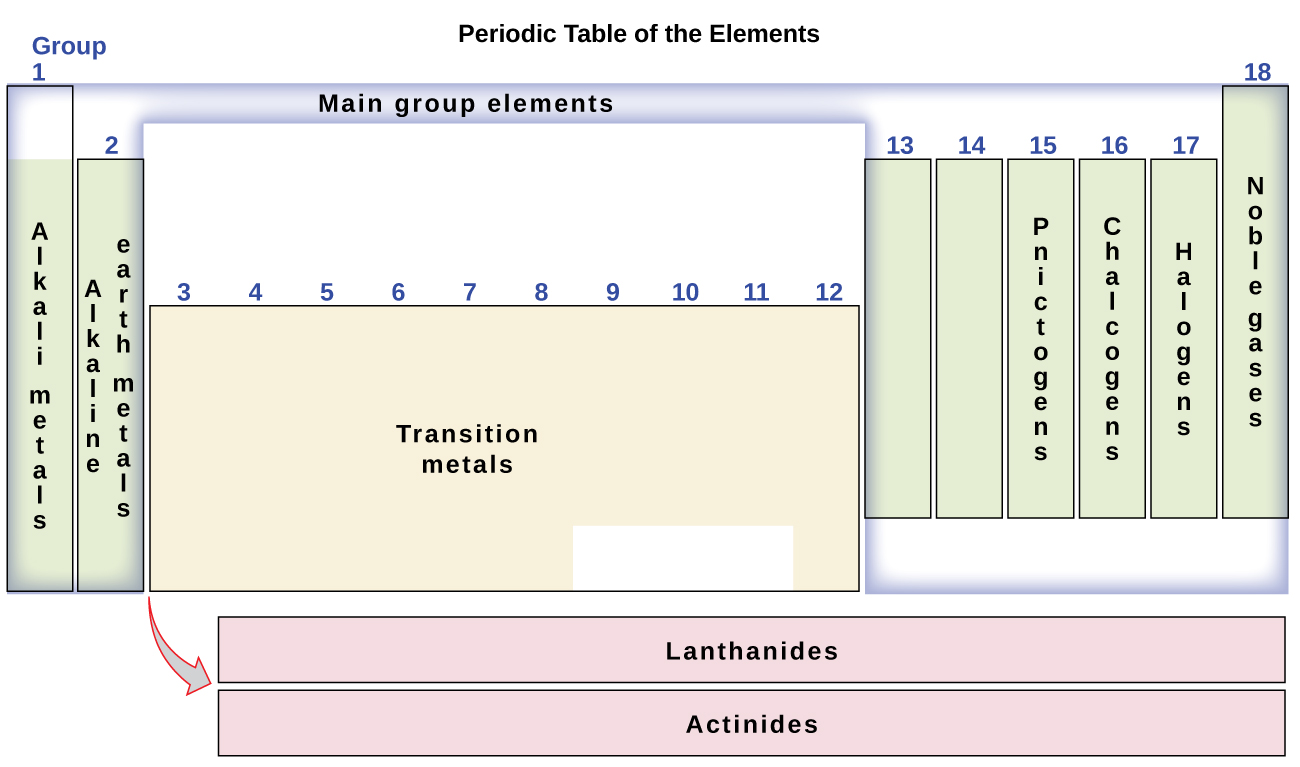
This diagram combines the groups and periods of the periodic table based on their similar properties. Group 1 contains the alkali metals, group 2 contains the earth alkaline metals, group 15 contains the pnictogens, group 16 contains the chalcogens, group 17 contains the halogens and group 18 contains the noble gases. The main group elements consist of groups 1, 2, and 12 through 18. Therefore, most of the transition metals, which are contained in groups 3 through 11, are not main group elements. The lanthanides and actinides are called out at the bottom of the periodic table.
Figure 2.27 — 2.5 The Periodic Table

Figure 2.27 The periodic table organizes elements with similar properties into groups.

Paul Flowers, Klaus Theopold, Richard Langley, and William R. Robinson, Chemistry 2E, OpenStax. · CC BY-NC-SA 4.0 · Original image ↗ · Access for free ↗

Source: 2.5 The Periodic Table

189 terms, alphabetically ordered

Acid · ·

In the Brønsted–Lowry model, a substance that can donate a . Acidic have a higher activity than water.

Read explanation · OpenStax ↗
Activation energy ·

The energy barrier that must overcome to reach a and undergo .

Read explanation · OpenStax ↗
Active catalytic-site concentration ·

The total of active sites used to calculate from . It equals active when each has one site.

Read explanation · Biology LibreTexts ↗
Active site

The region of an that binds its and carries out .

Read explanation · OpenStax ↗
Adenine

A that pairs with in and in .

Read explanation · OpenStax ↗
Adenosine triphosphate

An energy-carrying ; its powers many cellular processes, including cycles.

Read explanation · OpenStax ↗
alkali metal

Group 1 metal, typically forming a +1 .

Read explanation · OpenStax ↗
alkaline-earth metal

Group 2 metal, typically forming a +2 .

Read explanation · OpenStax ↗
Alpha carbon · ·

The central carbon next to the carboxyl carbon. In a standard it binds an , hydrogen, and .

Read explanation · OpenStax ↗
Alpha helix · · · · · ·

A helical stabilized by between a oxygen and an hydrogen four later.

Read explanation · OpenStax ↗
Amide · · ·

A group containing a carbon bonded to nitrogen. are amide linkages.

Read explanation · OpenStax ↗
Amino acid

A building block containing amino and and a characteristic .

Read explanation · OpenStax ↗
Amino acid residue · ·

The part of an incorporated into a chain. Residue can also describe another building block within a larger .

Read explanation · OpenStax ↗
Amino group · · ·

A nitrogen-containing . A free ’s amino group is typically (NH₃⁺) near physiological ; ’s ring nitrogen is an exception to this formula.

Read explanation · OpenStax ↗
Amphipathic

Having both a region and a region, as in a or .

Read explanation · OpenStax ↗
Analytical standard ·

A material with a known identity or amount used to compare or calibrate measurements.

Read explanation · Agilent ↗
Anion ·

An with a negative net .

Read explanation · OpenStax ↗
Antiparallel

Running in opposite directions, as with two strands or neighboring strands in some .

Read explanation · OpenStax ↗
Aqueous solution ·

A in which water is the .

Read explanation · OpenStax ↗
Archaea ·

A of distinct from , with characteristic chemistry and -expression machinery.

Read explanation · OpenStax ↗
Aromatic

Containing a cyclic, with . , , and have aromatic .

Read explanation · OpenStax ↗
Atom

The smallest unit of an element that retains its chemical identity; it has a surrounded by .

Read explanation · OpenStax ↗
atomic number

Number of in a .

Read explanation · OpenStax ↗
Bacteria ·

A of single-celled . Bacterial cells lack a -bound and are distinct from .

Read explanation · OpenStax ↗
Benzene ring

A six-carbon ring with .

Read explanation · OpenStax ↗
Benzyl group

A attached through a –CH₂– group; part of ’s .

Read explanation · OpenStax ↗
Beta sheet · · · · · ·

A made of aligned segments connected by ; strands may be parallel or .

Read explanation · OpenStax ↗
Binding affinity ·

The strength of a binding interaction between . For simple binding, a smaller means higher affinity.

Read explanation · OpenStax ↗
Biomolecule

A made by or involved in living systems, including , , , and .

Read explanation · OpenStax ↗
Blotting ·

Transfer of separated or to a so a specific target can be detected.

Read explanation · Thermo Fisher ↗
Brønsted–Lowry base · · · · · · · · · · ·

In the Brønsted–Lowry model, a substance that can accept a . Basic solutions have lower activity than water.

Read explanation · OpenStax ↗
Calibration

Establishing the relation between a measured signal and known values or .

Read explanation · Agilent ↗
Carbohydrate

A class of including sugars and their , used for energy storage, structure, and recognition.

Read explanation · OpenStax ↗
Carbonyl group · ·

A carbon double-bonded to oxygen, C=O; present in and many other .

Read explanation · OpenStax ↗
Carboxyl group · ·

An , COOH. In free it is usually to COO⁻ near physiological .

Read explanation · OpenStax ↗
Catalyst · ·

A substance that speeds a by providing a pathway with lower and is regenerated rather than consumed overall.

Read explanation · OpenStax ↗
Cation ·

An with a positive net .

Read explanation · OpenStax ↗
Chemical compound ·

A substance containing of two or more different chemically combined in a definite composition.

Read explanation · OpenStax ↗
Chemical element

A substance defined by having the same number of , such as carbon or oxygen.

Read explanation · OpenStax ↗
Chemical reaction ·

A process that rearranges and chemical bonds, converting into .

Read explanation · OpenStax ↗
Chromatography

Separation of mixture components by their different interactions with a and a moving .

Read explanation · Waters ↗
Chromosome ·

An organized with associated that carries . A replicated chromosome has two .

Read explanation · OpenStax ↗
Codon

A sequence of three that specifies an or a stop signal.

Read explanation · OpenStax ↗
Concentration

The amount of a substance in a specified volume or mass of mixture.

Read explanation · OpenStax ↗
Configuration

A stereochemical arrangement that cannot be changed into another configuration by ordinary single-bond rotations alone.

Read explanation · OpenStax ↗
Conjugated system ·

Adjacent orbitals that allow to be distributed across several , often through alternating single and multiple bonds.

Read explanation · OpenStax ↗
Covalent bond · ·

A bond in which share pairs. and are covalent.

Read explanation · OpenStax ↗
Cysteine ·

An with a . Two cysteines can form a .

Read explanation · OpenStax ↗
Cytosine

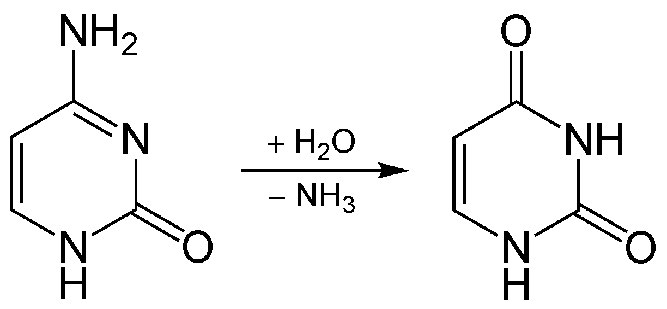
A in and that pairs with . can convert it to .

Read explanation · OpenStax ↗
Deamination

Removal of an . Deamination of produces and can change genetic information if unrepaired.

Read explanation · Biology LibreTexts / Oregon State University ↗
Deoxyribonucleic acid

The that stores genetic information used to specify and sequences.

Read explanation · OpenStax ↗
Deprotonation

Removal of a from a or group; this changes its by minus one.

Read explanation · OpenStax ↗
Detergent

An substance that can associate with both water and material; detergents can disrupt or interactions.

Read explanation · Thermo Fisher ↗
Dissociation · ·

Separation of a chemical species or molecular complex into smaller components; dissociation releases a .

Read explanation · OpenStax ↗
Dissociation constant · ·

An for complex . For E + S ⇌ , Kd = [E]/[]; a smaller value indicates tighter binding under the stated conditions.

Read explanation · IUBMB ↗
Disulfide bond · · ·

A covalent sulfur–sulfur bond formed by of two , which can stabilize structure.

Read explanation · NCBI Bookshelf ↗
DNA replication

Copying so genetic information can be passed to daughter cells. Each guides a complementary new strand.

Read explanation · OpenStax ↗
effective nuclear charge

Net attraction experienced by an after accounting for .

Read explanation · OpenStax ↗
Electric charge · · ·

An electrical property that can be positive or negative. Opposite charges attract and like charges repel; net charge is the sum of all charges on a particle.

Read explanation · OpenStax ↗
Electric field

A quantity describing the electrical force per unit positive . An applied field drives through a gel during .

Read explanation · Thermo Fisher ↗
Electron

A negatively subatomic particle. Electron sharing and transfer determine much of chemical bonding.

Read explanation · OpenStax ↗
electron affinity

Energy change associated with adding an to a gaseous species; the reporting sign convention must be checked.

Read explanation · OpenStax ↗
Electron delocalization ·

Distribution of across several rather than confinement to one or bond.

Read explanation · OpenStax ↗
Electronegativity ·

An ’s tendency to attract shared in a chemical bond. Unequal attraction can make a bond .

Read explanation · OpenStax ↗
Electrophoresis

Movement of in an , used to separate through a support such as a gel.

Read explanation · Thermo Fisher ↗
Electrostatic interaction · ·

Attraction between opposite electrical or repulsion between like .

Read explanation · OpenStax ↗
Endoplasmic reticulum

An interconnected network continuous with the ; it includes regions involved in processing and synthesis.

Read explanation · OpenStax ↗
Endothermic

Having a positive . The process absorbs heat at constant pressure when only pressure–volume occurs.

Read explanation · OpenStax ↗
Enthalpy

A quantity whose change equals heat exchanged at constant pressure when only pressure–volume occurs.

Read explanation · OpenStax ↗
Enthalpy change · ·

The difference in between and . At constant pressure with only pressure–volume , it equals the heat transferred to the system.

Read explanation · OpenStax ↗
Entropy

A measure related to the number of accessible microscopic arrangements and the dispersal of energy.

Read explanation · OpenStax ↗
Enzyme

A biological that speeds a without being consumed. Most enzymes are .

Read explanation · OpenStax ↗
Enzyme saturation · ·

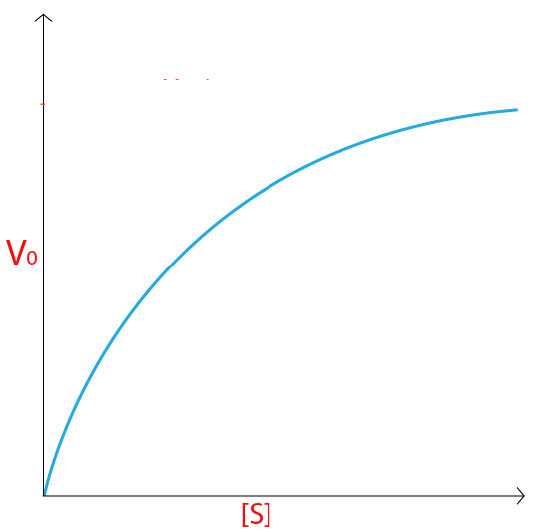
The high- limit in which sites spend almost all their time processing and the rate approaches .

Read explanation · Biology LibreTexts ↗
Enzyme–substrate complex · · ·

The bound association of an and its during a cycle. Often abbreviated ES in schemes.

Read explanation · OpenStax ↗
Equilibrium

A state where opposing processes occur at equal rates, so macroscopic or other properties remain constant.

Read explanation · OpenStax ↗
Equilibrium constant

A ratio of to activities at , each raised to its stoichiometric coefficient. At a fixed temperature, a does not change this ratio.

Read explanation · OpenStax ↗
Eukaryote ·

An organism whose cells have a -enclosed ; animals, plants, fungi, and protists are eukaryotes.

Read explanation · OpenStax ↗
Functional group

A group of whose chemical behavior gives a characteristic and properties.

Read explanation · OpenStax ↗
Gene

A sequence that contributes to a functional or , together with the information needed to express it.

Read explanation · OpenStax ↗
Gene expression

Production of a functional from a , including and, for -coding , .

Read explanation · NCBI Bookshelf ↗
ground state

Lowest accessible energy state of a system.

Read explanation · OpenStax ↗
Guanine

A that pairs with through three .

Read explanation · OpenStax ↗
halogen

Group 17 element with seven valence and a common −1 ionic state.

Read explanation · OpenStax ↗
Histidine ·

A with an . Mostly uncharged near physiological , it can accept or donate .

Read explanation · OpenStax ↗
Hydrogen bond ·

An attraction between a hydrogen bonded to an and another . hydrogen bonds stabilize .

Read explanation · OpenStax ↗
Hydrogen ion · ·

A positively hydrogen species. H⁺ denotes a , which is hydrated in water; its activity determines .

Read explanation · OpenStax ↗
Hydrolysis

Breaking a chemical bond by adding water. hydrolysis separates .

Read explanation · OpenStax ↗
Hydrophilic

Interacting favorably with water, typically because a group is or .

Read explanation · OpenStax ↗
Hydrophobic

Interacting poorly with water. often gather in a ’s interior.

Read explanation · OpenStax ↗
Hydroxide ion ·

The negatively OH⁻. Basic contain a higher hydroxide ion activity than water at the same temperature.

Read explanation · OpenStax ↗
Hydroxyl group ·

An oxygen bonded to hydrogen, –OH. Hydroxyl groups can and often increase .

Read explanation · OpenStax ↗
Imidazole

A five-membered ring containing two nitrogens; ’s contains this ring.

Read explanation · OpenStax ↗
Indole

A fused six-membered and five-membered ring system containing nitrogen; found in .

Read explanation · OpenStax ↗
Ion · ·

An or with a net because its numbers of and do not balance.

Read explanation · OpenStax ↗
Ionization ·

Formation of electrically or , for example before analysis in a .

Read explanation · Thermo Fisher ↗
ionization energy

Energy required to remove an from a gaseous or .

Read explanation · OpenStax ↗
isoelectronic

Having the same number of .

Read explanation · OpenStax ↗
Isotope ·

One of several forms of an element with the same number of but different numbers of neutrons.

Read explanation · OpenStax ↗
Kilojoule ·

A unit of energy equal to 1,000 joules. Energy changes are often reported per , in kJ/mol.

Read explanation · NIST ↗
Kinetics

The study of and the factors and mechanisms that control them. A favorable may still proceed slowly.

Read explanation · OpenStax ↗
linkage

A tendency of nearby on the same to be inherited together.

Read explanation · OpenStax ↗
Lipid

A broad class of largely or , including fats, , and steroids.

Read explanation · OpenStax ↗
locus

The specific position of a or other feature.

Read explanation · OpenStax ↗
Logarithm · · ·

The exponent needed to obtain a number from a chosen fixed number. For decimal logarithms, log₁₀(100) = 2 because 10² = 100; uses the negative decimal logarithm of activity.

Read explanation · OpenStax ↗
magnetic field

field that exerts forces on moving and magnetic moments.

Read explanation · OpenStax ↗
mass number

Total number of and neutrons in a .

Read explanation · OpenStax ↗
Mass spectrometry ·

Analysis of according to their mass-to- ratios, used to identify and or .

Read explanation · Thermo Fisher ↗
Matrix

A supporting material, such as a gel or the solid support in a column. Its properties influence movement and binding of sample .

Read explanation · Thermo Fisher ↗
Maximum reaction rate · ·

The limiting as becomes saturating. For a fixed under given conditions, Vmax = times .

Read explanation · Biology LibreTexts ↗
mechanical power

Rate of energy transfer, measured in watts.

Read explanation · OpenStax ↗
mechanical work

Energy transferred by a force acting through ; the force component parallel to motion contributes.

Read explanation · OpenStax ↗
Membrane · · · ·

A thin boundary or sheet. Cell membranes are bilayers containing ; membranes are synthetic supports that hold or for detection.

Read explanation · OpenStax ↗
Messenger RNA ·

An that carries coding information used by to synthesize a .

Read explanation · OpenStax ↗
Mobile phase

The moving fluid that carries a sample through a system.

Read explanation · Waters ↗
mole

Amount containing exactly 6.02214076 × 10²³ specified entities.

Read explanation · OpenStax ↗
Molecular chaperone · ·

A that assists other in folding or prevents , without specifying their sequence.

Read explanation · NCBI Bookshelf ↗
Molecule

Two or more joined by . A molecule may be electrically or carry a .

Read explanation · OpenStax ↗
Native structure · · ·

A ’s functional folded arrangement under its normal conditions.

Read explanation · NCBI Bookshelf ↗
Neutral

Having no net . For a , neutral instead means equal and activities; its is about 7 at 25 °C.

Read explanation · OpenStax ↗
Nitrogenous base · · ·

A nitrogen-containing ring component of ; its pairing interactions help specify sequences.

Read explanation · OpenStax ↗
Nonpolar ·

Lacking a substantial separation of . Nonpolar groups generally interact poorly with water.

Read explanation · OpenStax ↗
Nuclear envelope

The double enclosing the and continuous with the .

Read explanation · OpenStax ↗
Nucleic acid

A of , such as or , used in information storage, expression, and other cellular functions.

Read explanation · OpenStax ↗
Nucleotide

A joined to a sugar and one or more .

Read explanation · OpenStax ↗
Nucleus ·

A -enclosed compartment containing most of a cell’s .

Read explanation · OpenStax ↗
orbital

Quantum state describing an ’s spatial probability distribution.

Read explanation · OpenStax ↗
oscillation frequency ·

Number of repeated cycles per unit time, measured in hertz.

Read explanation · OpenStax ↗
Oxidation ·

Loss of or an increase in oxidation state. Oxidizing two can form a .

Read explanation · OpenStax ↗
Peptide

A chain of joined by ; the term commonly describes chains shorter than a typical .

Read explanation · OpenStax ↗
Peptide bond ·

A covalent between the carboxyl carbon of one and the amino nitrogen of the next.

Read explanation · OpenStax ↗
periodic-table period

Horizontal row of the periodic table; increases across the row while a principal shell is filled.

Read explanation · OpenStax ↗
pH

A measure of , defined as the negative of activity. Lower pH means greater ; pH influences .

Read explanation · OpenStax ↗
Phenylalanine ·

A with an .

Read explanation · OpenStax ↗
Phosphate group ·

A phosphorus-containing group bonded to oxygens; phosphate groups occur in , , and modified .

Read explanation · OpenStax ↗
Phospholipid

An with a -containing region and tails; a major component of cellular .

Read explanation · OpenStax ↗
physical displacement ·

Signed or difference between final and initial position.

Read explanation · OpenStax ↗
Polar

Having an uneven distribution of . Polar groups often interact favorably with water.

Read explanation · OpenStax ↗
Polyacrylamide

A used to form a gel for separating by .

Read explanation · Thermo Fisher ↗
Polyacrylamide gel electrophoresis ·

Electrophoretic separation using a . Native PAGE preserves much of a ’s .

Read explanation · Thermo Fisher ↗
Polymer

A large made from many linked molecular building blocks.

Read explanation · OpenStax ↗
Polypeptide

A chain of connected by . A functional can contain one or several such chains.

Read explanation · OpenStax ↗
Porous material · · · ·

A material containing small spaces that can admit of suitable size.

Read explanation · Cytiva ↗
Prokaryote ·

An organism whose cells lack a -bound ; and are prokaryotes.

Read explanation · OpenStax ↗
Proline ·

An whose loops back to the nitrogen, restricting rotation and often creating bends.

Read explanation · OpenStax ↗
Protein

One or more folded chains that perform biological roles such as , transport, signaling, or structural support.

Read explanation · OpenStax ↗
Protein aggregation · ·

Association of into larger clusters, often when exposed surfaces of unfolded stick together.

Read explanation · NCBI Bookshelf ↗
Protein backbone ·

The repeating nitrogen–alpha-carbon– chain of a , excluding its variable .

Read explanation · OpenStax ↗
Protein domain · ·

A region of a that forms a recognizable structural or functional unit.

Read explanation · OpenStax ↗
Proton

A positively subatomic particle. In – chemistry, donating a proton means transferring a .

Read explanation · OpenStax ↗
Protonation

Addition of a to an , , or ; this changes its by plus one.

Read explanation · OpenStax ↗
Purification · ·

Separating a desired substance from other components of a mixture.

Read explanation · Cytiva ↗
Purine · ·

A with two fused rings. and are purines.

Read explanation · OpenStax ↗
Pyrimidine · ·

A with one six-membered ring. , , and are pyrimidines.

Read explanation · OpenStax ↗
Quantification · ·

Estimating the amount or of a substance from measured signals and suitable or .

Read explanation · Waters ↗
R group · ·

The variable side chain attached to an ’s . It determines identity, , , and chemical behavior.

Read explanation · OpenStax ↗
Radioisotope · ·

An with an unstable that releases radiation as it decays.

Read explanation · OpenStax ↗
Reactant

A starting substance transformed during a .

Read explanation · OpenStax ↗
Reaction intermediate · ·

A species formed in one step and consumed in another. It occupies a local energy minimum between .

Read explanation · OpenStax ↗
Reaction product ·

A substance formed by a .

Read explanation · OpenStax ↗
Reaction rate · ·

How quickly are consumed or form, usually expressed as a change per unit time.

Read explanation · OpenStax ↗
Reduction

Gain of or a decrease in state. Reducing a restores two .

Read explanation · OpenStax ↗
Ribonucleic acid ·

A with roles in , regulation, and ; carries -coding information.

Read explanation · OpenStax ↗
Ribosome ·

A complex of and that translates into a .

Read explanation · OpenStax ↗
sarcoplasmic reticulum

Specialized muscle storing and releasing calcium for contraction.

Read explanation · OpenStax ↗
Secondary structure

Local folding, such as and , stabilized mainly by .

Read explanation · OpenStax ↗
shielding

of the external experienced by a due to its electronic environment.

Read explanation · OpenStax ↗
Sister chromatid

One of the two copies of a produced by . An intact sister chromatid can supply a template for accurate repair.

Read explanation · Biology LibreTexts / Oregon State University ↗
Solubility ·

The amount of a substance that can dissolve in a under specified conditions. Soluble means able to dissolve; insoluble means only very slightly soluble in that .

Read explanation · OpenStax ↗
Solute

A dissolved component of a .

Read explanation · OpenStax ↗
Solution

A homogeneous mixture in which are dissolved in a .

Read explanation · OpenStax ↗
Solvent

The component of a that dissolves other substances, usually the component present in the greatest amount.

Read explanation · OpenStax ↗
spatial vector ·

Quantity with both magnitude and direction, combined by adding components.

Read explanation · OpenStax ↗
Stationary phase

The material that remains fixed in a system.

Read explanation · Waters ↗
Substrate

A that an binds and chemically transforms.

Read explanation · OpenStax ↗
Substrate concentration

The amount of per volume. Square brackets denote ; [S] is varied to measure an curve.

Read explanation · Biology LibreTexts ↗
Template strand · · ·

A preexisting strand whose sequence guides complementary nucleic- synthesis.

Read explanation · OpenStax ↗
Thermodynamics ·

The study of energy, , and . It helps determine whether a process is favorable, while concerns how fast it occurs.

Read explanation · OpenStax ↗
Thiol group · · · ·

A sulfur bonded to hydrogen, –SH. thiols can form through .

Read explanation · OpenStax ↗
Thymine

A normally used in ; it pairs with through two .

Read explanation · OpenStax ↗
Transcription

Synthesis of using a template.

Read explanation · OpenStax ↗
transition metal

Element associated with a partly occupied d subshell in its or common .

Read explanation · OpenStax ↗
Transition state

A fleeting, high-energy arrangement at a barrier. It is an energy maximum along the path, rather than a stable .

Read explanation · OpenStax ↗
Translation ·

Synthesis of a on a using the sequence of in .

Read explanation · OpenStax ↗
Tryptophan ·

An with a bulky ; commonly grouped as .

Read explanation · OpenStax ↗
Tumor · ·

An abnormal mass of tissue; tumors can be benign or malignant.

Read explanation · OpenStax ↗
Turnover number · · ·

The maximum number of cycles per per unit time, calculated as /. Units are inverse time, commonly s⁻¹.

Read explanation · IUBMB ↗
Tyrosine ·

An with a phenolic . Usually uncharged near physiological .

Read explanation · OpenStax ↗
Uracil

A normally used in in place of . Uracil produced by in is a repair target.

Read explanation · OpenStax ↗
wave intensity ·

crossing unit area, measured in W/m².

Read explanation · OpenStax ↗

6.5 Periodic Variations in Element Properties

OpenStax · 6.5 Periodic Variations in Element Properties ↗
Instructional page including learning objectives, examples, figures, source tables and questions. Site navigation and embedded media players are omitted; source media links remain available.

Learning Objectives

By the end of this section, you will be able to:

The in groups (vertical columns) of the periodic table exhibit similar chemical behavior. This similarity occurs because the members of a group have the same number and distribution of in their valence shells. However, there are also other patterns in chemical properties on the periodic table. For example, as we move down a group, the metallic character of the increases. Oxygen, at the top of group 16 (6A), is a colorless gas; in the middle of the group, selenium is a semiconducting solid; and, toward the bottom, polonium is a silver-grey solid that conducts electricity.

As we go across a from left to right, we add a to the and an to the valence shell with each successive element. As we go down the in a group, the number of in the valence shell remains constant, but the principal quantum number increases by one each time. An understanding of the electronic structure of the allows us to examine some of the properties that govern their chemical behavior. These properties vary periodically as the electronic structure of the changes. They are (1) size (radius) of and , (2) energies, and (3) .

Link to Learning

Explore visualizations of the periodic trends discussed in this section (and many more trends). With just a few clicks, you can create three-dimensional versions of the periodic table showing atomic size or graphs of energies from all measured .

Variation in Covalent Radius

The quantum mechanical picture makes it difficult to establish a definite size of an . However, there are several practical ways to define the radius of and, thus, to determine their relative sizes that give roughly similar values. We will use the covalent radius (Figure 6.30), which is defined as one-half the distance between the of two identical when they are joined by a (this measurement is possible because within still retain much of their atomic identity). We know that as we scan down a group, the principal quantum number, n, increases by one for each element. Thus, the are being added to a region of space that is increasingly distant from the . Consequently, the size of the (and its covalent radius) must increase as we increase the distance of the outermost from the . This trend is illustrated for the covalent radii of the halogens in Table 6.2 and Figure 6.30. The trends for the entire periodic table can be seen in Figure 6.30.

Covalent Radii of the Group
Covalent radius (pm)
F 64 +9
Cl 99 +17
Br 114 +35
I 133 +53
At 148 +85
Table 6.2
This figure has two parts: a and b. In figure a, four diatomic molecules are shown to illustrate the method of determining the atomic radius of an atom. The first model, in light green, is used to find the F atom radius. Two spheres are pushed very tightly together. The distance between the centers of the two atoms is indicated above the diagram with a double-headed arrow labeled “128 picometers (pm).” The end points of this arrow connect to line segments that extend to the atomic radii below. Beneath the molecule is the label, “F radius equals 128 pm divided by 2 equals 64 pm.” The next three models are similarly used to show the atomic radii of additional atoms. The second diatomic molecule is in a darker shade of green. The distance between the radii is 198 pm. Beneath the molecule is the label, “Cl radius equals 198 pm divided by 2 equals 99 pm.” The third diatomic molecule is in red. The distance between the radii is 228 pm. Beneath the molecule is the label, “Br radius equals 228 pm divided by 2 equals 114 pm.” The fourth diatomic molecule is in purple. The distance between the radii is 266 pm. Beneath the molecule is the label, “I radius equals 266 pm divided by 2 equals 133 pm.” In figure b, a periodic table layout is used to compare relative sizes of atoms, using green spheres. No spheres are provided for the noble or inert gas—group 18 elements. General trends noted are increasing circle size moving from top to bottom in a group, with a general tendency toward increasing atomic radii toward the lower left corner of the periodic table.
Figure 6.30 — 6.5 Periodic Variations in Element Properties

Figure 6.30 (a) The radius of an atom is defined as one-half the distance between the nuclei in a molecule consisting of two identical atoms joined by a covalent bond. The atomic radius for the halogens increases down the group as n increases. (b) Covalent radii of the elements are shown to scale. The general trend is that radii increase down a group and decrease across a period.

Paul Flowers, Klaus Theopold, Richard Langley, and William R. Robinson, Chemistry 2E, OpenStax. · CC BY-NC-SA 4.0 · Original image ↗ · Access for free ↗
This graph entitled, “Atomic Radii,” is labeled, “Atomic Number,” on the horizontal axis and, “Radius (p m),” on the vertical axis. Markings are provided every 10 units up to 60 on the horizontal axis beginning at zero. Vertical lines extend from the horizontal axis upward at each of these markings. The vertical axis begins at 0 and increases by 50’s up to 300. Horizontal lines are drawn across the graph at multiples of 50. A black jagged line connects the radii values for elements with atomic numbers 1 through 60 on the graph. Peaks are evident at the locations of the alkali metals: L i, N a, K, R b, and C s, at which points on the graph purple dots are placed and elements are labeled in purple. Similarly, minima exist at the locations of noble or inert gases: H e, N e, A r, K r, X e, and R n, at which points blue dots are placed and element symbols are provided in blue. The locations of period 4 and period 5 transition elements are provided with green dots. These points are clustered together in two locations on the graph which are circled in red and labeled accordingly. The green dots for the transition elements along with the line that connects them form a U shape on the graph within each of the red circles drawn. The atomic radii for the alkali metals in picometers are: L i 167, N a 190, K 243, R b 265, and C s 298. The atomic radii of the noble or inert gases included in the graph in picometers are: H e 31, N e 38, A r 71, K r 88, and X e 108.
Figure 6.31 — 6.5 Periodic Variations in Element Properties

Figure 6.31 Within each period, the trend in atomic radius decreases as Z increases; for example, from K to Kr. Within each group (e.g., the alkali metals shown in purple), the trend is that atomic radius increases as Z increases.

Paul Flowers, Klaus Theopold, Richard Langley, and William R. Robinson, Chemistry 2E, OpenStax. · CC BY-NC-SA 4.0 · Original image ↗ · Access for free ↗

As shown in Figure 6.31, as we move across a from left to right, we generally find that each element has a smaller covalent radius than the element preceding it. This might seem counterintuitive because it implies that with more have a smaller atomic radius. This can be explained with the concept of , Zeff. This is the pull exerted on a specific by the , taking into account any – repulsions. For hydrogen, there is only one and so the (Z) and the (Zeff) are equal. For all other , the inner partially shield the outer from the pull of the , and thus:

Zeff=Z−shielding

is determined by the probability of another being between the of interest and the , as well as by the – repulsions the of interest encounters. Core are adept at , while in the same valence shell do not block the attraction experienced by each other as efficiently. Thus, each time we move from one element to the next across a , Z increases by one, but the increases only slightly. Thus, Zeff increases as we move from left to right across a . The stronger pull (higher ) experienced by on the right side of the periodic table draws them closer to the , making the covalent radii smaller.

Thus, as we would expect, the outermost or valence are easiest to remove because they have the highest energies, are shielded more, and are farthest from the . As a general rule, when the representative form , they do so by the loss of the ns or np that were added last in the Aufbau process. The transition , on the other hand, lose the ns before they begin to lose the (n – 1)d , even though the ns are added first, according to the Aufbau principle.

Example 6.12

Sorting Atomic Radii

Predict the order of increasing covalent radius for Ge, Fl, Br, Kr.

Radius increases as we move down a group, so Ge < Fl (Note: Fl is the symbol for flerovium, element 114, NOT fluorine). Radius decreases as we move across a , so Kr < Br < Ge. Putting the trends together, we obtain Kr < Br < Ge < Fl.

Check Your Learning

Give an example of an whose size is smaller than fluorine.

Answer:

Ne or He

Variation in Ionic Radii

Ionic radius is the measure used to describe the size of an . A always has fewer and the same number of as the parent ; it is smaller than the from which it is derived (Figure 6.32). For example, the covalent radius of an aluminum (1s22s22p63s23p1) is 118 pm, whereas the ionic radius of an Al3+ (1s22s22p6) is 68 pm. As are removed from the outer valence shell, the remaining core occupying smaller shells experience a greater Zeff (as discussed) and are drawn even closer to the .

The figure includes spheres in green to represent the relative sizes of A l and S atoms. The relatively large A l sphere in the upper left is labeled 118. The significantly smaller S sphere in the upper right is labeled 104. Beneath each of these spheres is a red sphere. The red sphere in the lower left is very small in comparison to the other spheres and is labeled, “A l superscript 3 plus 68.” The red sphere in the lower right is significantly larger than the other spheres and is labeled, “S superscript 2 negative 170. “
Figure 6.32 — 6.5 Periodic Variations in Element Properties

Figure 6.32 The radius for a cation is smaller than the parent atom (Al), due to the lost electrons; the radius for an anion is larger than the parent (S), due to the gained electrons.

Paul Flowers, Klaus Theopold, Richard Langley, and William R. Robinson, Chemistry 2E, OpenStax. · CC BY-NC-SA 4.0 · Original image ↗ · Access for free ↗

with larger are smaller than with smaller (e.g., V2+ has an ionic radius of 79 pm, while that of V3+ is 64 pm). Proceeding down the groups of the periodic table, we find that of successive with the same generally have larger radii, corresponding to an increase in the principal quantum number, n.

An (negative ) is formed by the addition of one or more to the valence shell of an . This results in a greater repulsion among the and a decrease in Zeff per . Both effects (the increased number of and the decreased Zeff) cause the radius of an to be larger than that of the parent (Figure 6.32). For example, a sulfur ([Ne]3s23p4) has a covalent radius of 104 pm, whereas the ionic radius of the sulfide ([Ne]3s23p6) is 170 pm. For consecutive proceeding down any group, have larger principal quantum numbers and, thus, larger radii.

and that have the same are said to be . Examples of species are N3–, O2–, F–, Ne, Na+, Mg2+, and Al3+ (1s22s22p6). Another series is P3–, S2–, Cl–, Ar, K+, Ca2+, and Sc3+ ([Ne]3s23p6). For or that are , the number of determines the size. The greater the , the smaller the radius in a series of and .

Variation in Energies

The amount of energy required to remove the most loosely bound from a gaseous in its is called its first (IE1). The first for an element, X, is the energy required to form a with +1 :

X(g)⟶X+(g)+e−IE1

The energy required to remove the second most loosely bound is called the second (IE2).

X+(g)⟶X2+(g)+e−IE2

The energy required to remove the third is the third , and so on. Energy is always required to remove from or , so processes are and IE values are always positive. For larger , the most loosely bound is located farther from the and so is easier to remove. Thus, as size (atomic radius) increases, the should decrease. Relating this logic to what we have just learned about radii, we would expect first energies to decrease down a group and to increase across a .

Figure 6.33 graphs the relationship between the first and the of several . The values of first for the are given in Figure 6.34. Within a , the IE1 generally increases with increasing Z. Down a group, the IE1 value generally decreases with increasing Z. There are some systematic deviations from this trend, however. Note that the of boron ( 5) is less than that of beryllium ( 4) even though the of boron is greater by one . This can be explained because the energy of the subshells increases as l increases, due to penetration and (as discussed previously in this chapter). Within any one shell, the s are lower in energy than the p . This means that an s is harder to remove from an than a p in the same shell. The removed during the of beryllium ([He]2s2) is an s , whereas the removed during the of boron ([He]2s22p1) is a p ; this results in a lower first for boron, even though its is greater by one . Thus, we see a small deviation from the predicted trend occurring each time a new subshell begins.

This figure includes a graph labeled, “Atomic Number,” on the horizontal axis and, “Ionization Energy (k J divided by mol),” on the vertical axis. Markings are provided on the horizontal axis at 10, 18, 36, 54, and 86. Vertical lines extend from the horizontal axis upward at each of these values. The vertical axis begins at 0 and increases by 500’s up to 2500. Horizontal lines are drawn across the graph at multiples of 500. A red jagged line connects the ionization energies for elements with atomic numbers 1 through 86 on the graph. Peaks are evident at the locations of the noble or inert gases: H e, N e, A r, K r, X e, and R n. Similarly, minima exist at the locations of the alkali metals: L i, N a, K, R b, and C s. Elements labeled on the graph and their associated ionization energies are as follows: H 1310, H e 2370, L i 520, B e 900, B 800, C 1090, N 1400, O 1310, F 1680, N e 2080, N a 490, M g 730, P 1060, A r 1520, K 420, Z n 910, A s 960, B r 1140, K r 1350, R b 400, C d 870, X e 1170, T l 590, and R n 1030.
Figure 6.33 — 6.5 Periodic Variations in Element Properties

Figure 6.33 The first ionization energy of the elements in the first six periods are plotted against their atomic number.

Paul Flowers, Klaus Theopold, Richard Langley, and William R. Robinson, Chemistry 2E, OpenStax. · CC BY-NC-SA 4.0 · Original image ↗ · Access for free ↗
The figure includes a periodic table with the title, “First Ionization Energies of Some Elements (k J per mol).” The table identifies the row or period number at the left in purple, and group or column numbers in blue above each column. First ionization energies listed top to bottom for group 1 are: H 1310, L i 520, N a 490, K 420, R b 400, C s 380, and three dots are placed in the box for F r. In group 2 the values are: B e 900, M g 730, C a 590, S r 550, and B a 500. In group 3 the values are: S c 630, Y 620, and L a 540. In group 4, the values are: T i 660, Z r 660, H f 700. In group 5, the values are: V 650, N b 670, and T a 760. In group 6, the values are: C r 660, M o 680, and W 770. In group 7, the values are: M n 710, T c 700, and R e 760. In group 8, the values are: F e 760, R u 720, and O s 840. In group 9, the values are: C o 760, R h 720, and I r 890. In group 10, the values are: N i 730, P d 800, and P t 870. In group 11, the values are: C u 740, A g 730, and A u 890. In group 12, the values are: Z n 910, C d 870, and H g 1000. In group 13, the values are: B 800, A l 580, G a 580, I n 560, and T l 590. In group 14, the values are: C 1090, S i 780, G e 780, S n 700, and P b 710. In group 15, the values are: N 1400, P 1060, A s 960, S b 830, and B i 800. In group 16, the values are: O 1310, S 1000, S e 950, T e 870, and P o 810. In group 17, the values are: F 1680, C l 1250, B r 1140, I 1010, and A t has three dots. In group 18, the values listed are: B e 2370, N e 2080, A r 1520, K r 1350, X e 1170, and R n 1030.
Figure 6.34 — 6.5 Periodic Variations in Element Properties

Figure 6.34 This version of the periodic table shows the first ionization energy (IE 1 ), in kJ/mol, of selected elements.

Paul Flowers, Klaus Theopold, Richard Langley, and William R. Robinson, Chemistry 2E, OpenStax. · CC BY-NC-SA 4.0 · Original image ↗ · Access for free ↗

Another deviation occurs as orbitals become more than one-half filled. The first for oxygen is slightly less than that for nitrogen, despite the trend in increasing IE1 values across a . Looking at the diagram of oxygen, we can see that removing one will eliminate the – repulsion caused by pairing the in the 2p and will result in a half-filled (which is energetically favorable). Analogous changes occur in succeeding periods (note the dip for sulfur after phosphorus in Figure 6.34).

Removing an from a is more difficult than removing an from a because of the greater attraction to the . Likewise, removing an from a with a higher positive is more difficult than removing an from an with a lower . Thus, successive energies for one element always increase. As seen in Table 6.3, there is a large increase in the energies for each element. This jump corresponds to removal of the core , which are harder to remove than the valence . For example, Sc and Ga both have three valence , so the rapid increase in occurs after the third .

Successive Energies for Selected (/mol)
Element IE1 IE2 IE3 IE4 IE5 IE6 IE7
K 418.8 3051.8 4419.6 5876.9 7975.5 9590.6 11343
Ca 589.8 1145.4 4912.4 6490.6 8153.0 10495.7 12272.9
Sc 633.1 1235.0 2388.7 7090.6 8842.9 10679.0 13315.0
Ga 578.8 1979.4 2964.6 6180 8298.7 10873.9 13594.8
Ge 762.2 1537.5 3302.1 4410.6 9021.4 Not available Not available
As 944.5 1793.6 2735.5 4836.8 6042.9 12311.5 Not available
Table 6.3

Example 6.13

Ranking Energies

Predict the order of increasing energy for the following processes: IE1 for Al, IE1 for In, IE2 for Na, IE3 for Al.

Removing the 5p1 from In is easier than removing the 3p1 from Al because the higher n is farther from the , so IE1(In) < IE1(Al). the third from Al:(Al2+⟶Al3++e−) requires more energy because the Al2+ exerts a stronger pull on the than the Al , so IE1(Al) < IE3(Al). The second for sodium removes a core , which is a much higher energy process than removing valence . Putting this all together, we obtain: IE1(In) < IE1(Al) < IE3(Al) < IE2(Na).

Check Your Learning

Which has the lowest value for IE1: O, Po, Pb, or Ba?

Answer:

Ba

Variation in

The () is the energy change for the process of adding an to a gaseous to form an (negative ).

X(g)+e−⟶X−(g)EA1

This process can be either or exothermic, depending on the element. The of some of the is given in Figure 6.35. You can see that many of these have negative values of , which means that energy is released when the gaseous accepts an . However, for some , energy is required for the to become negatively and the value of their is positive. Just as with , subsequent values are associated with forming with more . The second is the energy associated with adding an to an to form a –2 , and so on.

As we might predict, it becomes easier to add an across a series of as the of the increases. We find, as we go from left to right across a , EAs tend to become more negative. The exceptions found among the of group 2 (2A), group 15 (5A), and group 18 (8A) can be understood based on the electronic structure of these groups. The noble gases, group 18 (8A), have a completely filled shell and the incoming must be added to a higher n level, which is more difficult to do. Group 2 (2A) has a filled ns subshell, and so the next added goes into the higher energy np, so, again, the observed value is not as the trend would predict. Finally, group 15 (5A) has a half-filled np subshell and the next must be paired with an existing np . In all of these cases, the initial relative stability of the disrupts the trend in .

We also might expect the at the top of each group to have the most negative ; their first potentials suggest that these have the largest effective . However, as we move down a group, we see that the second element in the group most often has the most negative . This can be attributed to the small size of the n = 2 shell and the resulting large – repulsions. For example, chlorine, with an value of –348 /mol, has the most negative value of any element in the periodic table. The of fluorine is –322 /mol. When we add an to a fluorine to form a fluoride (F–), we add an to the n = 2 shell. The is attracted to the , but there is also significant repulsion from the other already present in this small valence shell. The chlorine has the same in the valence shell, but because the entering is going into the n = 3 shell, it occupies a considerably larger region of space and the – repulsions are reduced. The entering does not experience as much repulsion and the chlorine accepts an additional more readily, resulting in a more negative .

The figure includes a periodic table with the title, “Electron Affinity Values for Selected Elements (k J per mol).” The table identifies the row or period number at the left in purple, and group or column numbers in blue above each column. Electron affinity values for representative elements are indicated with values marked with asterisks identifying calculated values. The electron affinity values for group 1 (column 1) elements are provided with the element symbols in the table as follows: H negative 72, L i negative 60, N a negative 53, K negative 48, R b negative 46, and C s negative 45. In group 2, the values are: B e positive 240 asterisk, M g positive 230 asterisk, C a positive 150 asterisk, S r positive 160 asterisk, and B a positive 50 asterisk. In group 13, the values are: B negative 23, A l negative 44, G a negative 40 asterisk, I n negative 40 asterisk, and T l negative 50. In group 14, the values are: C negative 123, S i negative 120, G e negative 115, S n negative 121, and P b negative 101. In group 15 the values are: N 0, P negative 74, A s negative 7, S b negative 101, and B i negative 101. In group 16, the values are: O negative 141, S negative 20, S e negative 195, T e negative 190, and P o negative 170. In group 17, the values are: F negative 322, C l negative 348, B r negative 324, I negative 295, and A t negative 270 asterisk. In group 18, the values are: H e positive 20 asterisk, N e negative 30, A r positive 35 asterisk, K r positive 40 asterisk, X e positive 40 asterisk, and R n positive 40 asterisk.
Figure 6.35 — 6.5 Periodic Variations in Element Properties

Figure 6.35 This version of the periodic table displays the electron affinity values (in kJ/mol) for selected elements.

Paul Flowers, Klaus Theopold, Richard Langley, and William R. Robinson, Chemistry 2E, OpenStax. · CC BY-NC-SA 4.0 · Original image ↗ · Access for free ↗

The properties discussed in this section (size of and , , energies, and ) are central to understanding chemical reactivity. For example, because fluorine has an energetically favorable and a large energy barrier to (IE), it is much easier to form fluorine than . Metallic properties including conductivity and malleability (the ability to be formed into sheets) depend on having that can be removed easily. Thus, metallic character increases as we move down a group and decreases across a in the same trend observed for atomic size because it is easier to remove an that is farther away from the .

2.5 The Periodic Table

OpenStax · 2.5 The Periodic Table ↗

Instructional page including learning objectives, examples, figures, source tables and questions. Site navigation and embedded media players are omitted; source media links remain available.

Learning Objectives

By the end of this section, you will be able to:

  • State the periodic law and explain the organization of in the periodic table
  • Predict the general properties of based on their location within the periodic table
  • Identify metals, nonmetals, and metalloids by their properties and/or location on the periodic table

As early chemists worked to ores and discovered more , they realized that various could be grouped together by their similar chemical behaviors. One such grouping includes lithium (Li), sodium (Na), and potassium (K): These all are shiny, conduct heat and electricity well, and have similar chemical properties. A second grouping includes calcium (Ca), strontium (), and barium (Ba), which also are shiny, good conductors of heat and electricity, and have chemical properties in common. However, the specific properties of these two groupings are notably different from each other. For example: Li, Na, and K are much more reactive than are Ca, , and Ba; Li, Na, and K form with oxygen in a ratio of two of their to one oxygen , whereas Ca, , and Ba form with one of their to one oxygen . Fluorine (F), chlorine (Cl), bromine (Br), and iodine (I) also exhibit similar properties to each other, but these properties are drastically different from those of any of the above.

Dimitri Mendeleev in Russia (1869) and Lothar Meyer in Germany (1870) independently recognized that there was a periodic relationship among the properties of the known at that time. Both published tables with the arranged according to increasing atomic mass. But Mendeleev went one step further than Meyer: He used table to predict the existence of that would have the properties similar to aluminum and silicon, but were yet unknown. The discoveries of gallium (1875) and germanium (1886) provided great support for Mendeleev’s . Although Mendeleev and Meyer had a long dispute over priority, Mendeleev’s contributions to the development of the periodic table are now more widely recognized (Figure 2.25).

Figure A shows a photograph of Dimitri Mendeleev. Figure B shows the first periodic table developed by Mendeleev, which had eight groups and twelve periods. In the first group (—, R superscript plus sign 0) is the following information: H = 1, L i = 7, N a = 23, K = 39, (C u = 63), R b = 85, (A g = 108), C a = 183, (—),—, (A u = 199) —. Note that each of these entries corresponds to one of the twelve periods respectively. The second group (—, R 0) contains the following information: (not entry for period 1) B o = 9, 4, M g = 24, C a = 40, Z n = 65, S r = 87, C d = 112, B a = 187, —, —, H g = 200, —. Note the ach of these entries corresponds to one of the twelve periods respectively. Group three (—, R superscript one 0 superscript nine) contains the information: (no entry for period 1), B = 11, A l = 27, 8. — = 44, — = 68, ? Y t = 88, I n = 113, ? D I = 138, —, ? E r = 178, T l = 204, —. Note that each of these entries corresponds to one of the twelve periods respectively. Group four (RH superscript four, R0 superscript eight) contains the following information: (no entry for period 1), C = 12, B i = 28, T i = 48, — = 72, Z r = 90, S n = 118, ? C o = 140, ? L a = 180, P b = 207, T h = 231. Note that each of these entries corresponds to one of the twelve periods respectively. Group five (R H superscript two, R superscript two 0 superscript five) contains the following information: (no entry for period 1), N = 14, P = 31, V = 51, A s = 75, N b = 94, S b = 122, —, —, T a = 182, B l = 208, —. Note that each of these entries corresponds to one of the twelve periods respectively. Group six (R H superscript two, R 0 superscript three) contains the following information: (no entry for period 1), O = 16, S = 32, C r = 52, S o = 78, M o = 96, T o = 125, —, —, W = 184, —, U = 240. Note that each of these entries corresponds to one of the twelve periods respectively. Group seven (R H , R superscript plus sing, 0 superscript 7) contains the following information: (no entry for period 1), F = 19, C l = 35, 5, M n = 55, B r = 80, — = 100, J = 127, —, —, —, —, —. Note that each of these entries corresponds to one of the twelve periods respectively. Group 8 (—, R 0 superscript four) contains the following information: (no entry for periods 1, 2, 3), in period 4: F o = 56, C o = 59, N i = 59, C u = 63, no entry for period five, in period 6: R u = 104, R h = 104, P d = 106, A g = 108, no entries for periods 7, 8 , or 9, in period 10: O s = 195, I r = 197, P t = 198, A u = 199, no entries for periods 11 or 12.
Figure 2.25 — 2.5 The Periodic Table

Figure 2.25 (a) Dimitri Mendeleev is widely credited with creating (b) the first periodic table of the elements. (credit a: modification of work by Serge Lachinov; credit b: modification of work by “Den fjättrade ankan”/Wikimedia Commons)

Paul Flowers, Klaus Theopold, Richard Langley, and William R. Robinson, Chemistry 2E, OpenStax. (credit a: modification of work by Serge Lachinov; credit b: modification of work by “Den fjättrade ankan”/Wikimedia Commons) · CC BY-NC-SA 4.0 · Original image ↗ · Access for free ↗

By the twentieth century, it became apparent that the periodic relationship involved atomic numbers rather than atomic masses. The modern statement of this relationship, the periodic law, is as follows: the properties of the are periodic functions of their atomic numbers. A modern periodic table arranges the in increasing order of their atomic numbers and groups with similar properties in the same vertical column (Figure 2.26). Each box represents an element and contains its , symbol, average atomic mass, and (sometimes) name. The are arranged in seven horizontal rows, called periods or series, and 18 vertical columns, called groups. Groups are labeled at the top of each column. In the United States, the labels traditionally were Roman numerals with capital letters. However, IUPAC recommends that the numbers 1 through 18 be used, and these labels are more common. For the table to fit on a single , parts of two of the rows, a total of 14 columns, are usually written below the main body of the table.

The Periodic Table of Elements is shown. The 18 columns are labeled “Group” and the 7 rows are labeled “Period.” Below the table to the right is a box labeled “Color Code” with different colors for metals, metalloids, and nonmetals, as well as solids, liquids, and gases. To the left of this box is an enlarged picture of the upper-left most box on the table. The number 1 is in its upper-left hand corner and is labeled “Atomic number.” The letter “H” is in the middle in red indicating that it is a gas. It is labeled “Symbol.” Below that is the number 1.008 which is labeled “Atomic Mass.” Below that is the word hydrogen which is labeled “name.” The color of the box indicates that it is a nonmetal. Each element will be described in this order: atomic number; name; symbol; whether it is a metal, metalloid, or nonmetal; whether it is a solid, liquid, or gas; and atomic mass. Beginning at the top left of the table, or period 1, group 1, is a box containing “1; hydrogen; H; nonmetal; gas; and 1.008.” There is only one other element box in period 1, group 18, which contains “2; helium; H e; nonmetal; gas; and 4.003.” Period 2, group 1 contains “3; lithium; L i; metal; solid; and 6.94” Group 2 contains “4; beryllium; B e; metal; solid; and 9.012.” Groups 3 through 12 are skipped and group 13 contains “5; boron; B; metalloid; solid; 10.81.” Group 14 contains “6; carbon; C; nonmetal; solid; and 12.01.” Group 15 contains “7; nitrogen; N; nonmetal; gas; and 14.01.” Group 16 contains “8; oxygen; O; nonmetal; gas; and 16.00.” Group 17 contains “9; fluorine; F; nonmetal; gas; and 19.00.” Group 18 contains “10; neon; N e; nonmetal; gas; and 20.18.” Period 3, group 1 contains “11; sodium; N a; metal; solid; and 22.99.” Group 2 contains “12; magnesium; M g; metal; solid; and 24.31.” Groups 3 through 12 are skipped again in period 3 and group 13 contains “13; aluminum; A l; metal; solid; and 26.98.” Group 14 contains “14; silicon; S i; metalloid; solid; and 28.09.” Group 15 contains “15; phosphorous; P; nonmetal; solid; and 30.97.” Group 16 contains “16; sulfur; S; nonmetal; solid; and 32.06.” Group 17 contains “17; chlorine; C l; nonmetal; gas; and 35.45.” Group 18 contains “18; argon; A r; nonmetal; gas; and 39.95.” Period 4, group 1 contains “19; potassium; K; metal; solid; and 39.10.” Group 2 contains “20; calcium; C a; metal; solid; and 40.08.” Group 3 contains “21; scandium; S c; metal; solid; and 44.96.” Group 4 contains “22; titanium; T i; metal; solid; and 47.87.” Group 5 contains “23; vanadium; V; metal; solid; and 50.94.” Group 6 contains “24; chromium; C r; metal; solid; and 52.00.” Group 7 contains “25; manganese; M n; metal; solid; and 54.94.” Group 8 contains “26; iron; F e; metal; solid; and 55.85.” Group 9 contains “27; cobalt; C o; metal; solid; and 58.93.” Group 10 contains “28; nickel; N i; metal; solid; and 58.69.” Group 11 contains “29; copper; C u; metal; solid; and 63.55.” Group 12 contains “30; zinc; Z n; metal; solid; and 65.38.” Group 13 contains “31; gallium; G a; metal; solid; and 69.72.” Group 14 contains “32; germanium; G e; metalloid; solid; and 72.63.” Group 15 contains “33; arsenic; A s; metalloid; solid; and 74.92.” Group 16 contains “34; selenium; S e; nonmetal; solid; and 78.97.” Group 17 contains “35; bromine; B r; nonmetal; liquid; and 79.90.” Group 18 contains “36; krypton; K r; nonmetal; gas; and 83.80.” Period 5, group 1 contains “37; rubidium; R b; metal; solid; and 85.47.” Group 2 contains “38; strontium; S r; metal; solid; and 87.62.” Group 3 contains “39; yttrium; Y; metal; solid; and 88.91.” Group 4 contains “40; zirconium; Z r; metal; solid; and 91.22.” Group 5 contains “41; niobium; N b; metal; solid; and 92.91.” Group 6 contains “42; molybdenum; M o; metal; solid; and 95.95.” Group 7 contains “43; technetium; T c; metal; solid; and 97.” Group 8 contains “44; ruthenium; R u; metal; solid; and 101.1.” Group 9 contains “45; rhodium; R h; metal; solid; and 102.9.” Group 10 contains “46; palladium; P d; metal; solid; and 106.4.” Group 11 contains “47; silver; A g; metal; solid; and 107.9.” Group 12 contains “48; cadmium; C d; metal; solid; and 112.4.” Group 13 contains “49; indium; I n; metal; solid; and 114.8.” Group 14 contains “50; tin; S n; metal; solid; and 118.7.” Group 15 contains “51; antimony; S b; metalloid; solid; and 121.8.” Group 16 contains “52; tellurium; T e; metalloid; solid; and 127.6.” Group 17 contains “53; iodine; I; nonmetal; solid; and 126.9.” Group 18 contains “54; xenon; X e; nonmetal; gas; and 131.3.” Period 6, group 1 contains “55; cesium; C s; metal; solid; and 132.9.” Group 2 contains “56; barium; B a; metal; solid; and 137.3.” Group 3 breaks the pattern. The box has a large arrow pointing to a row of elements below the table with atomic numbers ranging from 57-71. In sequential order by atomic number, the first box in this row contains “57; lanthanum; L a; metal; solid; and 138.9.” To its right, the next is “58; cerium; C e; metal; solid; and 140.1.” Next is “59; praseodymium; P r; metal; solid; and 140.9.” Next is “60; neodymium; N d; metal; solid; and 144.2.” Next is “61; promethium; P m; metal; solid; and 145.” Next is “62; samarium; S m; metal; solid; and 150.4.” Next is “63; europium; E u; metal; solid; and 152.0.” Next is “64; gadolinium; G d; metal; solid; and 157.3.” Next is “65; terbium; T b; metal; solid; and 158.9.” Next is “66; dysprosium; D y; metal; solid; and 162.5.” Next is “67; holmium; H o; metal; solid; and 164.9.” Next is “68; erbium; E r; metal; solid; and 167.3.” Next is “69; thulium; T m; metal; solid; and 168.9.” Next is “70; ytterbium; Y b; metal; solid; and 173.1.” The last in this special row is “71; lutetium; L u; metal; solid; and 175.0.” Continuing in period 6, group 4 contains “72; hafnium; H f; metal; solid; and 178.5.” Group 5 contains “73; tantalum; T a; metal; solid; and 180.9.” Group 6 contains “74; tungsten; W; metal; solid; and 183.8.” Group 7 contains “75; rhenium; R e; metal; solid; and 186.2.” Group 8 contains “76; osmium; O s; metal; solid; and 190.2.” Group 9 contains “77; iridium; I r; metal; solid; and 192.2.” Group 10 contains “78; platinum; P t; metal; solid; and 195.1.” Group 11 contains “79; gold; A u; metal; solid; and 197.0.” Group 12 contains “80; mercury; H g; metal; liquid; and 200.6.” Group 13 contains “81; thallium; T l; metal; solid; and 204.4.” Group 14 contains “82; lead; P b; metal; solid; and 207.2.” Group 15 contains “83; bismuth; B i; metal; solid; and 209.0.” Group 16 contains “84; polonium; P o; metal; solid; and 209.” Group 17 contains “85; astatine; A t; metalloid; solid; and 210.” Group 18 contains “86; radon; R n; nonmetal; gas; and 222.” Period 7, group 1 contains “87; francium; F r; metal; solid; and 223.” Group 2 contains “88; radium; R a; metal; solid; and 226.” Group 3 breaks the pattern much like what occurs in period 6. A large arrow points from the box in period 7, group 3 to a special row containing the elements with atomic numbers ranging from 89-103, just below the row which contains atomic numbers 57-71. In sequential order by atomic number, the first box in this row contains “89; actinium; A c; metal; solid; and 227.” To its right, the next is “90; thorium; T h; metal; solid; and 232.0.” Next is “91; protactinium; P a; metal; solid; and 231.0.” Next is “92; uranium; U; metal; solid; and 238.0.” Next is “93; neptunium; N p; metal; solid; and N p.” Next is “94; plutonium; P u; metal; solid; and 244.” Next is “95; americium; A m; metal; solid; and 243.” Next is “96; curium; C m; metal; solid; and 247.” Next is “97; berkelium; B k; metal; solid; and 247.” Next is “98; californium; C f; metal; solid; and 251.” Next is “99; einsteinium; E s; metal; solid; and 252.” Next is “100; fermium; F m; metal; solid; and 257.” Next is “101; mendelevium; M d; metal; solid; and 258.” Next is “102; nobelium; N o; metal; solid; and 259.” The last in this special row is “103; lawrencium; L r; metal; solid; and 262.” Continuing in period 7, group 4 contains “104; rutherfordium; R f; metal; solid; and 267.” Group 5 contains “105; dubnium; D b; metal; solid; and 270.” Group 6 contains “106; seaborgium; S g; metal; solid; and 271.” Group 7 contains “107; bohrium; B h; metal; solid; and 270.” Group 8 contains “108; hassium; H s; metal; solid; and 277.” Group 9 contains “109; meitnerium; M t; not indicated; solid; and 276.” Group 10 contains “110; darmstadtium; D s; not indicated; solid; and 281.” Group 11 contains “111; roentgenium; R g; not indicated; solid; and 282.” Group 12 contains “112; copernicium; C n; metal; liquid; and 285.” Group 13 contains “113; ununtrium; U u t; not indicated; solid; and 285.” Group 14 contains “114; flerovium; F l; not indicated; solid; and 289.” Group 15 contains “115; ununpentium; U u p; not indicated; solid; and 288.” Group 16 contains “116; livermorium; L v; not indicated; solid; and 293.” Group 17 contains “117; ununseptium; U u s; not indicated; solid; and 294.” Group 18 contains “118; ununoctium; U u o; not indicated; solid; and 294.”
Figure 2.26 — 2.5 The Periodic Table

Figure 2.26 Elements in the periodic table are organized according to their properties.

Paul Flowers, Klaus Theopold, Richard Langley, and William R. Robinson, Chemistry 2E, OpenStax. · CC BY-NC-SA 4.0 · Original image ↗ · Access for free ↗

Even after the periodic nature of and the table itself were widely accepted, gaps remained. Mendeleev had predicted, and others including Henry Moseley had later confirmed, that there should be below Manganese in Group 7. German chemists Ida Tacke and Walter Noddack set out to find the , a quest being pursued by scientists around the world. Their method was unique in that they did not only consider the properties of manganese, but also the horizontally adjacent to the missing 43 and 75 on the table. Thus, by investigating ores containing minerals of ruthenium (Ru), tungsten (W), osmium (Os), and so on, they were able to identify naturally occurring that helped complete the table. Rhenium, one of their discoveries, was one of the last natural to be discovered and is the last stable element to be discovered. (Francium, the last natural element to be discovered, was identified by Marguerite Perey in 1939.)

Many differ dramatically in their chemical and physical properties, but some are similar in their behaviors. For example, many appear shiny, are malleable (able to be deformed without breaking) and ductile (can be drawn into wires), and conduct heat and electricity well. Other are not shiny, malleable, or ductile, and are poor conductors of heat and electricity. We can sort the into large classes with common properties: metals ( that are shiny, malleable, good conductors of heat and electricity—shaded yellow); nonmetals ( that appear dull, poor conductors of heat and electricity—shaded green); and metalloids ( that conduct heat and electricity moderately well, and possess some properties of metals and some properties of nonmetals—shaded purple).

The can also be classified into the main-group (or representative ) in the columns labeled 1, 2, and 13–18; the transition metals in the columns labeled 3–122; and inner transition metals in the two rows at the bottom of the table (the top-row are called lanthanides and the bottom-row are actinides; Figure 2.27). The can be subdivided further by more specific properties, such as the composition of the they form. For example, the in group 1 (the first column) form that consist of one of the element and one of hydrogen. These (except hydrogen) are known as alkali metals, and they all have similar chemical properties. The in group 2 (the second column) form consisting of one of the element and two of hydrogen: These are called earth metals, with similar properties among members of that group. Other groups with specific names are the pnictogens (group 15), chalcogens (group 16), halogens (group 17), and the noble gases (group 18, also known as inert gases). The groups can also be referred to by the first element of the group: For example, the chalcogens can be called the oxygen group or oxygen family. Hydrogen is a unique, nonmetallic element with properties similar to both group 1 and group 17 . For that reason, hydrogen may be shown at the top of both groups, or by itself.

This diagram combines the groups and periods of the periodic table based on their similar properties. Group 1 contains the alkali metals, group 2 contains the earth alkaline metals, group 15 contains the pnictogens, group 16 contains the chalcogens, group 17 contains the halogens and group 18 contains the noble gases. The main group elements consist of groups 1, 2, and 12 through 18. Therefore, most of the transition metals, which are contained in groups 3 through 11, are not main group elements. The lanthanides and actinides are called out at the bottom of the periodic table.
Figure 2.27 — 2.5 The Periodic Table
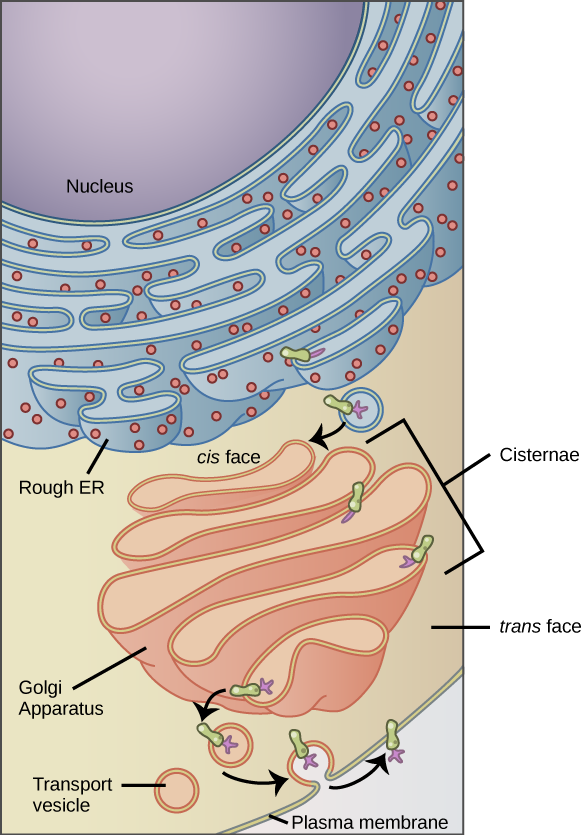
Figure 2.27 The periodic table organizes elements with similar properties into groups.

Paul Flowers, Klaus Theopold, Richard Langley, and William R. Robinson, Chemistry 2E, OpenStax. · CC BY-NC-SA 4.0 · Original image ↗ · Access for free ↗

Link to Learning

Click on this link for an interactive periodic table, which you can use to explore the properties of the (includes podcasts and videos of each element). You may also want to try this one that shows photos of all the .

Example 2.7

Naming Groups of

of each of the following are essential for life. Give the group name for the following :

(a) chlorine

(b) calcium

(c) sodium

(d) sulfur

The family names are as follows:

(a)

(b) earth metal

(c)

(d) chalcogen

Check Your Learning

Give the group name for each of the following :

(a) krypton

(b) selenium

(c) barium

(d) lithium

Answer:

(a) noble gas; (b) chalcogen; (c) earth metal; (d)

As you will learn in your further study of chemistry, in groups often behave in a somewhat similar manner. This is partly due to the number of in their outer shell and their similar readiness to bond. These shared properties can have far-ranging implications in nature, science, and medicine. For example, when Gertrude Elion and George Hitchens were investigating ways to interrupt cell and virus to fight diseases, they utilized the similarity between sulfur and oxygen (both in Group 16) and their capacity to bond in similar ways. Elion focused on , which are key components of and which contain oxygen. She found that by introducing sulfur-based (called analogues) that mimic the structure of , within would bond to the analogues rather than the "regular" . With the normal bonding and structure altered, Elion successfully interrupted cell . At its core, the strategy worked because of the similarity between sulfur and oxygen. Her discovery led directly to important treatments for leukemia. Overall, Elion's with George Hitchens not only led to more treatments, but also changed the entire methodology of drug development. By using specific and to target specific aspects of cells, viruses, and , they laid the groundwork for many of today's most common and important medicines, used to help millions of people each year. They were awarded the Nobel Prize in 1988.


In studying the periodic table, you might have noticed something about the atomic masses of some of the . Element 43 (technetium), element 61 (promethium), and most of the with 84 (polonium) and higher have their atomic mass given in square brackets. This is done for that consist entirely of unstable, (you will learn more about radioactivity in the chemistry chapter). An average atomic weight cannot be determined for these because their radioisotopes may vary significantly in relative abundance, depending on the source, or may not even exist in nature. The number in square brackets is the atomic (an approximate atomic mass) of the most stable of that element.