Try before revealing the answer. A crude extract contains 100 mg protein and 500 units of activity. A fraction contains 10 mg protein and 200 units. Calculate yield and purification fold.
Worked answer
Initial specific activity = 500/100 = 5 units/mg. Final = 200/10 = 20 units/mg. Purification fold = 20/5 = 4. Activity yield = 200/500 = 40%. Protein mass recovery is 10%, a different measure from enzyme activity yield.
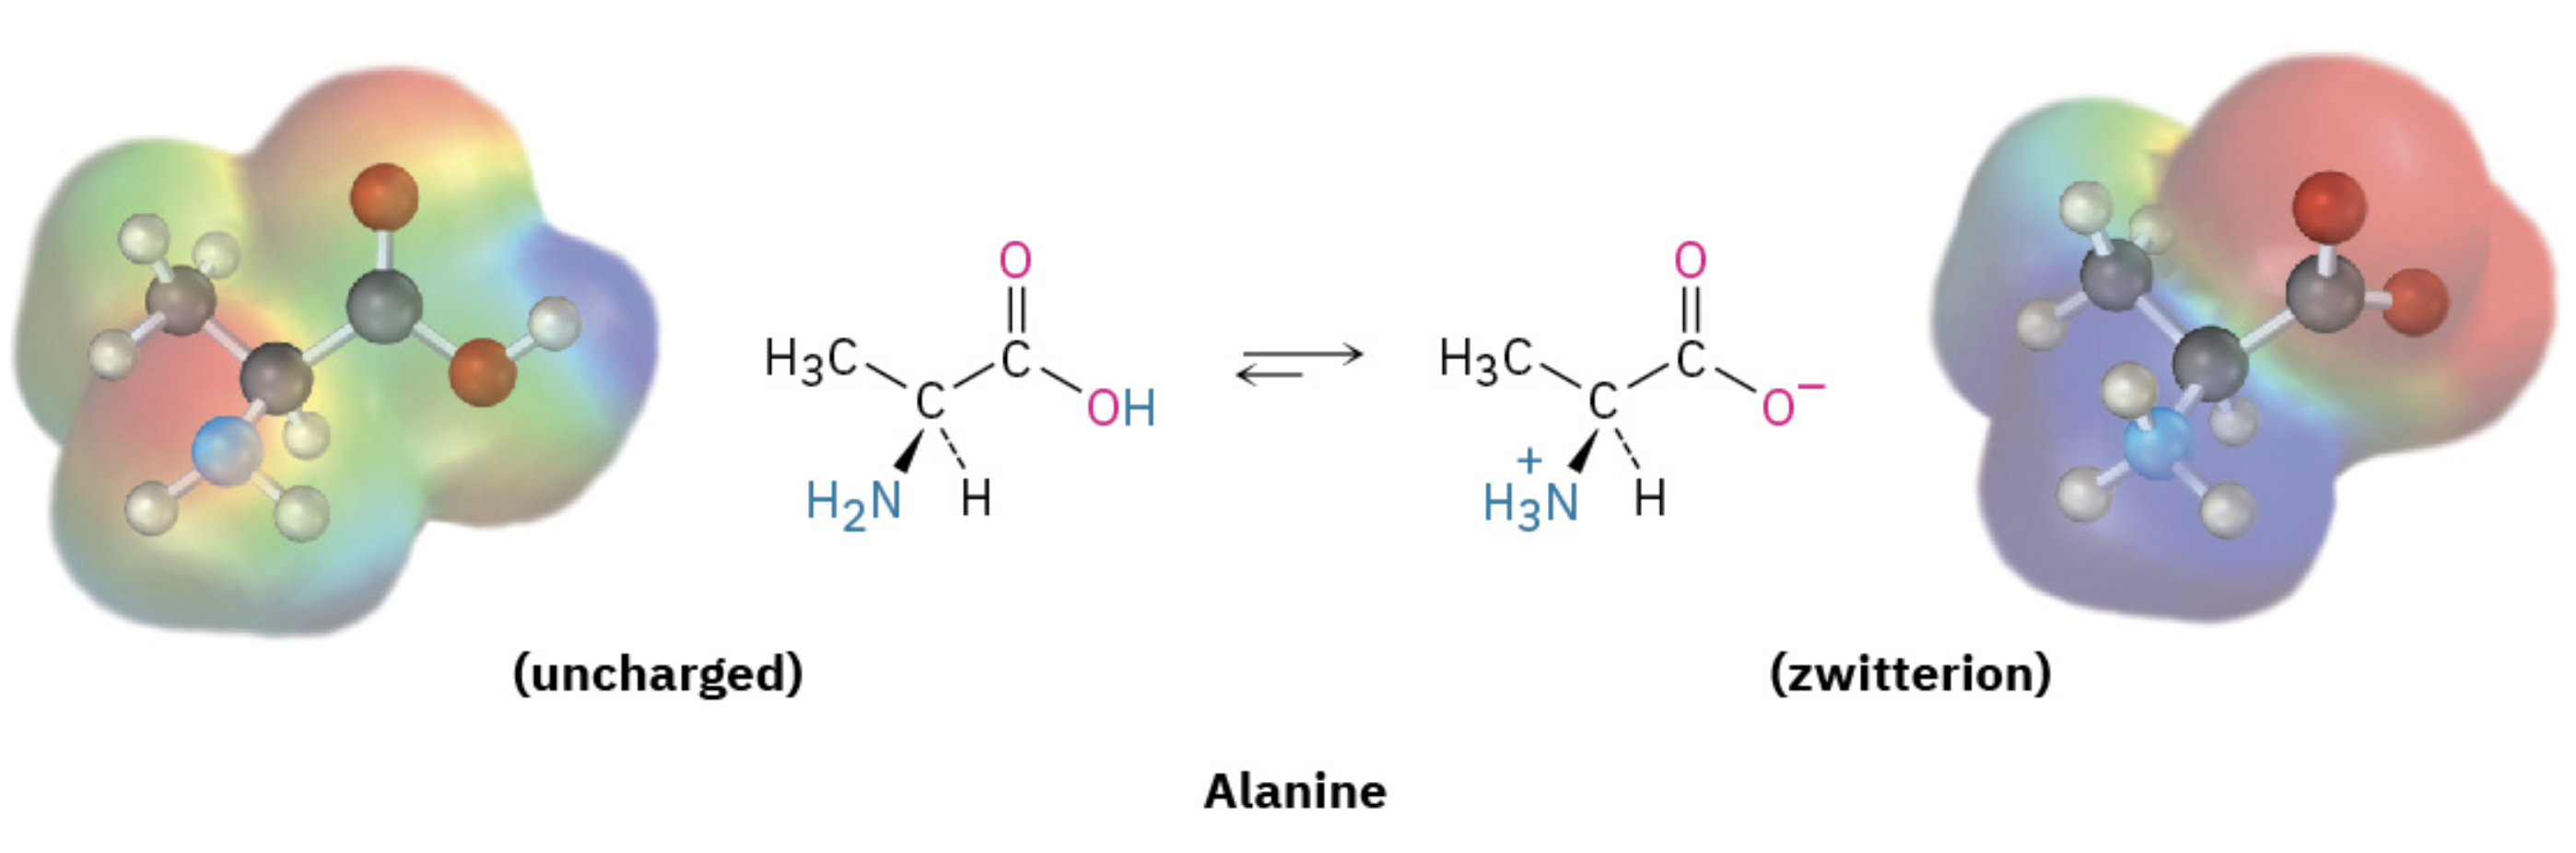
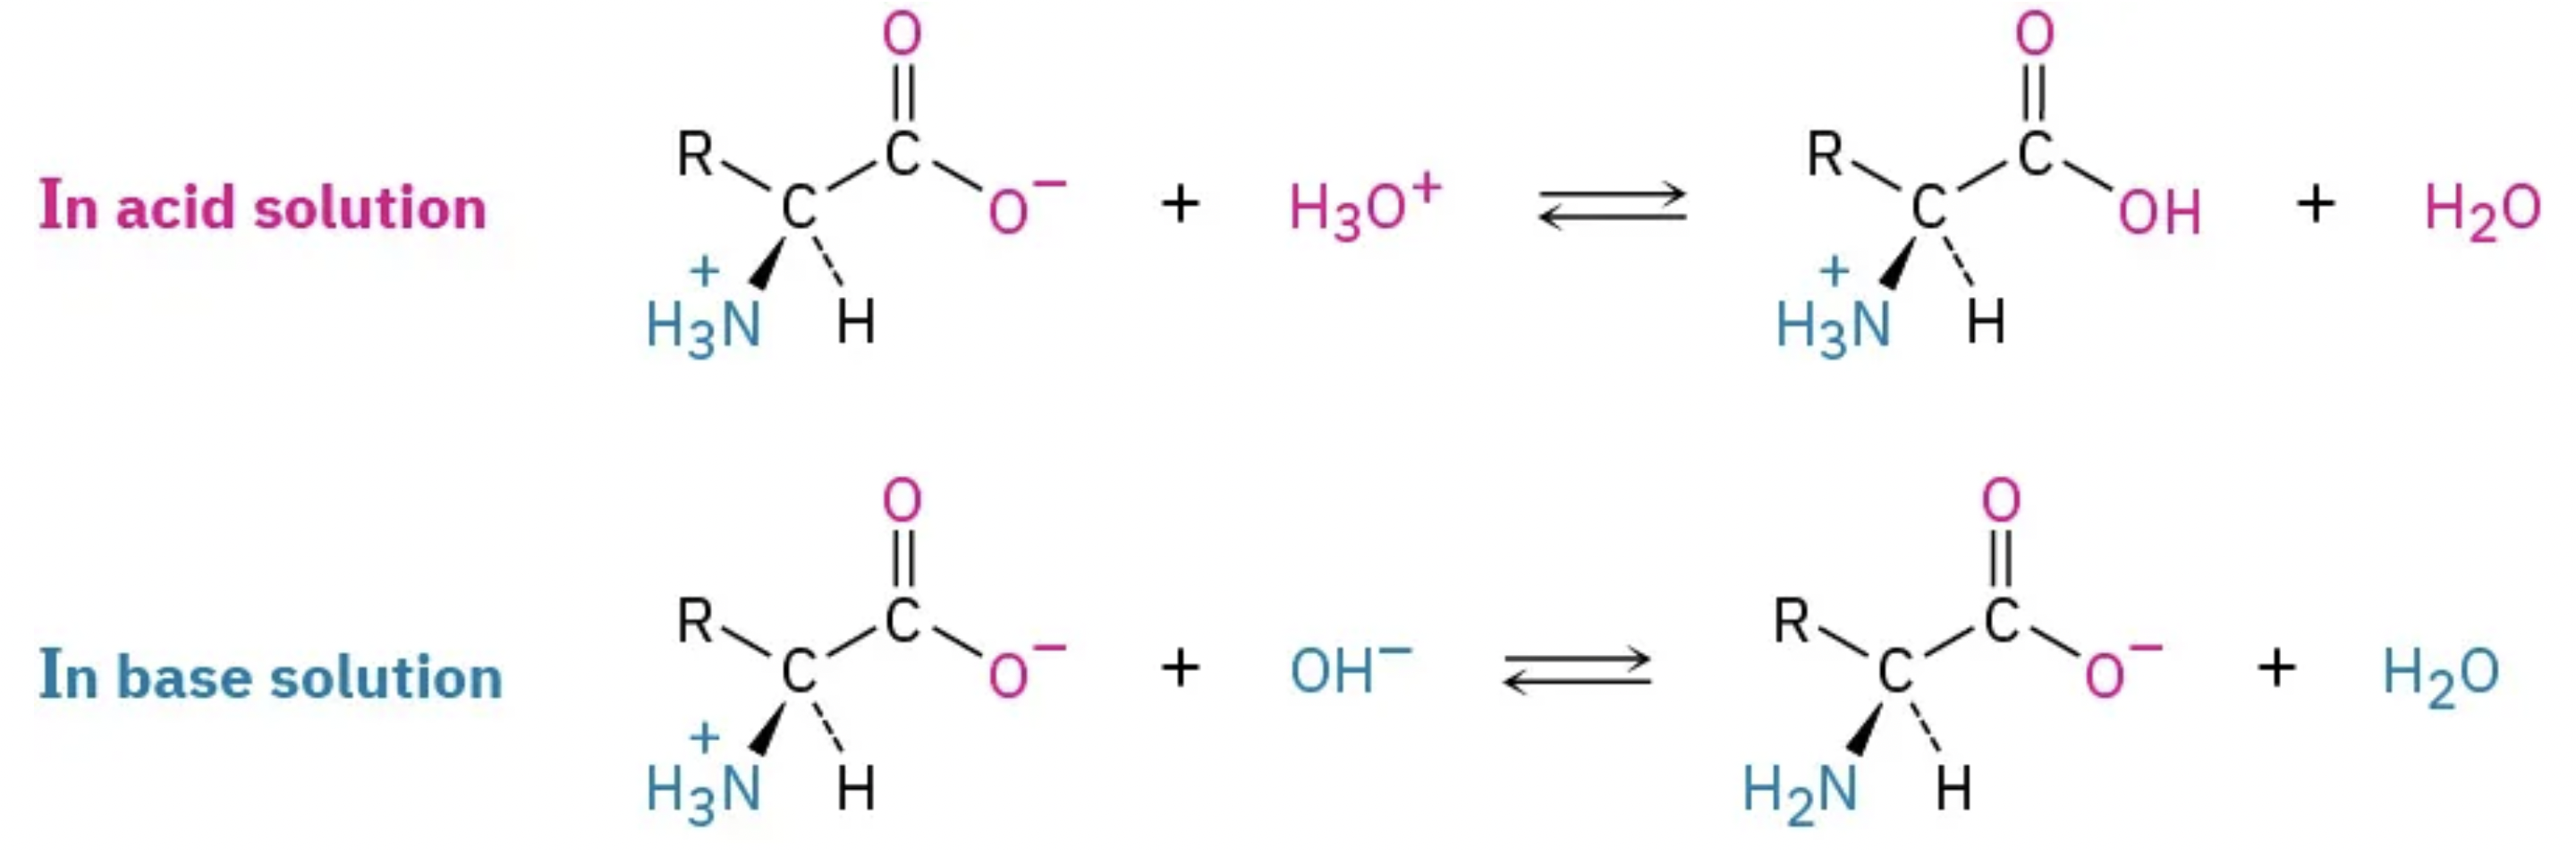
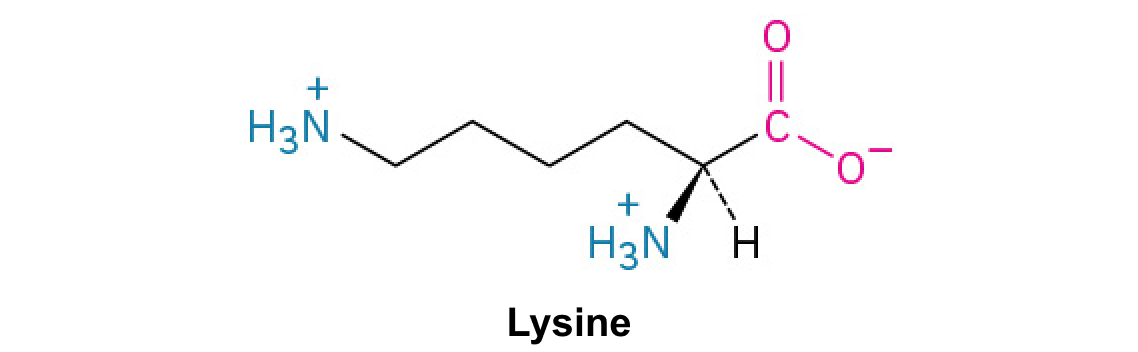
A nitrogen-containing functional group. A free amino acid’s amino group is typically protonated (NH₃⁺) near physiological pH; proline’s ring nitrogen is an exception to this formula.
Figure 15.4 This figure shows the genetic code for translating each nucleotide triplet in mRNA into an amino acid or a termination signal in a protein. (credit: modification of work by NIH)
An electrical property that can be positive or negative. Opposite charges attract and like charges repel; net charge is the sum of all charges on a particle.
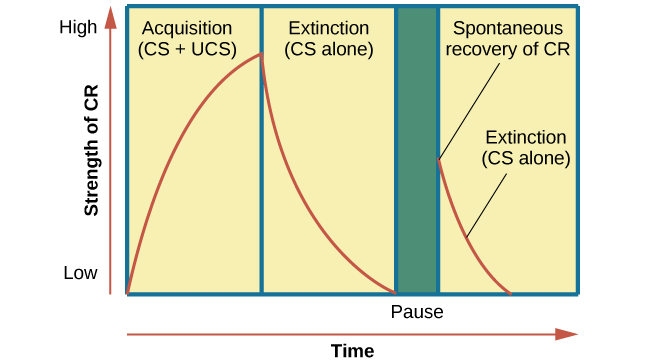
Figure 6.7 This is the curve of acquisition, extinction, and spontaneous recovery. The rising curve shows the conditioned response quickly getting stronger through the repeated pairing of the conditioned stimulus and the unconditioned stimulus (acquisition). Then the curve decreases, which shows how the conditioned response weakens when only the conditioned stimulus is presented (extinction). After a break or pause from conditioning, the conditioned response reappears (spontaneous recovery).
The exponent needed to obtain a number from a chosen fixed number. For decimal logarithms, log₁₀(100) = 2 because 10² = 100; pH uses the negative decimal logarithm of hydrogen ion activity.
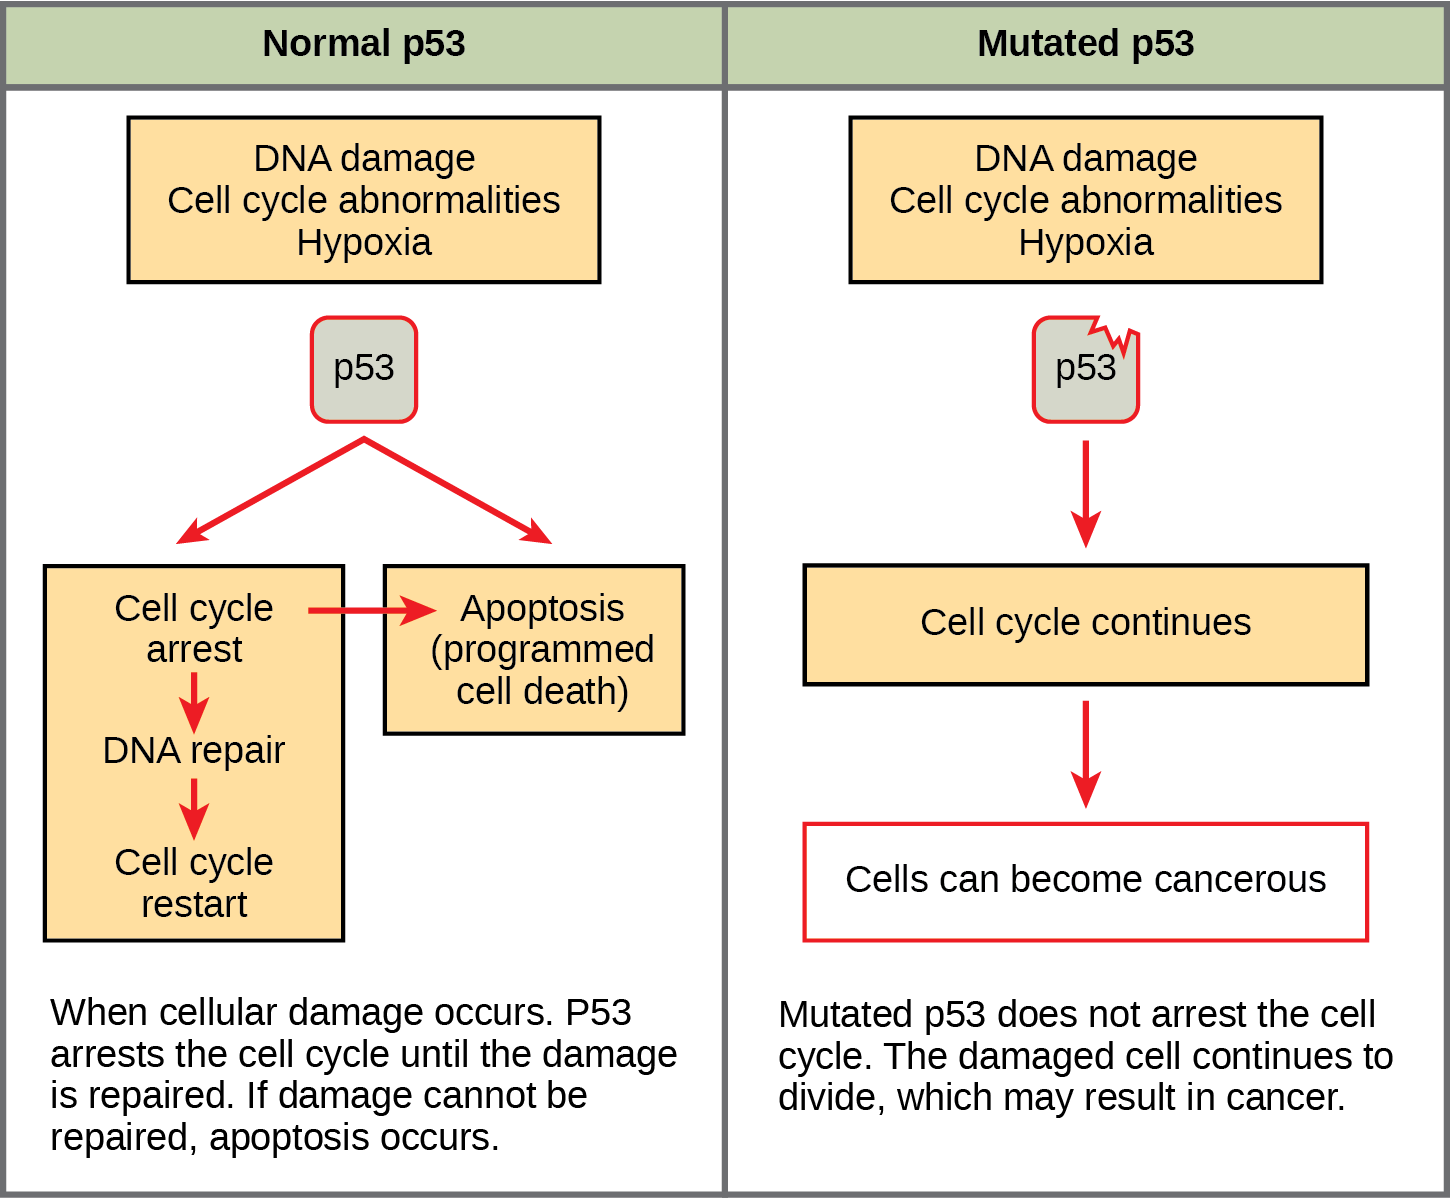
Figure 10.16 The role of normal p53 is to monitor DNA and the supply of oxygen (hypoxia is a condition of reduced oxygen supply). If damage is detected, p53 triggers repair mechanisms. If repairs are unsuccessful, p53 signals apoptosis. A cell with an abnormal p53 protein cannot repair damaged DNA and thus cannot signal apoptosis. Cells with abnormal p53 can become cancerous. (credit: modification of work by Thierry Soussi)
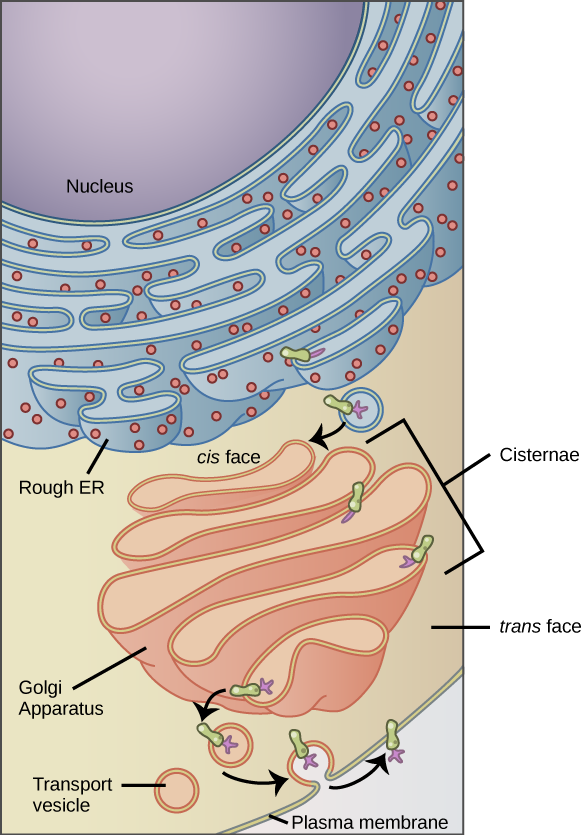
Figure 4.18 Membrane and secretory proteins are synthesized in the rough endoplasmic reticulum (RER). The RER also sometimes modifies proteins. In this illustration, a (green) integral membrane protein is modified by attachment of a (purple) carbohydrate in the ER. Vesicles with the integral protein bud from the ER and fuse with the Golgi apparatus' cis face. As the protein passes along the Golgi’s cisternae, the addition of more carbohydrates further modifies it. After its synthesis is complete, it exits as an integral membrane protein of the vesicle that buds from the Golgi’s trans face. When the vesicle fuses with the cell membrane, the protein becomes an integral portion of that cell membrane. (credit: modification of work by Magnus Manske)
A supporting material, such as a porous gel or the solid support in a chromatography column. Its properties influence movement and binding of sample molecules.
A thin boundary or sheet. Cell membranes are lipid bilayers containing proteins; blotting membranes are synthetic supports that hold proteins or nucleic acids for detection.
Figure 15.11 Eukaryotic pre-mRNA processing. In addition to 5’ Cap and 3’ Poly-A Tail addition, introns must be precisely removed and exons joined to generate a functional mRNA. Nucleotides upstream (towards the 5’cap) of the translation START codon are part of the 5’ untranslated region (5’ UTR). Nucleotides downstream (towards 3’end) of the STOP codon form the 3’ UTR. Both 5’ and 3’ UTRs are important for regulating translation initiation and mRNA stability. Credit: Rao, A., Ryan, K. Fletcher, S. and Tag, A. Department of Biology, Texas A&M University.
Rao, A., Ryan, K. Fletcher, S. and Tag, A. Department of Biology, Texas A&M University.; Mary Ann Clark, Matthew Douglas, and Jung Choi, Biology 2e, OpenStax. · CC BY-NC-SA 4.0
· Original image ↗ · Access for free ↗
Figure 4.18 Membrane and secretory proteins are synthesized in the rough endoplasmic reticulum (RER). The RER also sometimes modifies proteins. In this illustration, a (green) integral membrane protein is modified by attachment of a (purple) carbohydrate in the ER. Vesicles with the integral protein bud from the ER and fuse with the Golgi apparatus' cis face. As the protein passes along the Golgi’s cisternae, the addition of more carbohydrates further modifies it. After its synthesis is complete, it exits as an integral membrane protein of the vesicle that buds from the Golgi’s trans face. When the vesicle fuses with the cell membrane, the protein becomes an integral portion of that cell membrane. (credit: modification of work by Magnus Manske)
Figure 12.19 Reaction diagrams for an endothermic process in the absence (red curve) and presence (blue curve) of a catalyst. The catalyzed pathway involves a two-step mechanism (note the presence of two transition states) and an intermediate species (represented by the valley between the two transitions states).
Figure 7.45 - Non-homologous end joining (left) versus homologous recombination (right) - Wikipedia
Wikipedia, as credited by Kevin Ahern, Indira Rajagopal, and Taralyn Tan, Biochemistry Free For All, Oregon State University, via Biology LibreTexts. · Source attribution
· Original image ↗ · Access for free ↗
The amount of a substance that can dissolve in a solvent under specified conditions. Soluble means able to dissolve; insoluble means only very slightly soluble in that solvent.
Figure 15.7 Messenger RNA is a copy of protein-coding information in the coding strand of DNA, with the substitution of U in the RNA for T in the coding sequence. However, new RNA nucleotides base pair with the nucleotides of the template strand. RNA is synthesized in its 5'-3' direction, using the enzyme RNA polymerase. As the template is read, the DNA unwinds ahead of the polymerase and then rewinds behind it.
A fleeting, high-energy arrangement at a reaction barrier. It is an energy maximum along the reaction path, rather than a stable reaction intermediate.
Figure 12.19 Reaction diagrams for an endothermic process in the absence (red curve) and presence (blue curve) of a catalyst. The catalyzed pathway involves a two-step mechanism (note the presence of two transition states) and an intermediate species (represented by the valley between the two transitions states).
Figure 15.18 Translation begins when an initiator tRNA anticodon recognizes a start codon on mRNA bound to a small ribosomal subunit. The large ribosomal subunit joins the small subunit, and a second tRNA is recruited. As the mRNA moves relative to the ribosome, successive tRNAs move through the ribosome and the polypeptide chain is formed. Entry of a release factor into the A site terminates translation and the components dissociate.
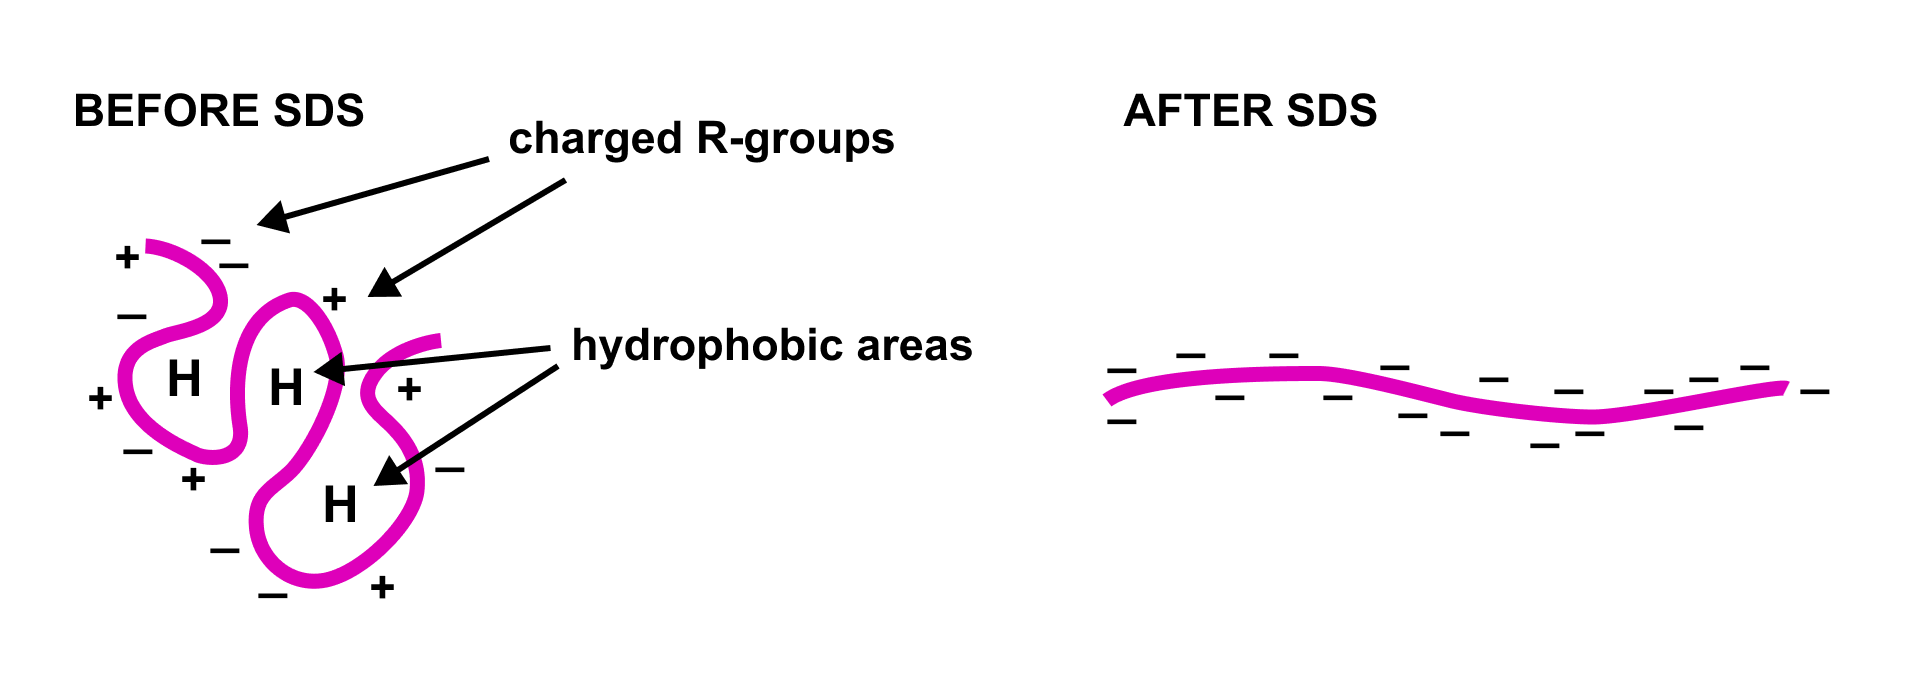
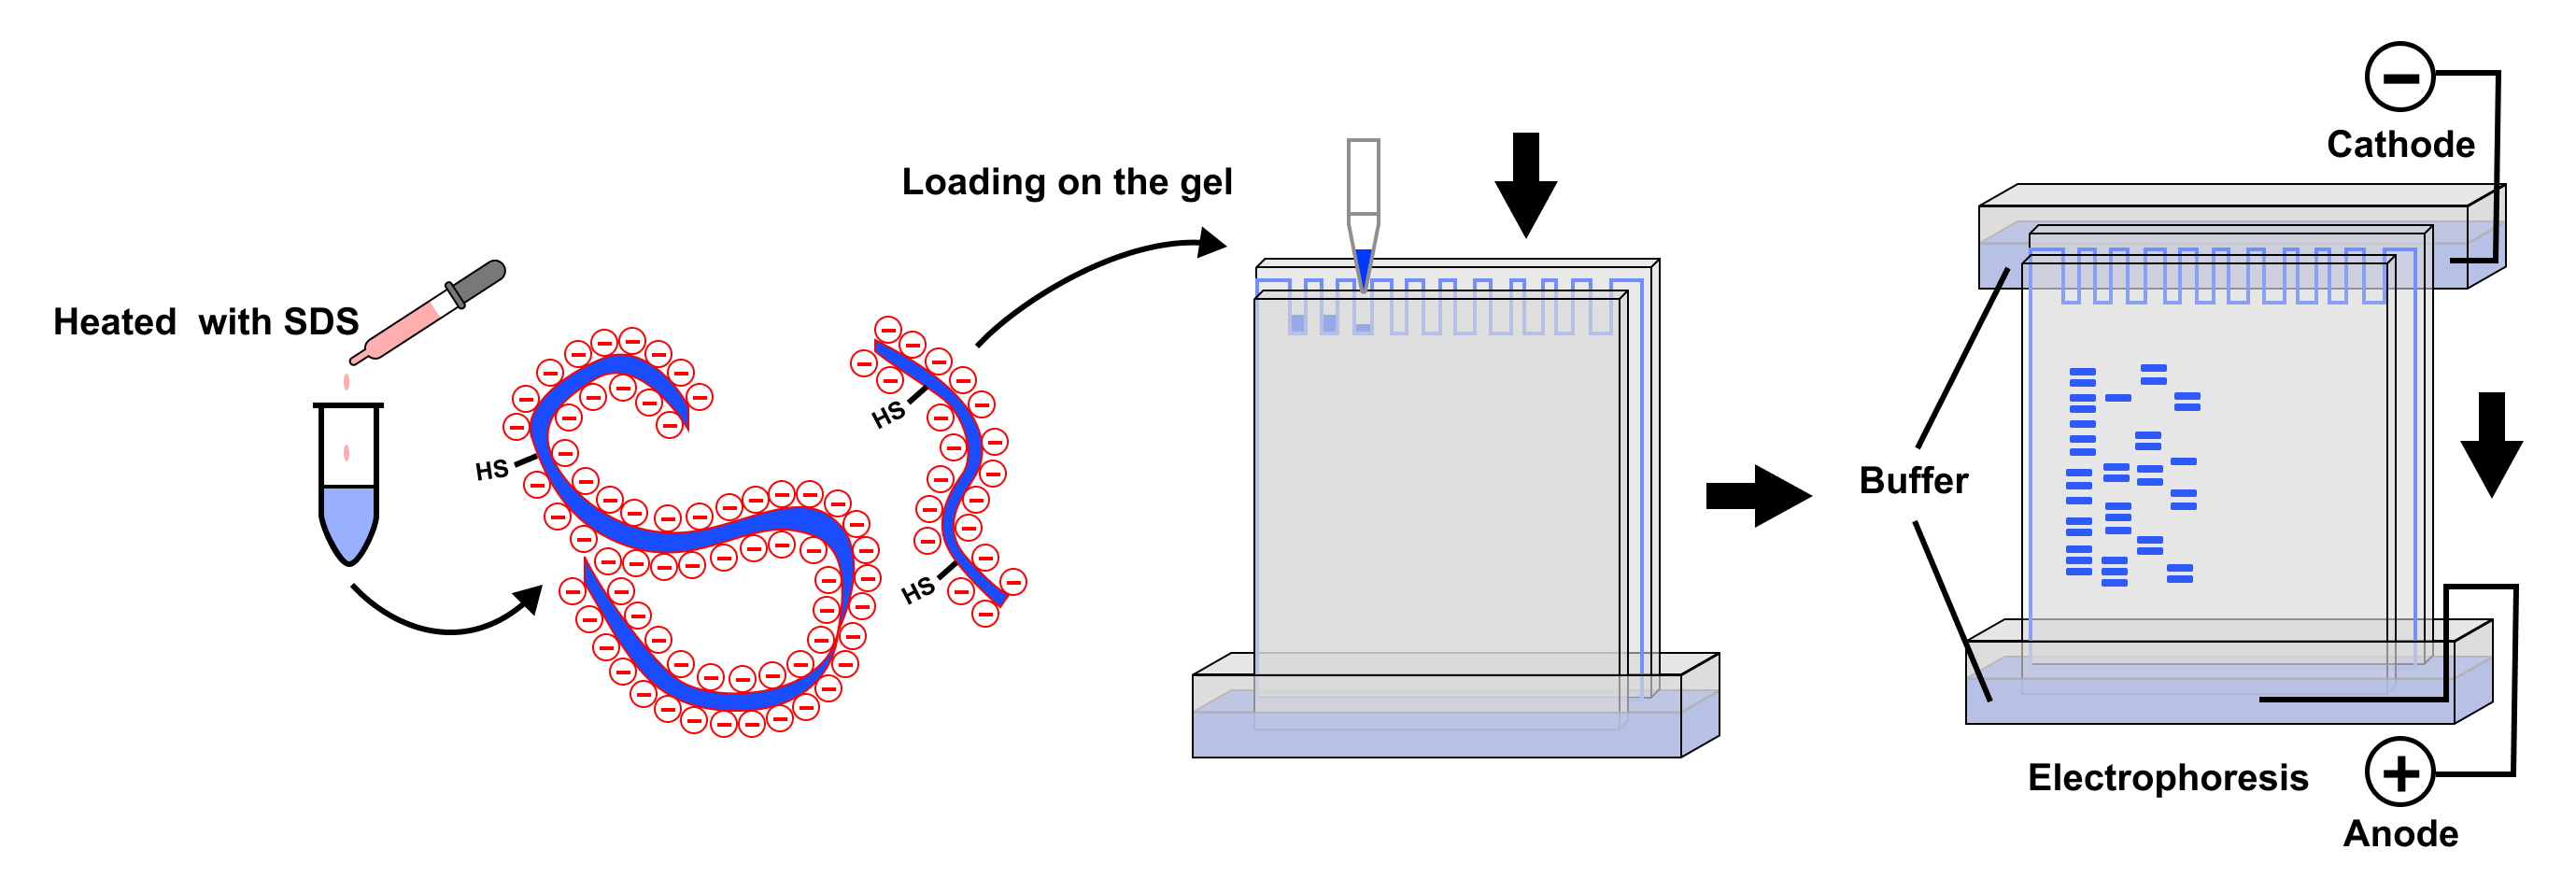
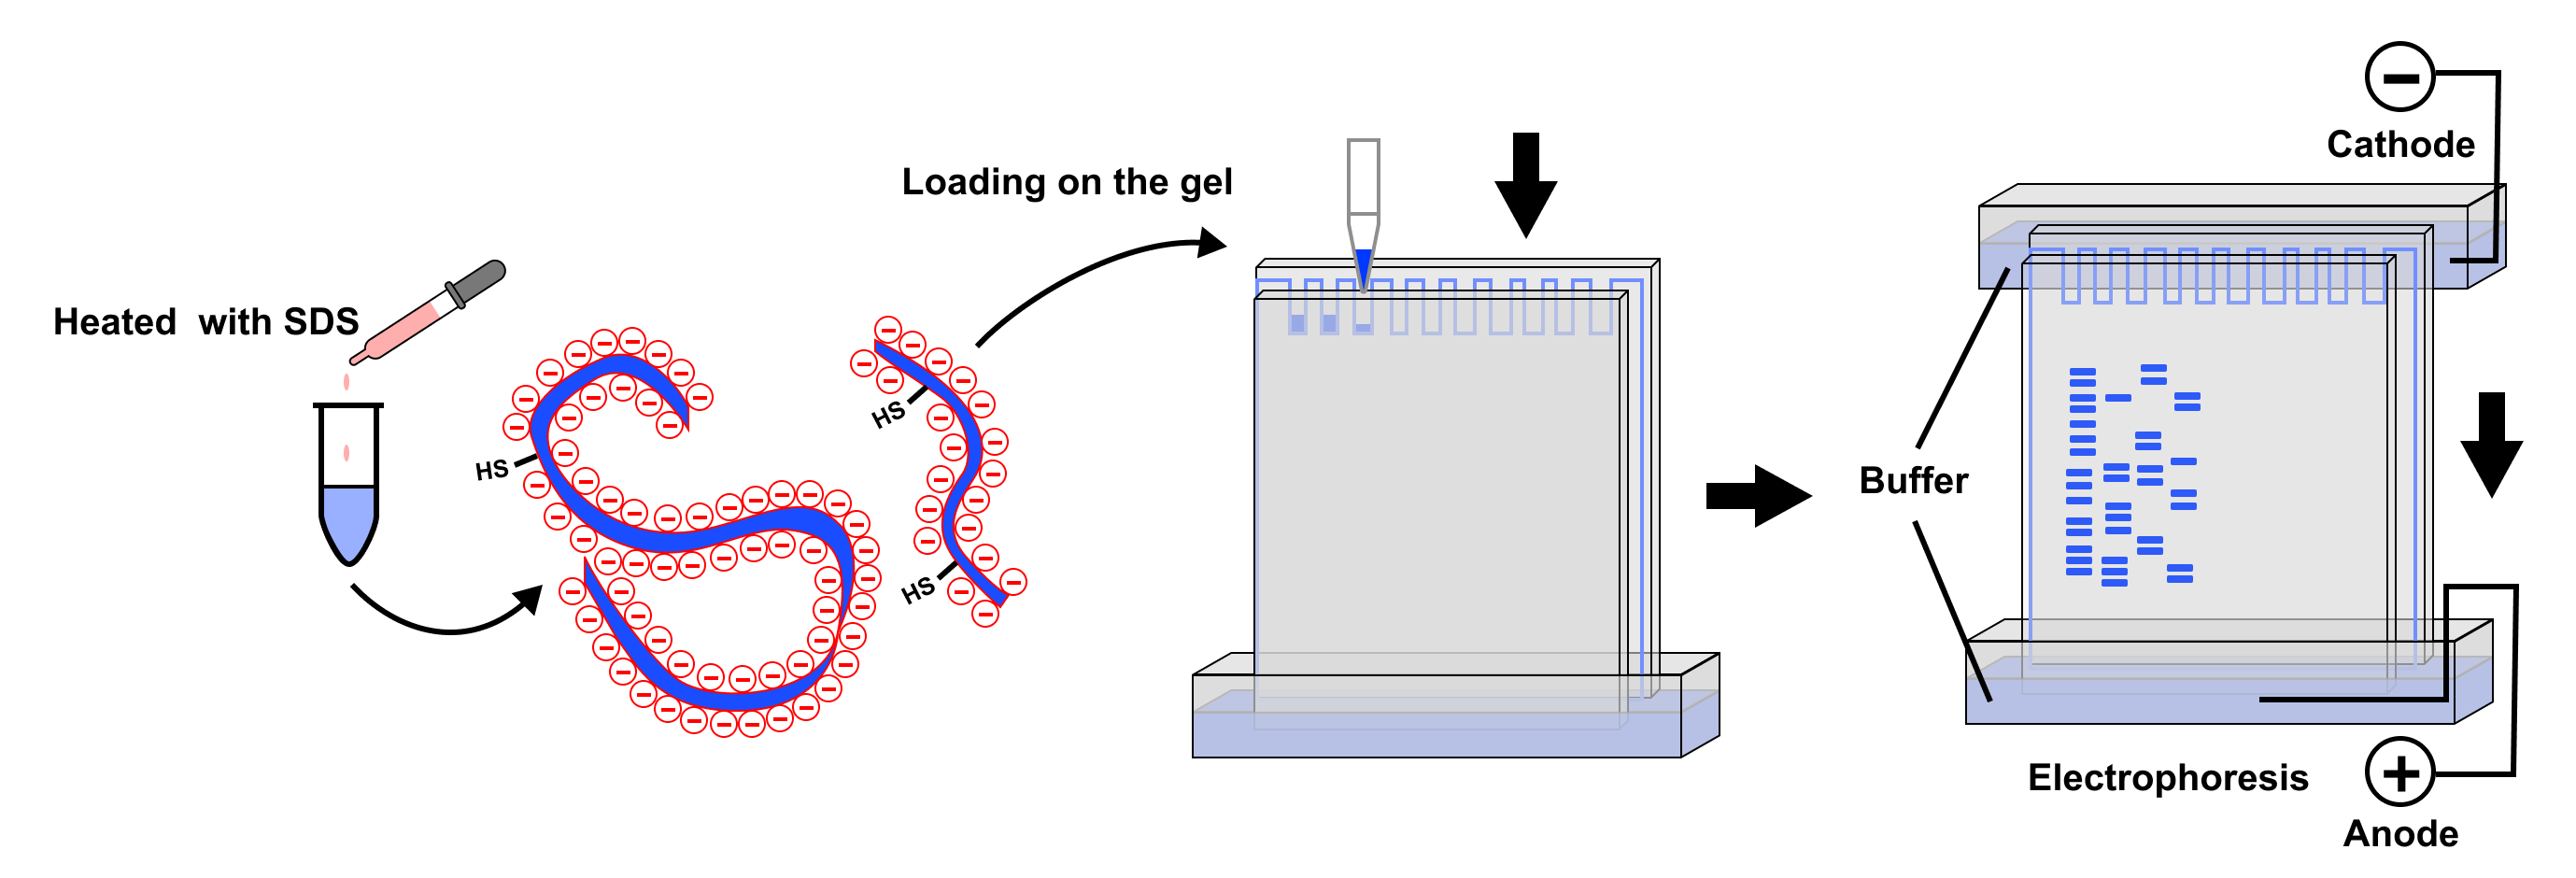
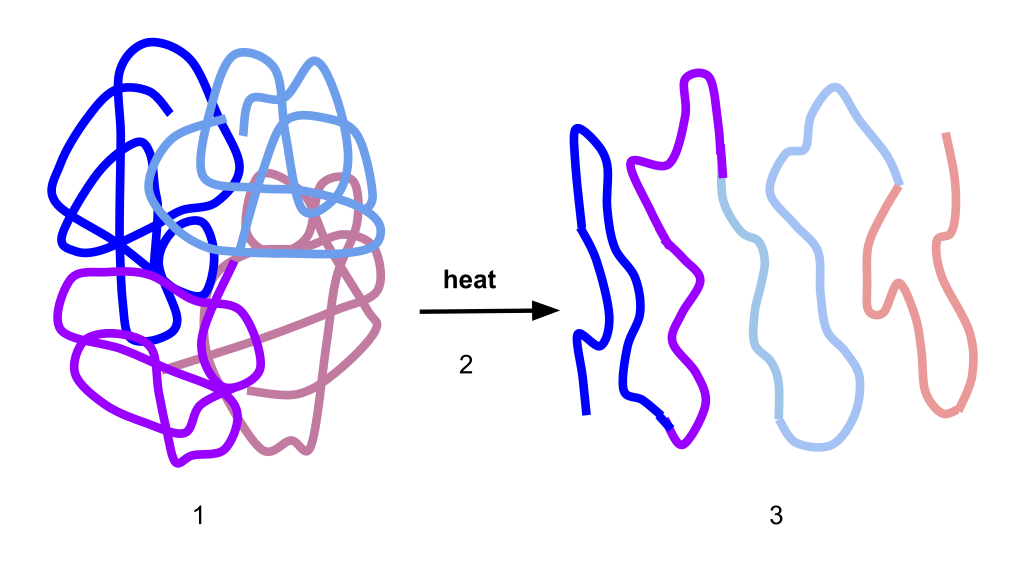
SDS is an anionicdetergent that binds to proteins in a ratio proportional to their length, imparting a uniform negative charge. This denatures the proteins, unfolding them into linear chains and masking their intrinsic charges. As a result, when an electric field is applied, the proteins are separated solely based on their size, as the charge-to-mass ratio is uniform.
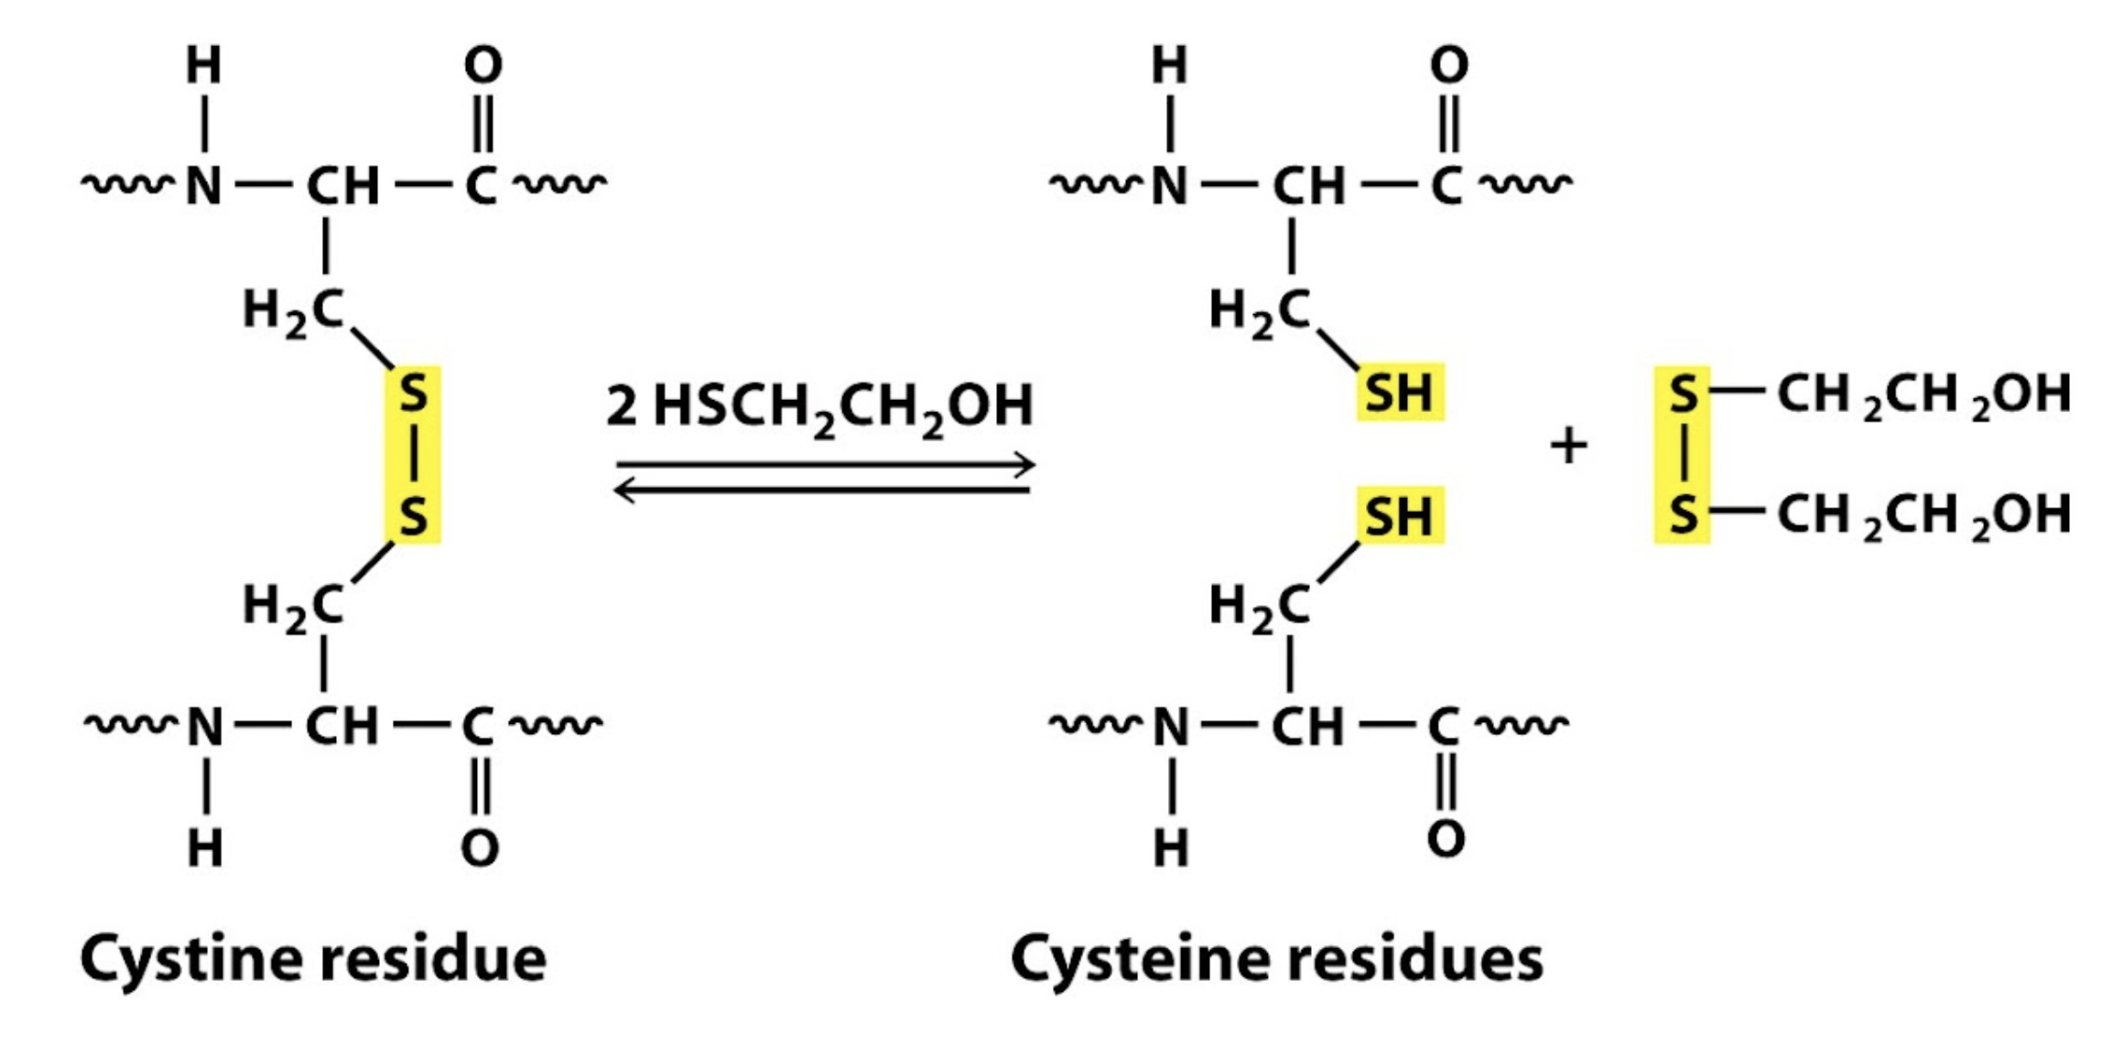
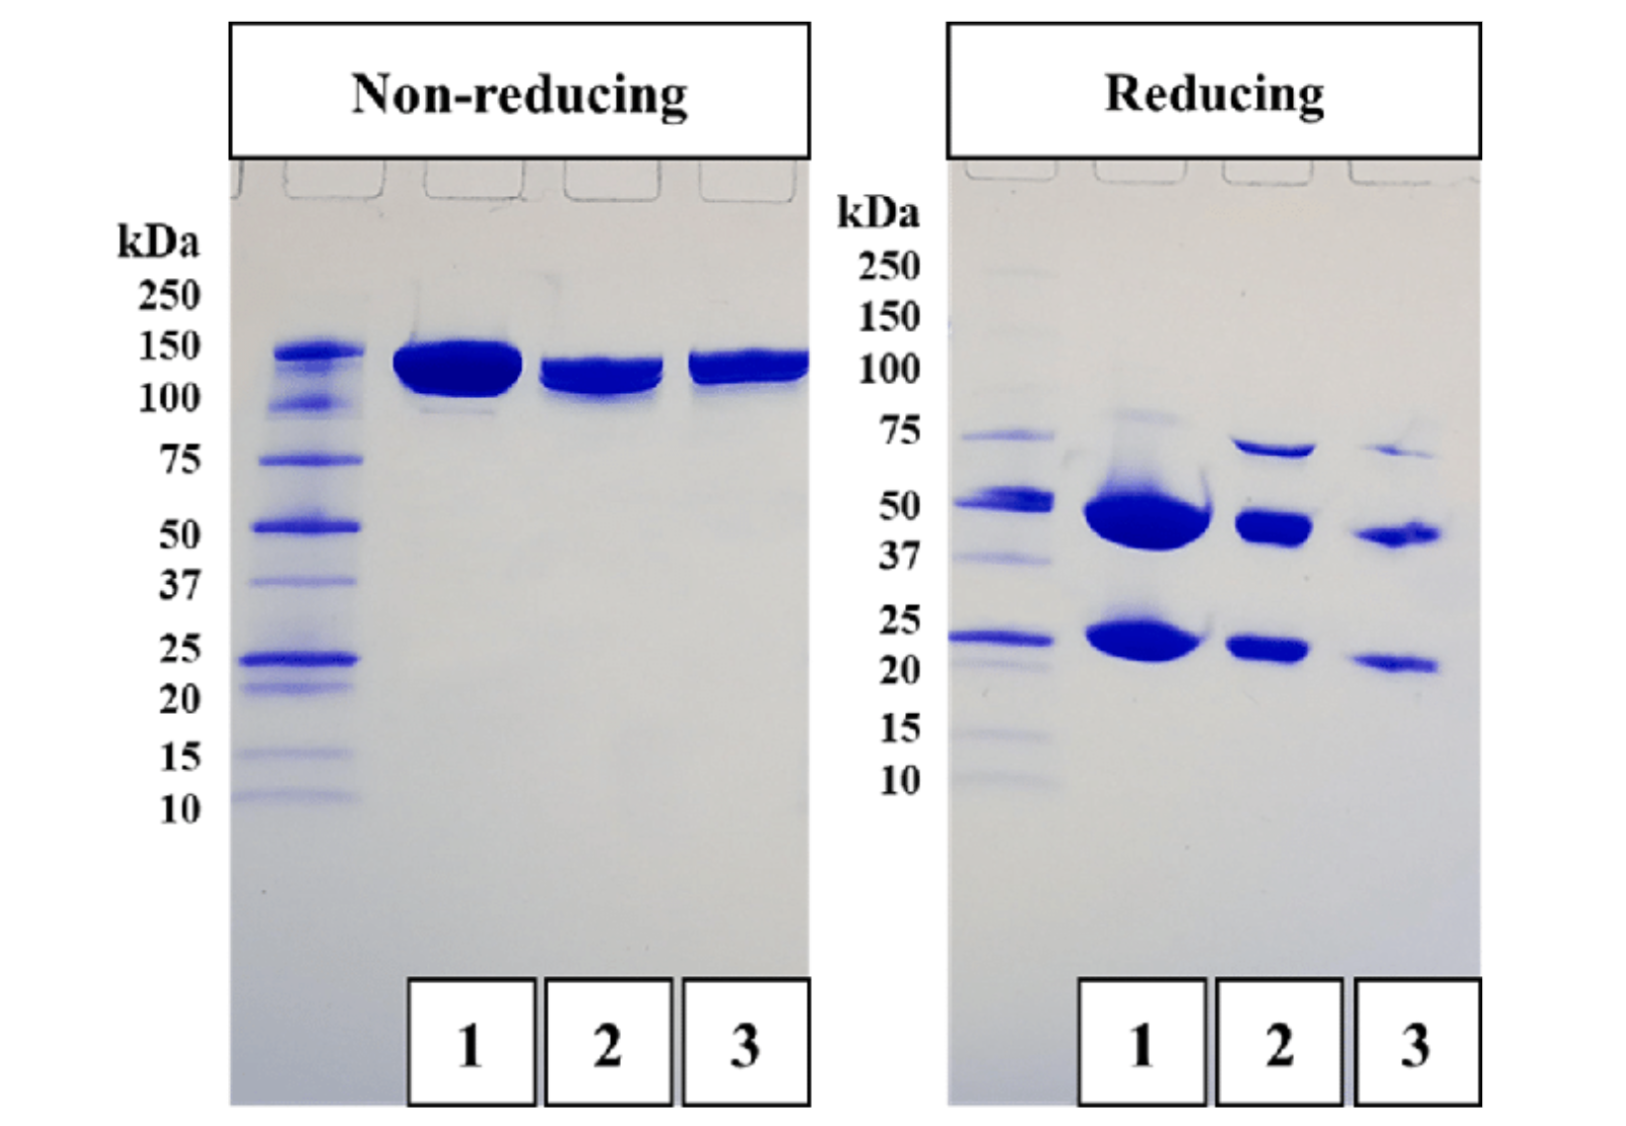
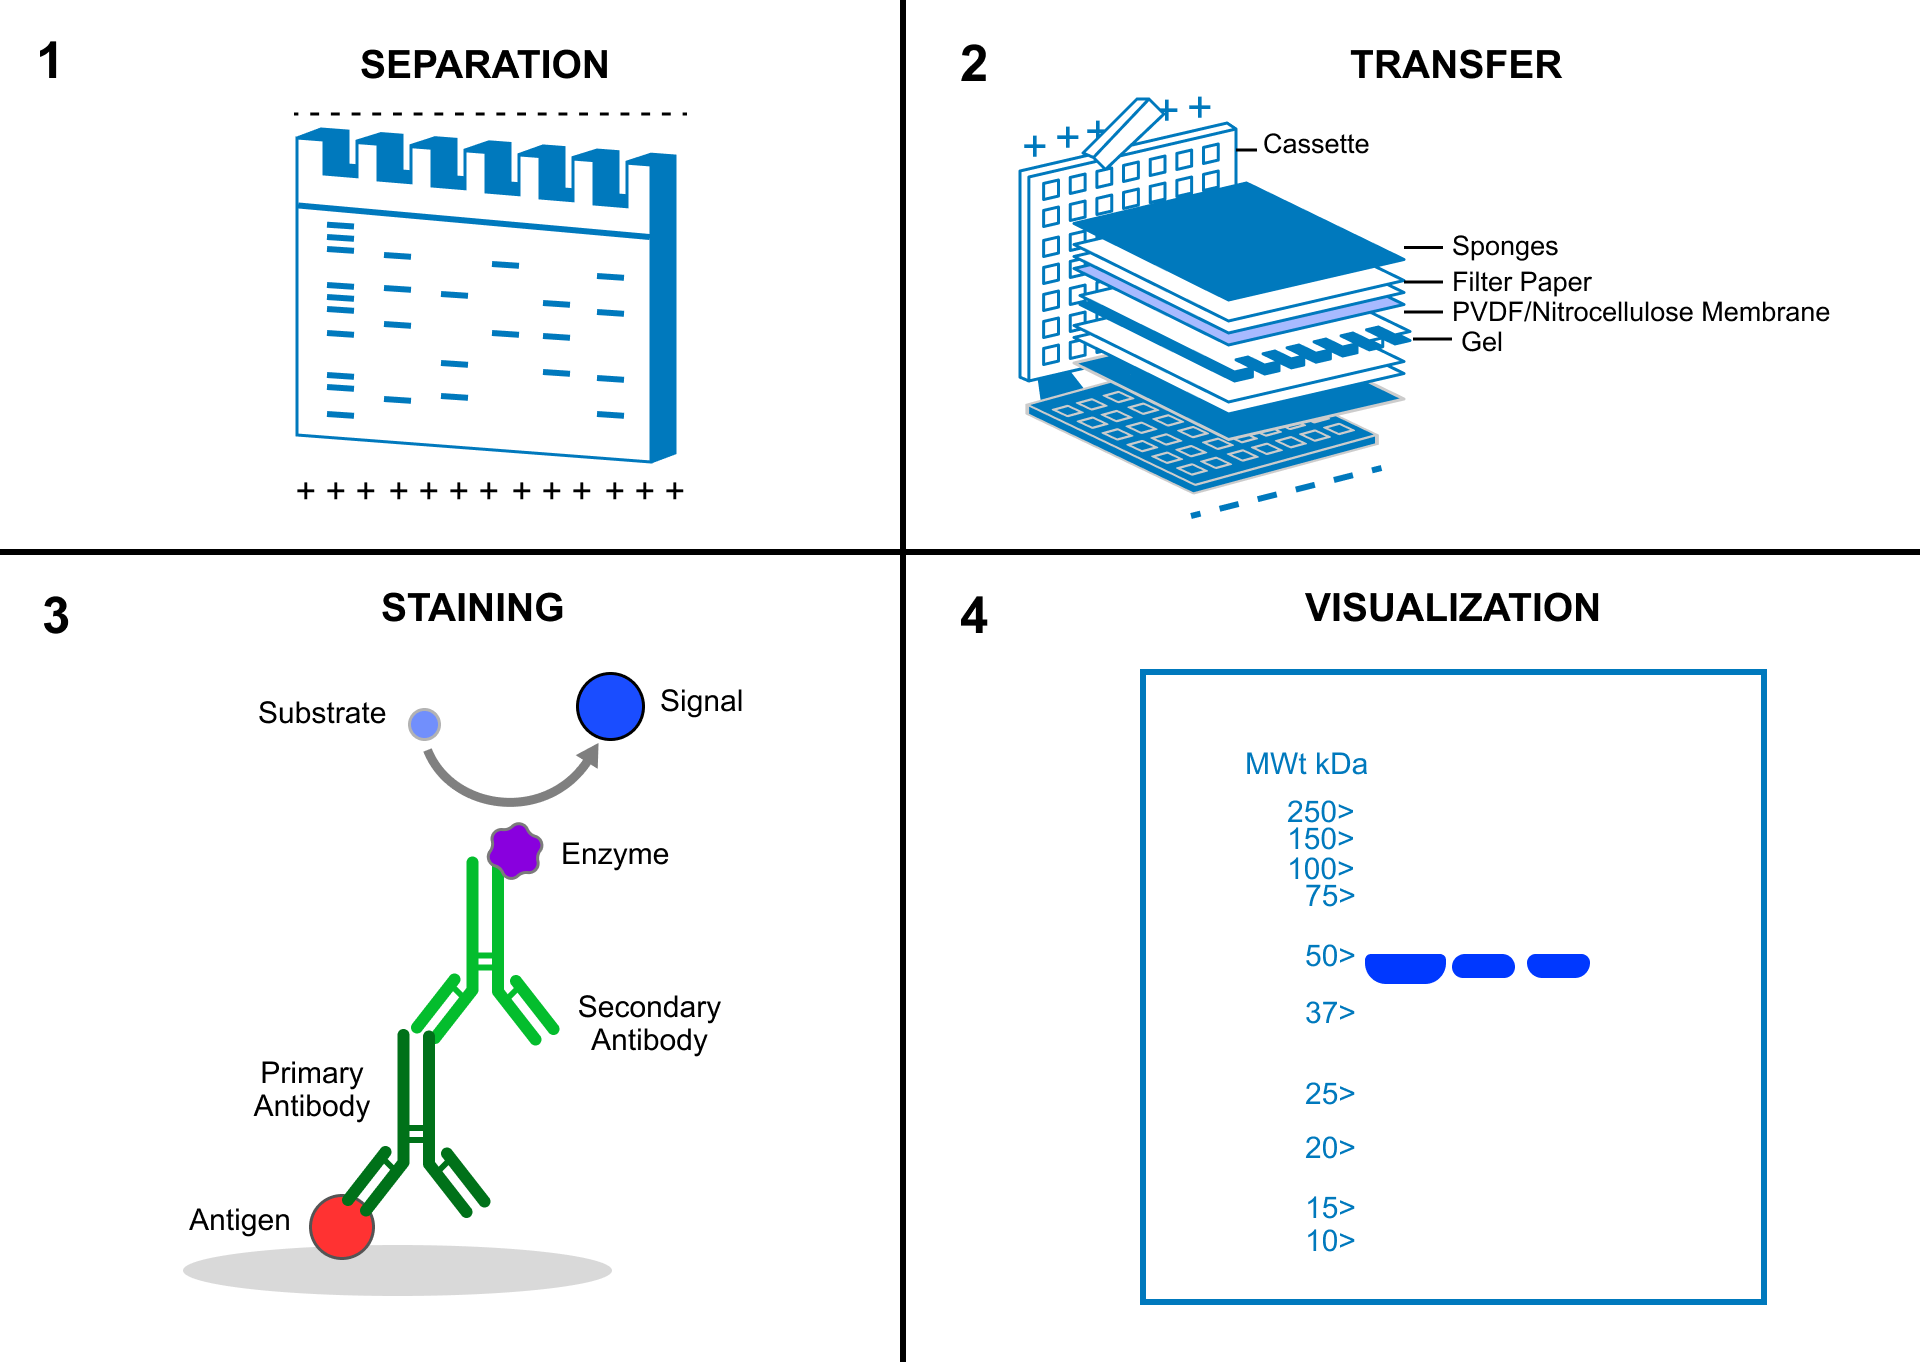
Comparing the bands visualized under reducing and non-reducing conditions can allow you to deduce the overall size of the protein and the size of its subunits.
For example, the following image shows the same 150 kDaprotein run under non-reducing conditions. When run under reducing conditions (on the right), the protein separates into various smaller subunits. (Note this gel is a little unusual, because it shows the profile of an antibody, which consists of two 50 kDaheavy chains and two 25 kDalight chains; some of them remain bound in the gel, creating a faint 75 kDa band.)
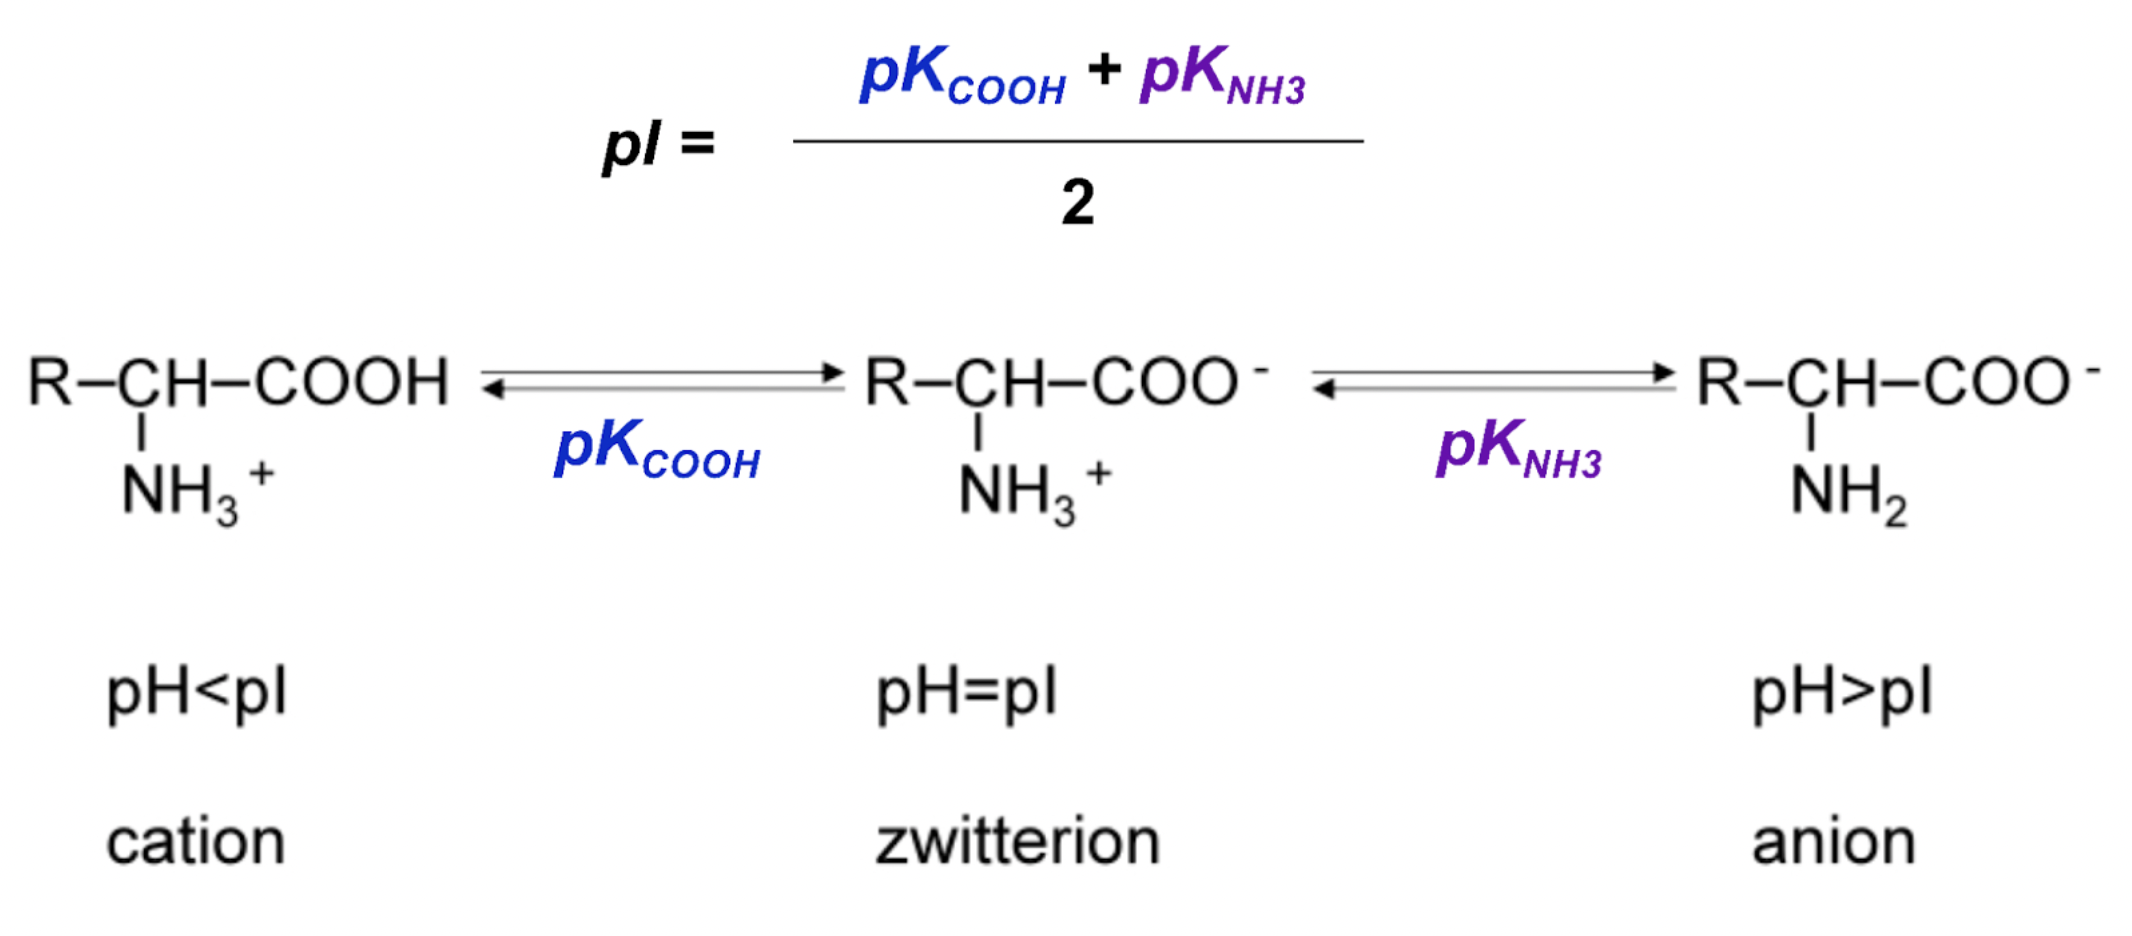
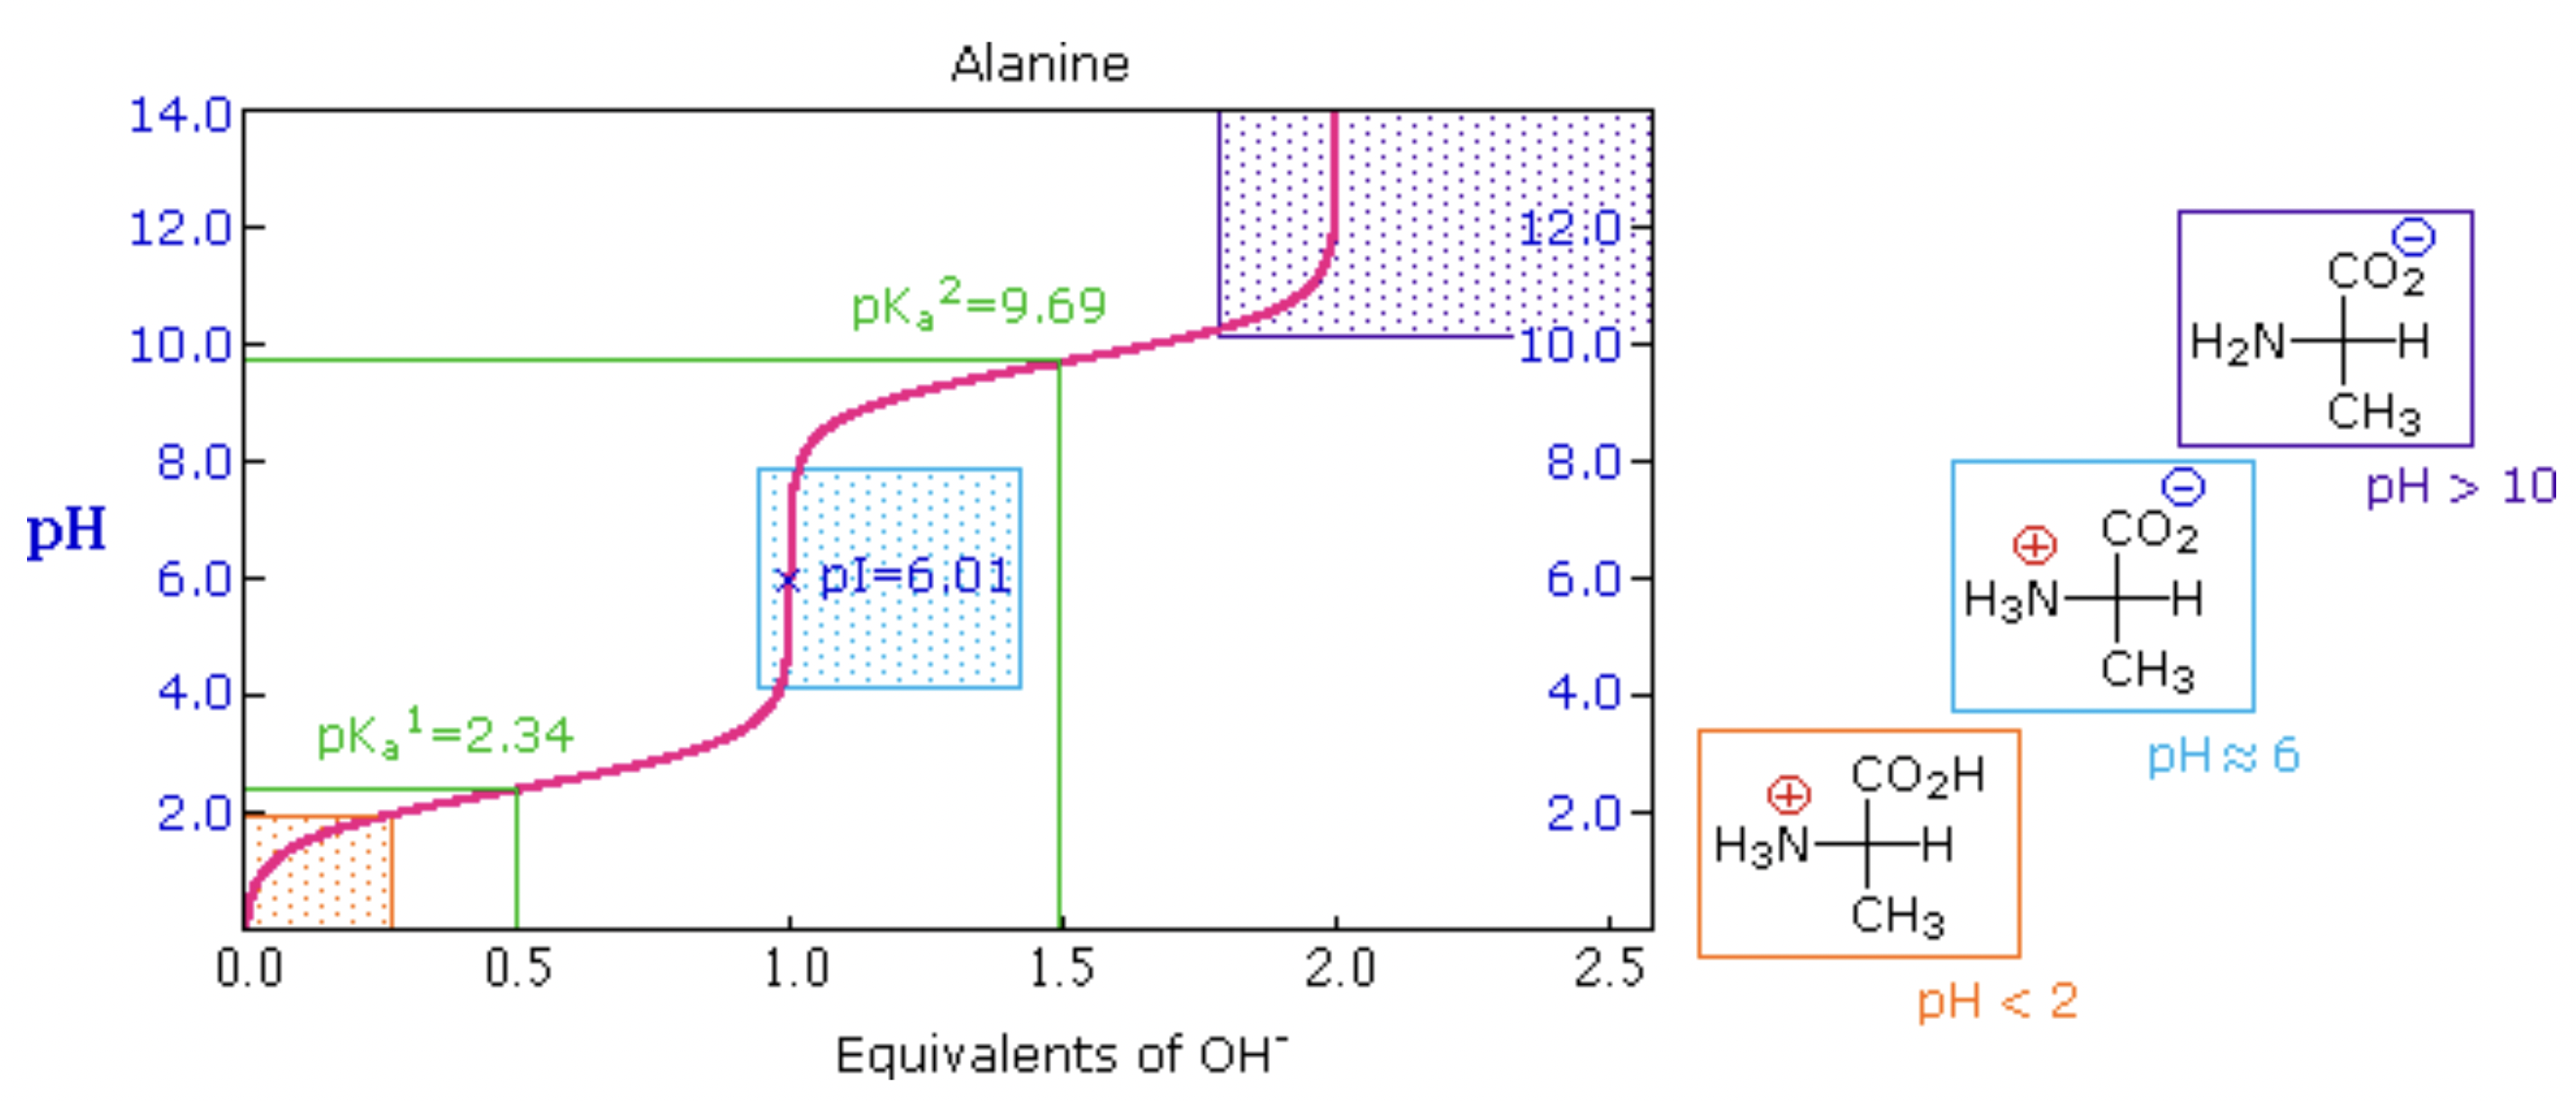
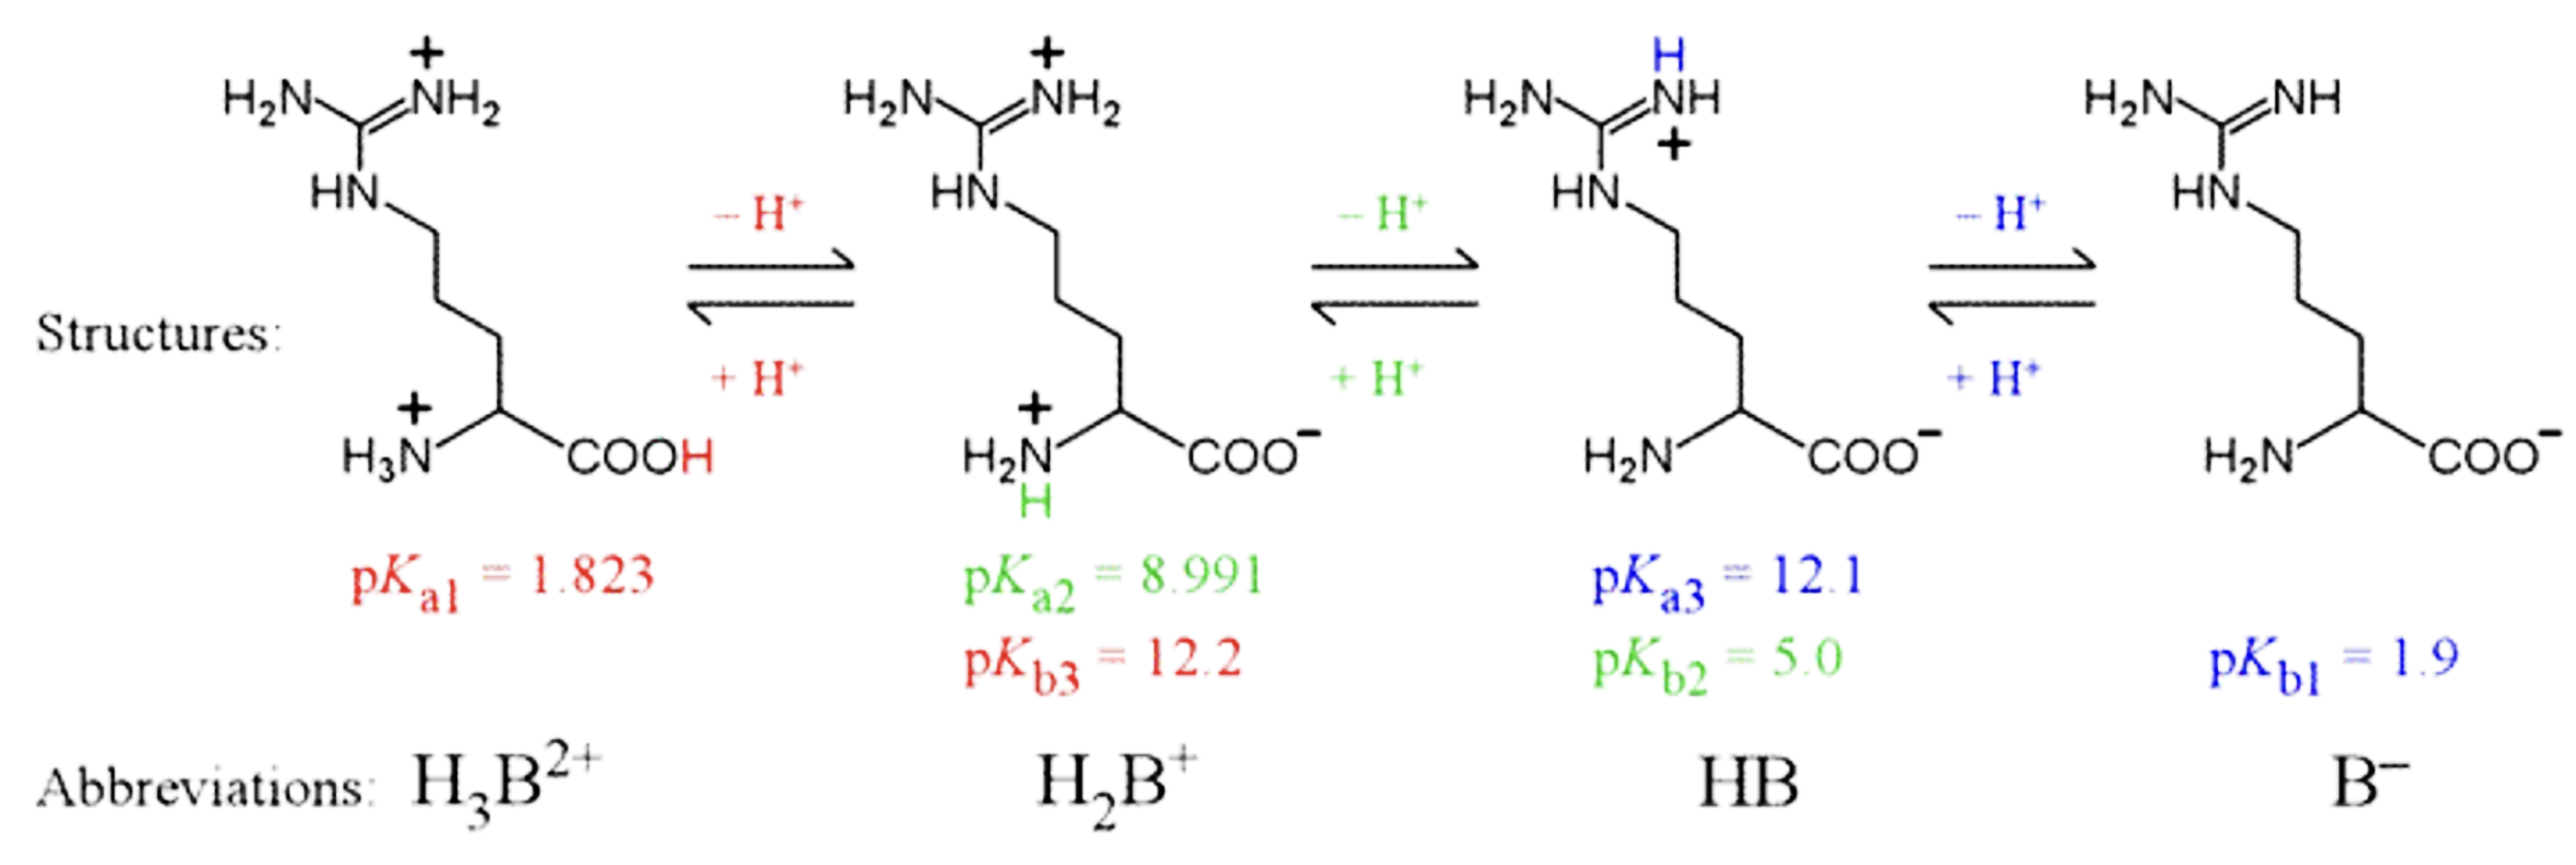
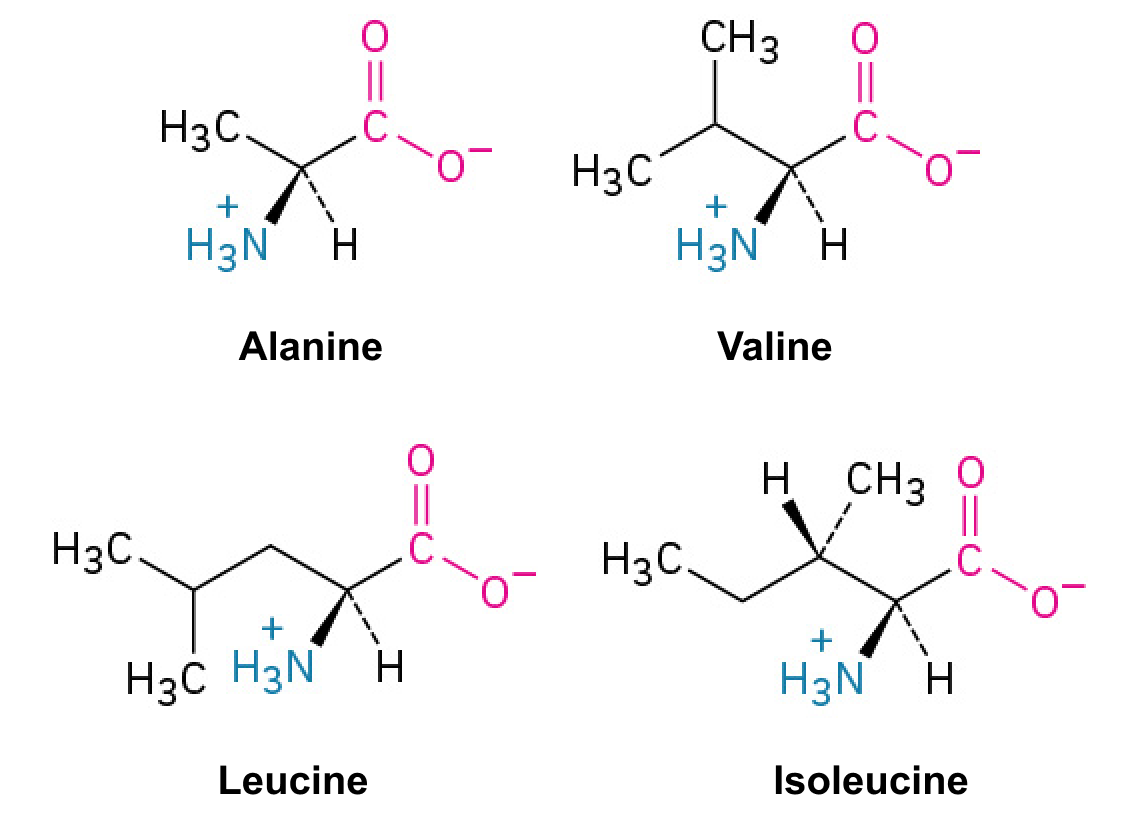
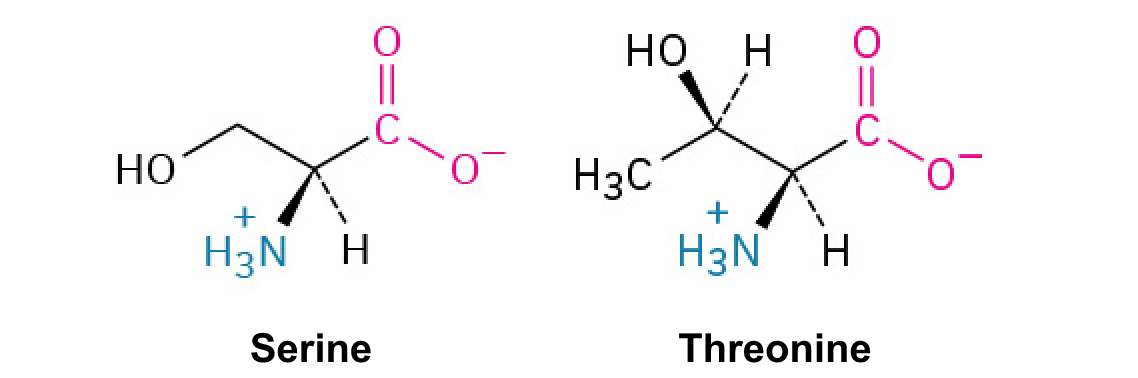
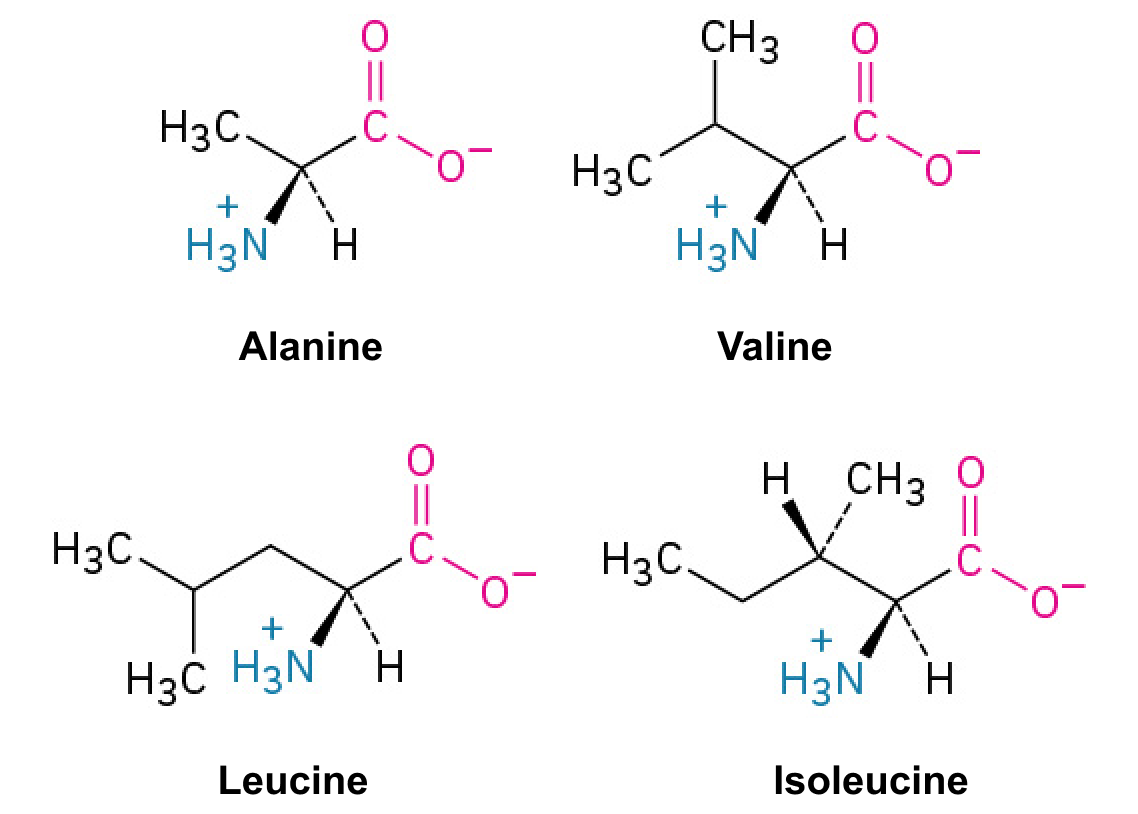
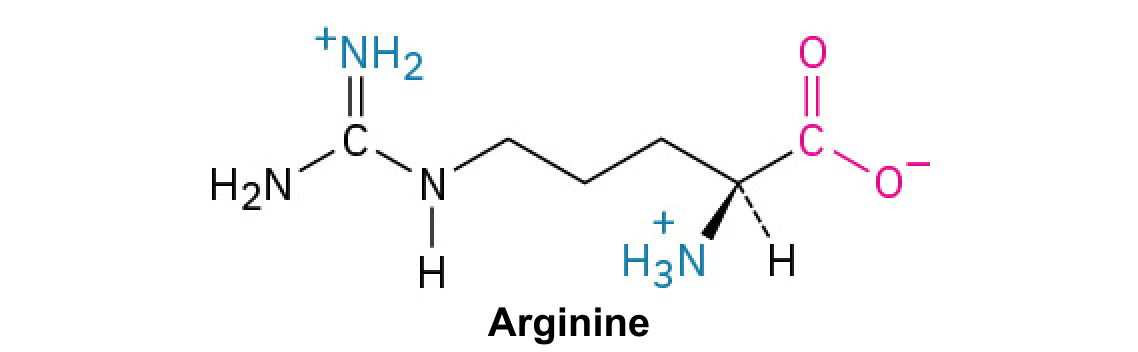
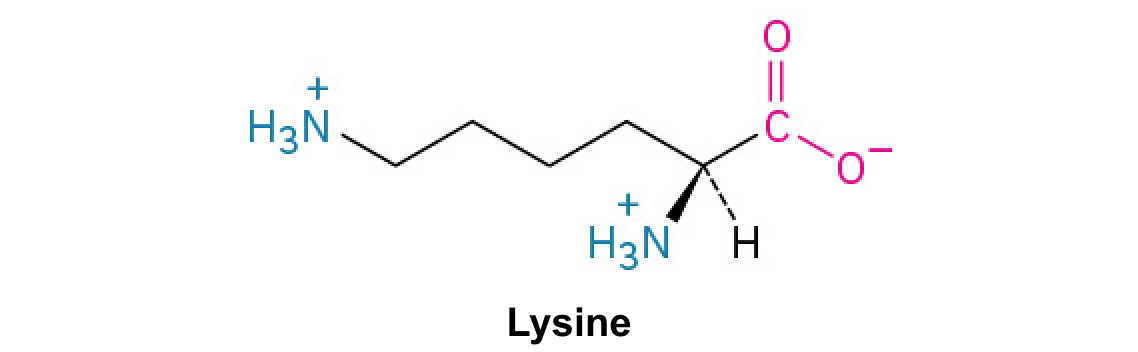
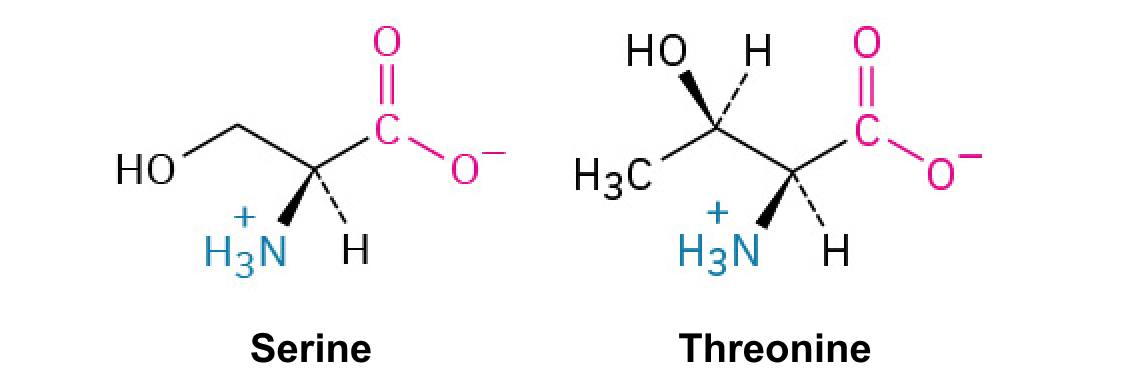
Because the of is around 2.2 and the of is around 9.5, depending on the amino acid, neutralamino acids tend to have a around 5-6. [(9.5+2.2)/2 = 5.85] You don’t have to memorize this, but you should know how the relative ’s differ between neutral, basic, and acidicamino acids, as discussed further below.
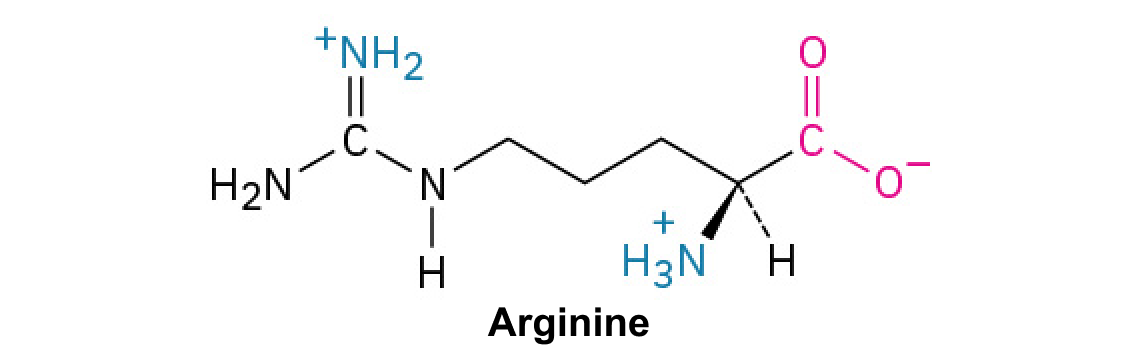
As you can see from above, basic amino acids have higher values. Acidicamino acids, conversely, have lower s. For each type of amino acid, you must consider where the net neutral form of the molecule appears, and select the correct values to determine the .
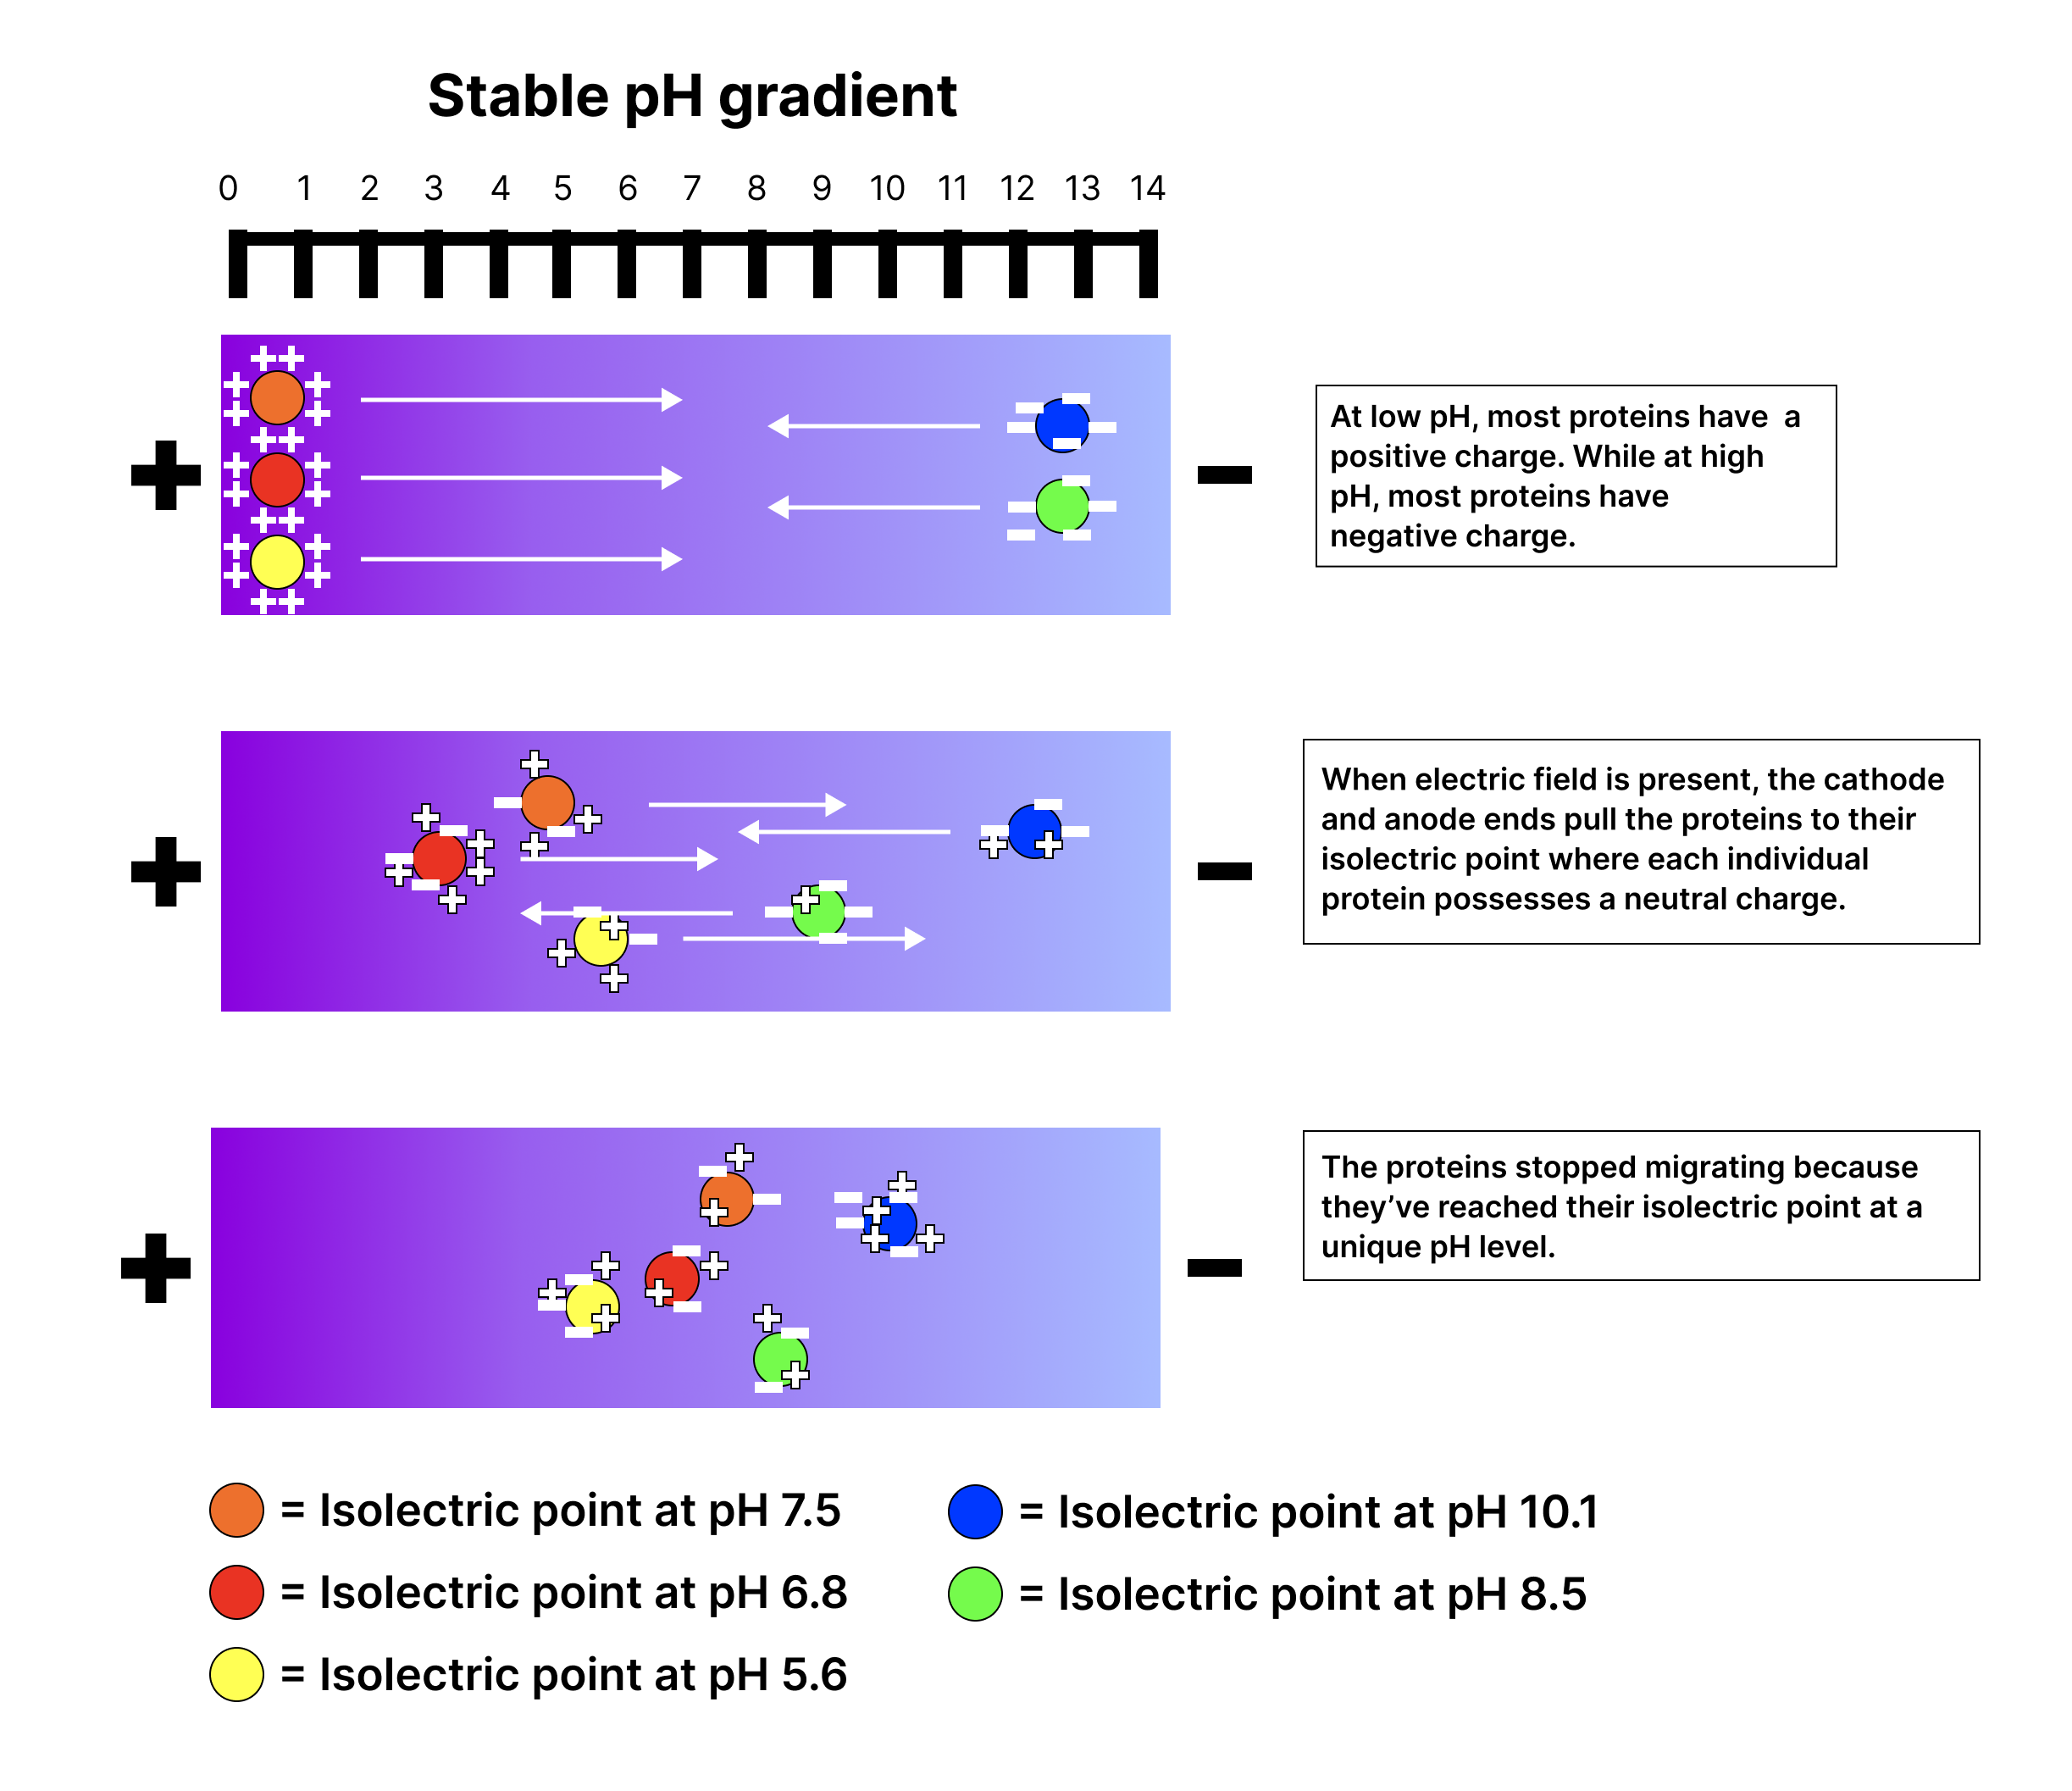
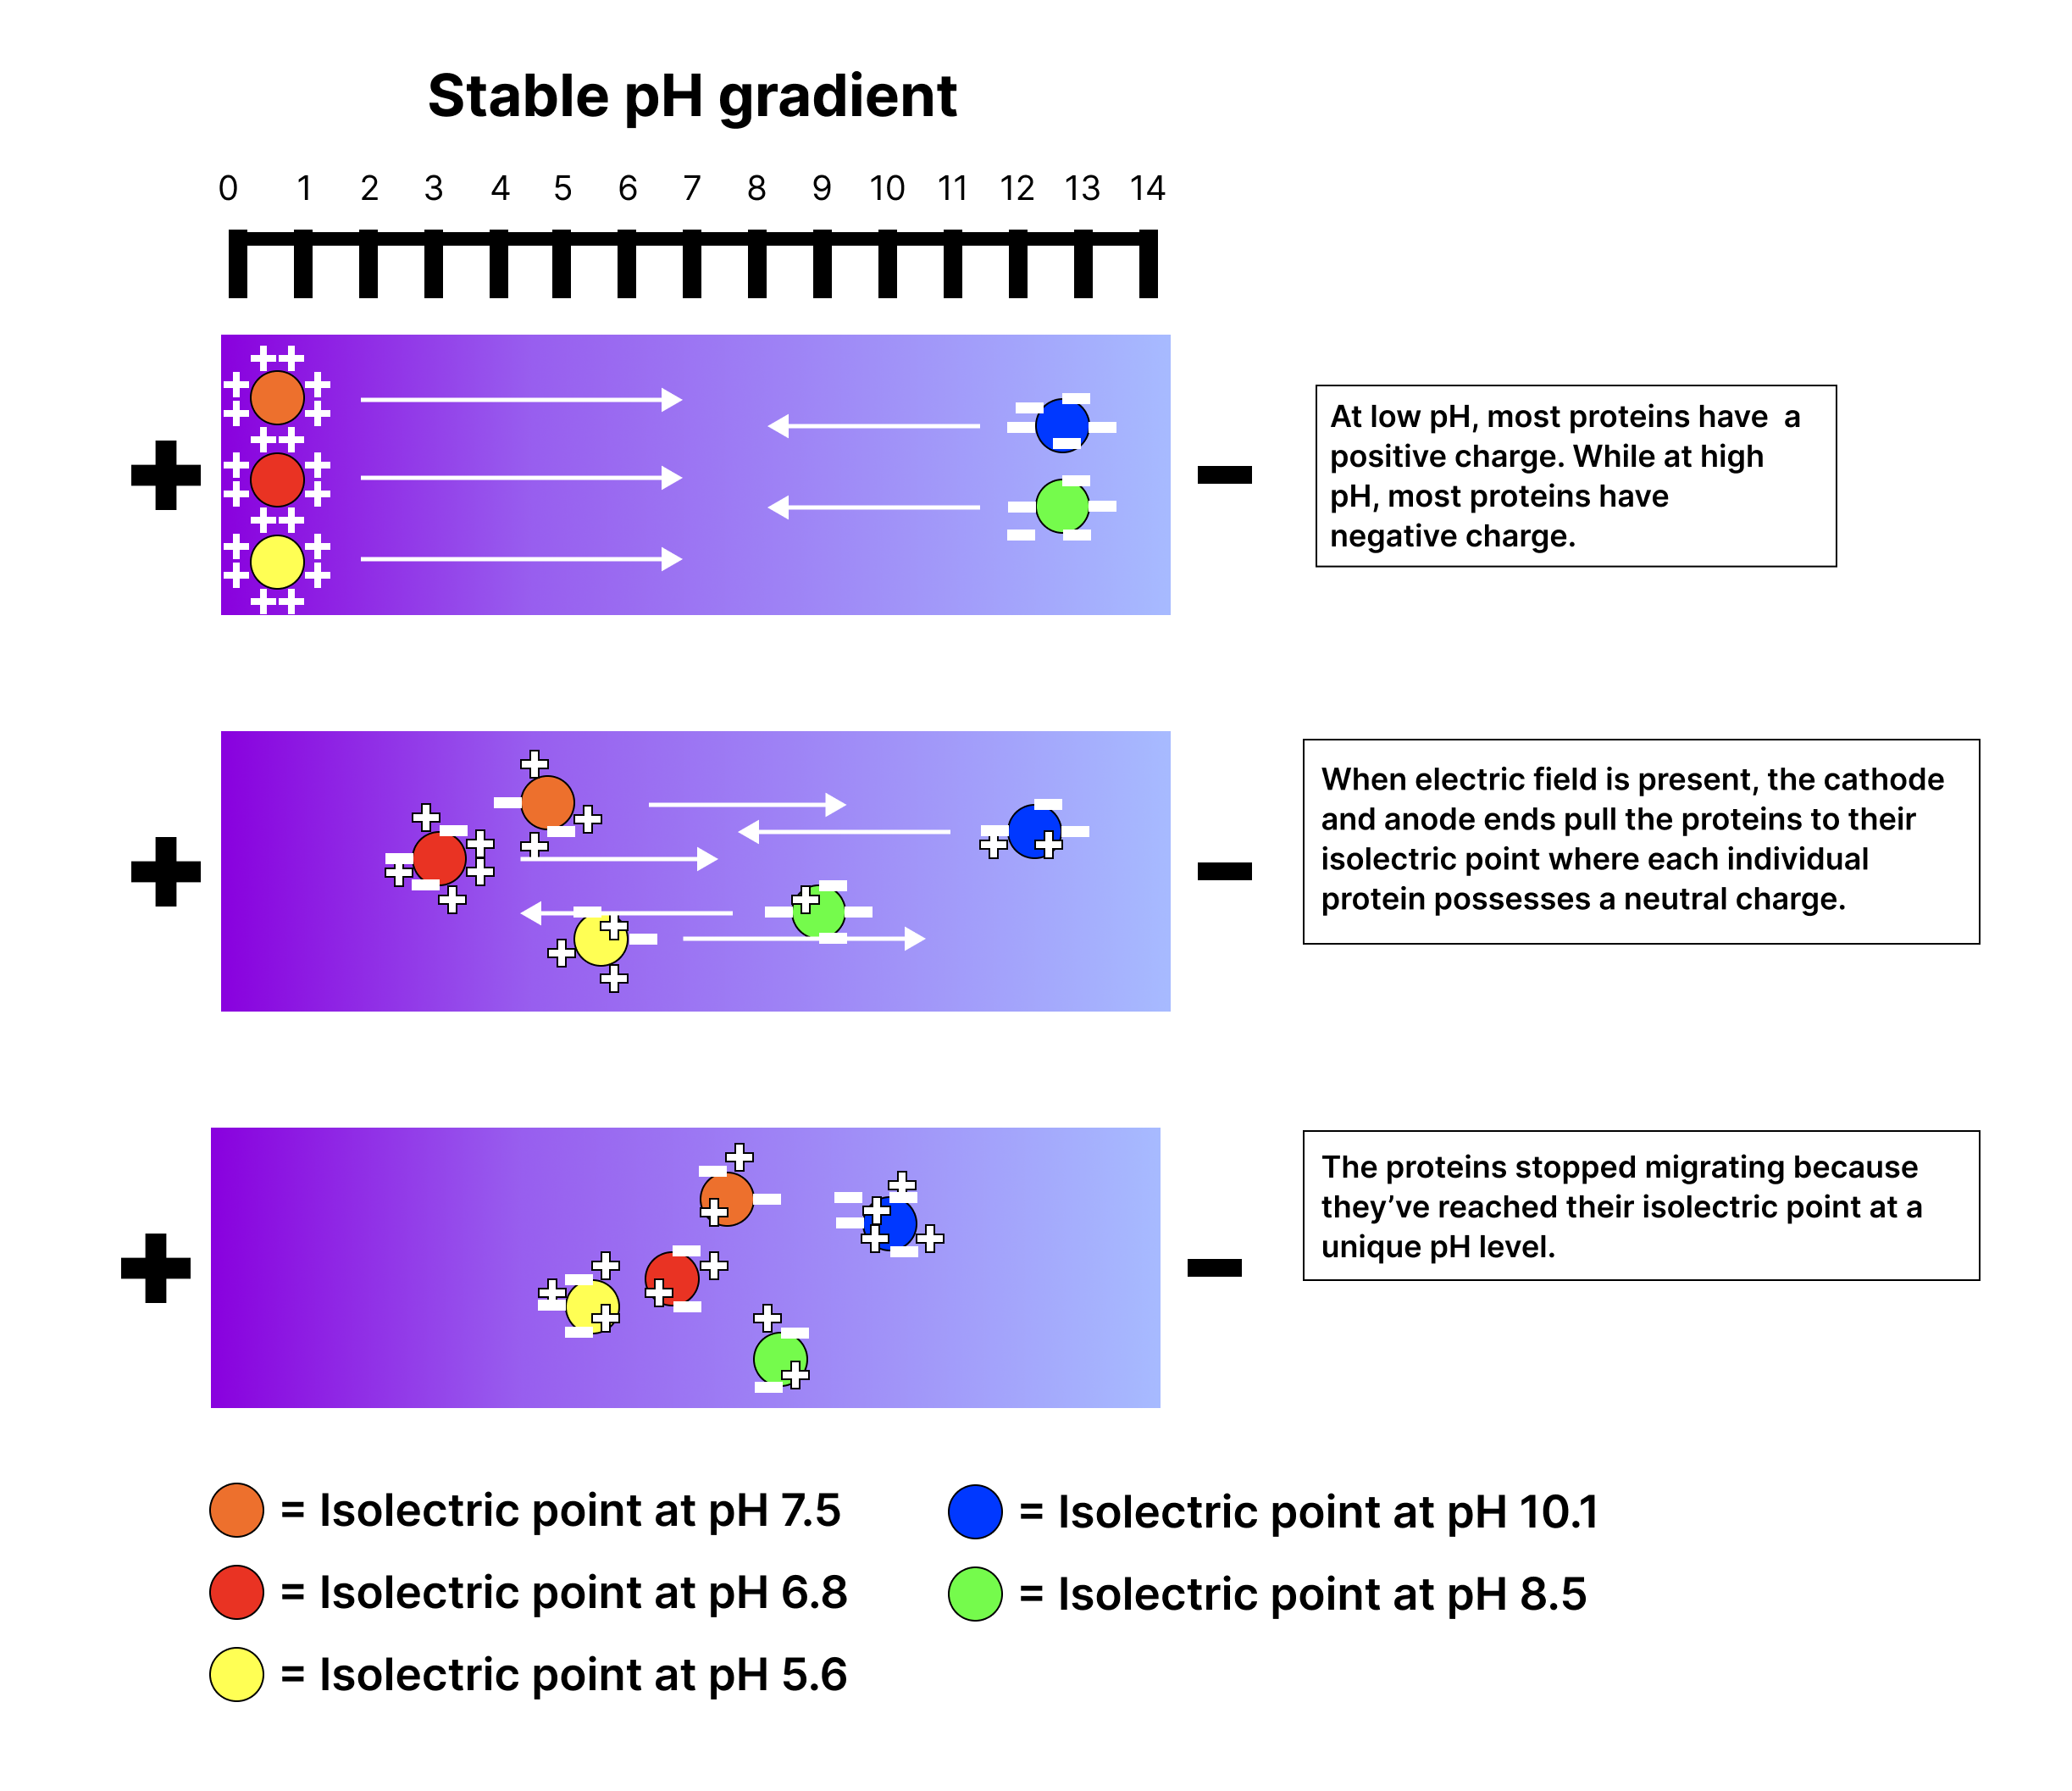
When an electric field is applied across the gel, proteins begin to migrate through the medium towards the electrode of opposite charge. As they travel, they encounter different pH levels. Each protein or peptide moves until it reaches a point in the gradient where the pH equals its isoelectric point, or . At this specific pH, the protein or peptide has no net charge, which means it stops migrating and forms a distinct band or zone at that pH level.
The result of this process is a highly resolved separation of the proteins or peptides. Since each protein has a unique isoelectric point, they can be distinguished from each other with great precision, even if their differences are as small as a single charged group, as seen in the image below.
Hint 1: The protein (marked blue) with of 10.1 has the highest isoelectric point. This protein has a strong positive charge at lower pH levels, meaning it will stop migrating only at a very high pH.
Hint 2: The protein (marked yellow) with the of 5.6 has the lowest isoelectric point. It requires a lower pH to reach a point where it has no net charge.
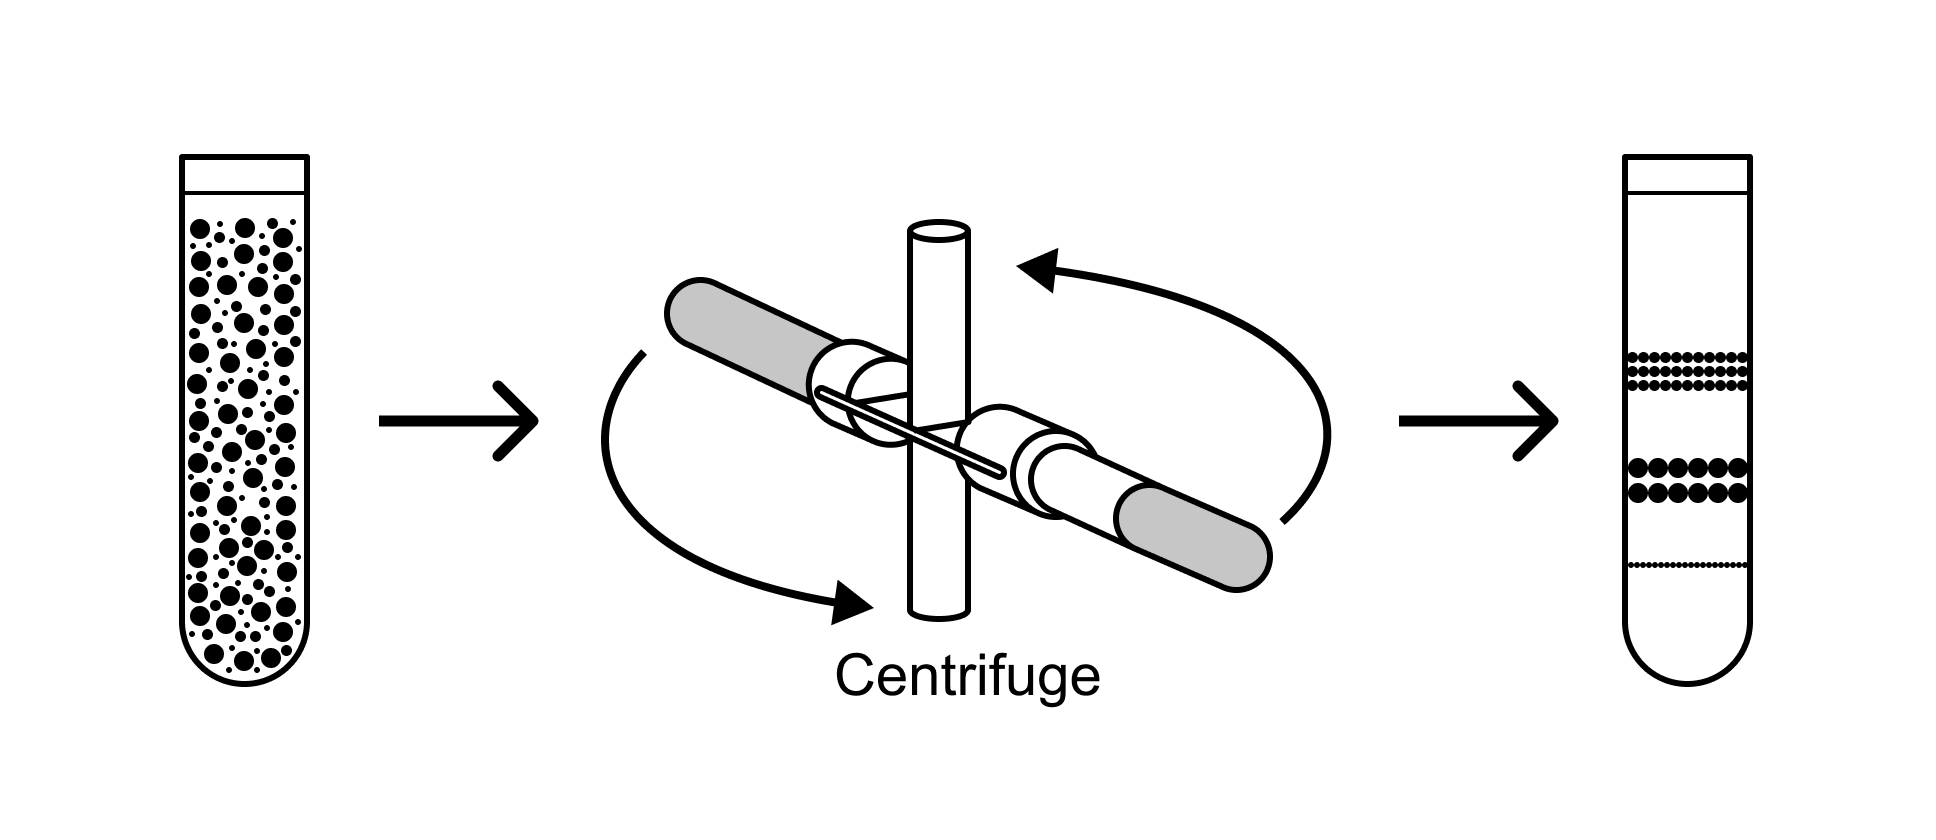
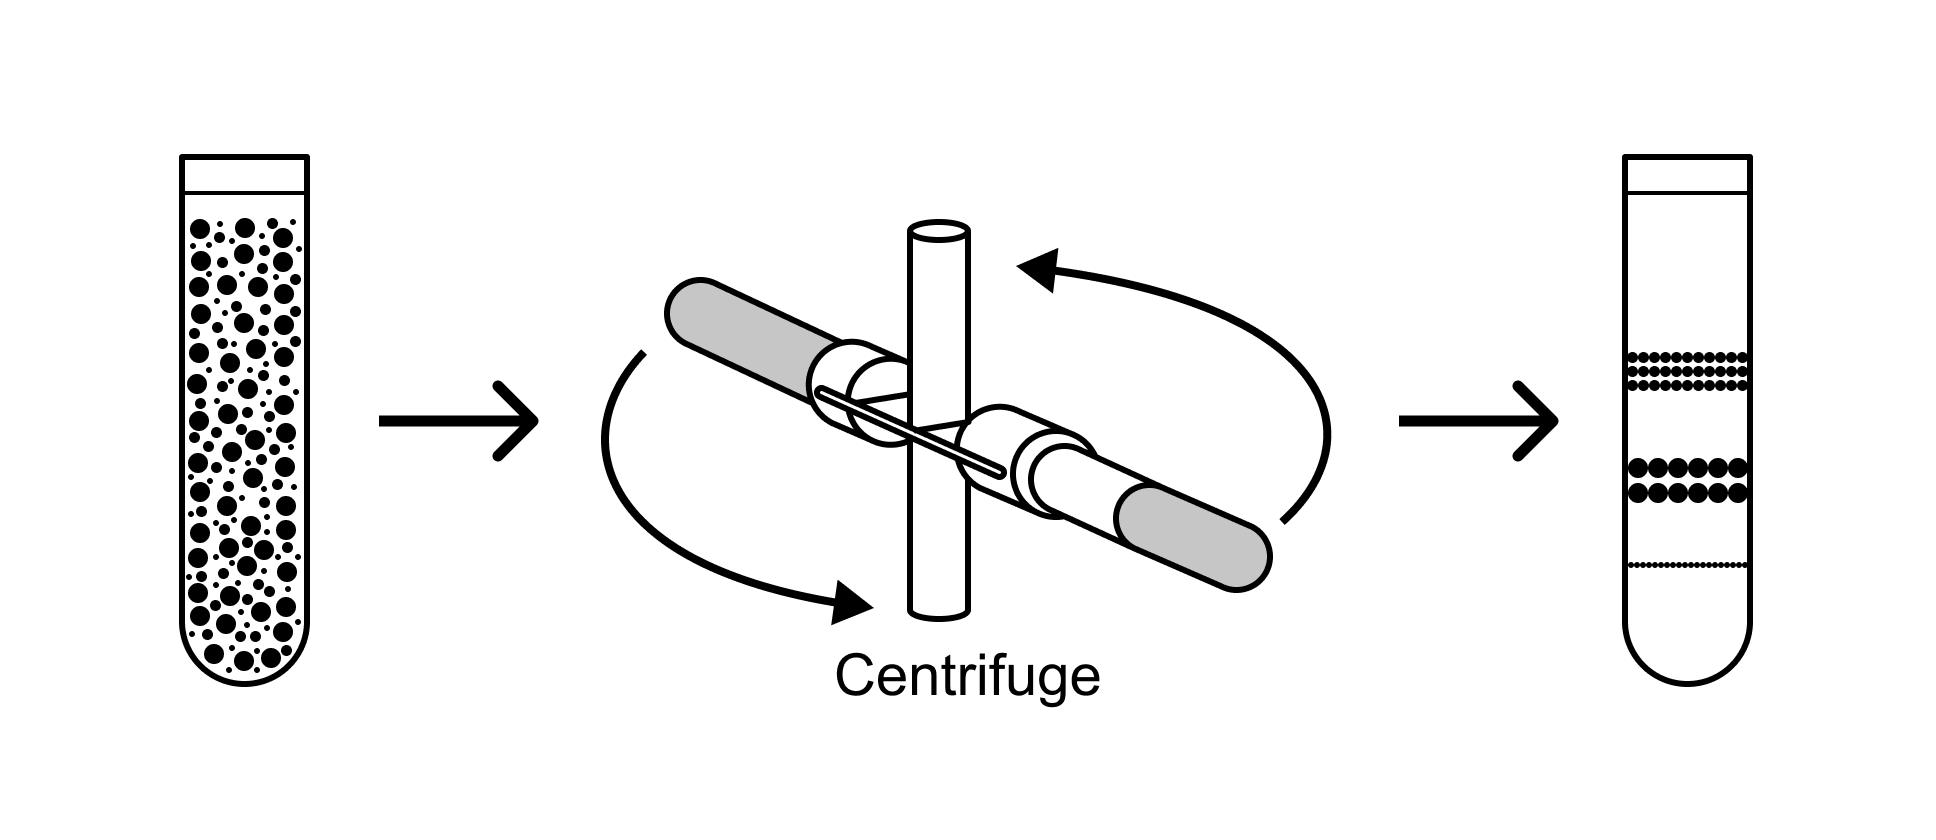
The force acting on a particle during centrifugation is proportional to its mass, which is related to its size. Larger proteins have more mass and thus experience a greater centrifugal force. They generally sediment to the bottom of the centrifuge tube faster than smaller proteins.
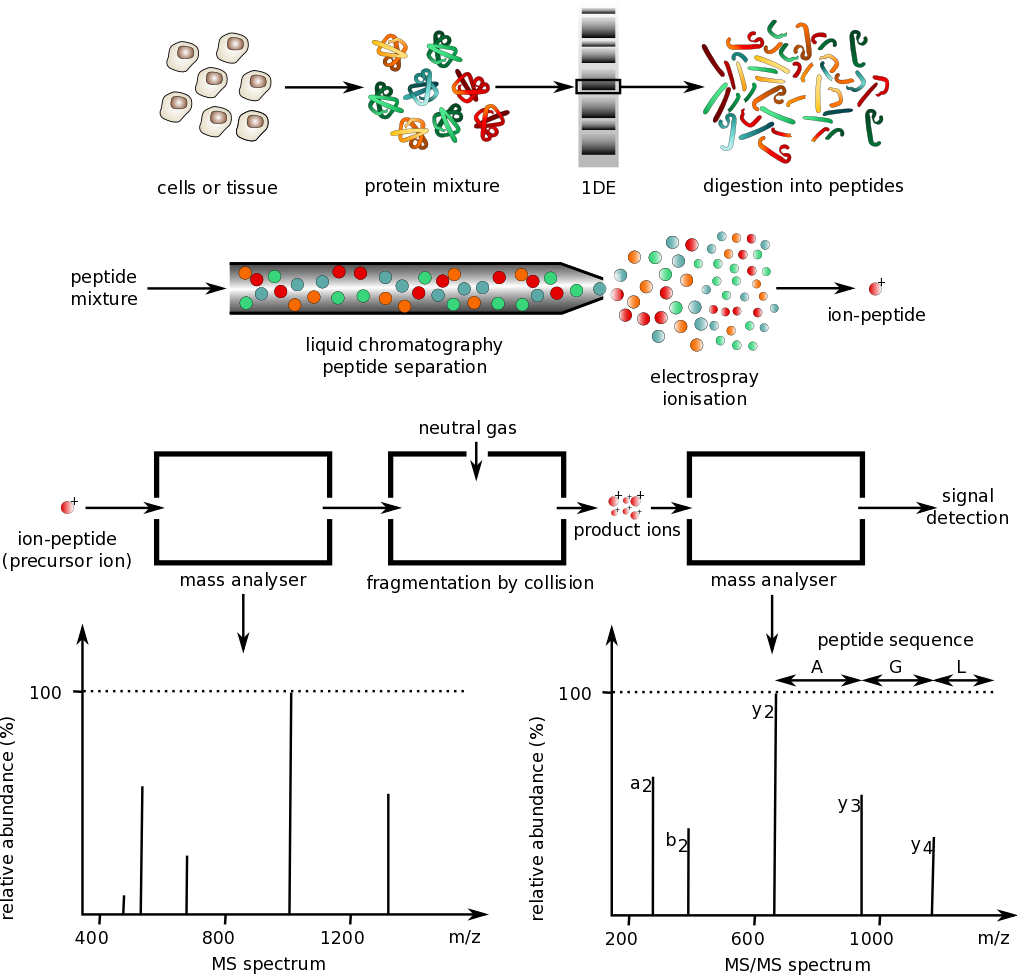
Though you don't need to learn all these techniques for the MCAT, you should be familiar with the types of analyses that can be applied to protein studies.