Extraction depends on distribution between phases; distillation depends on different vapor compositions.
Use distribution and acid–base chemistry
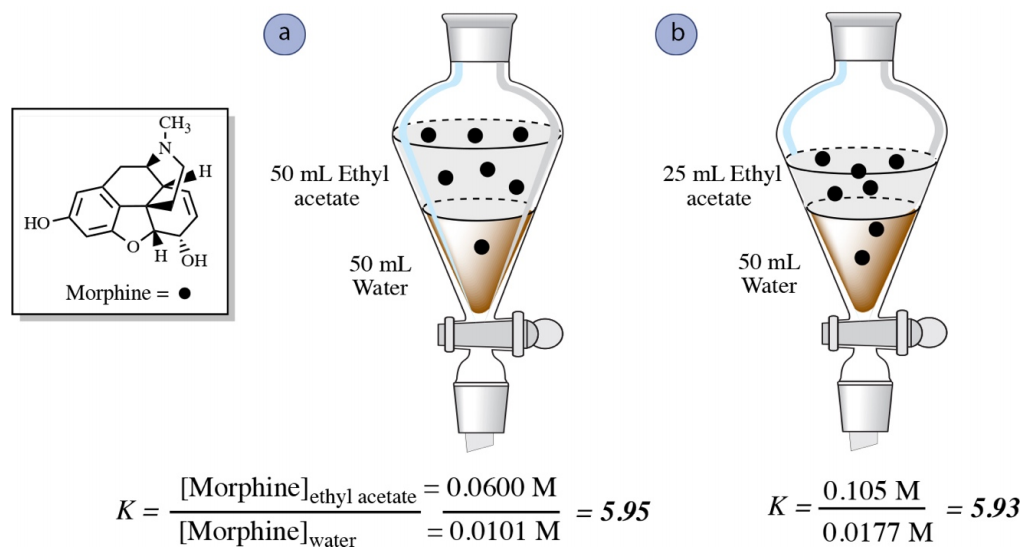
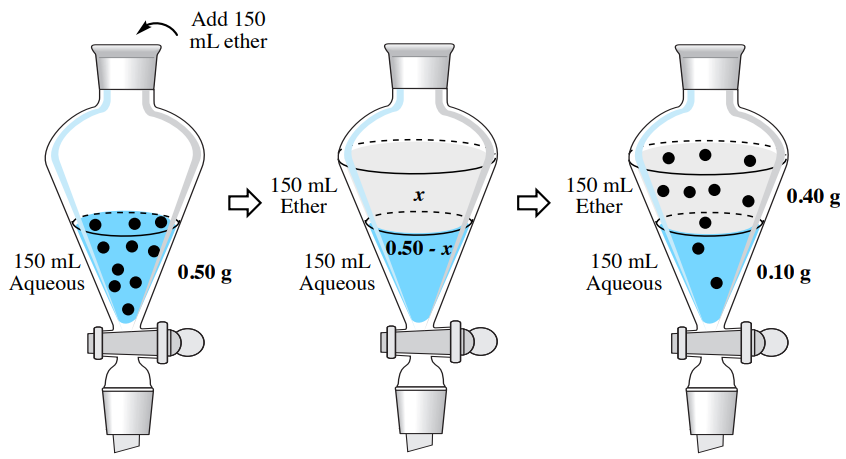
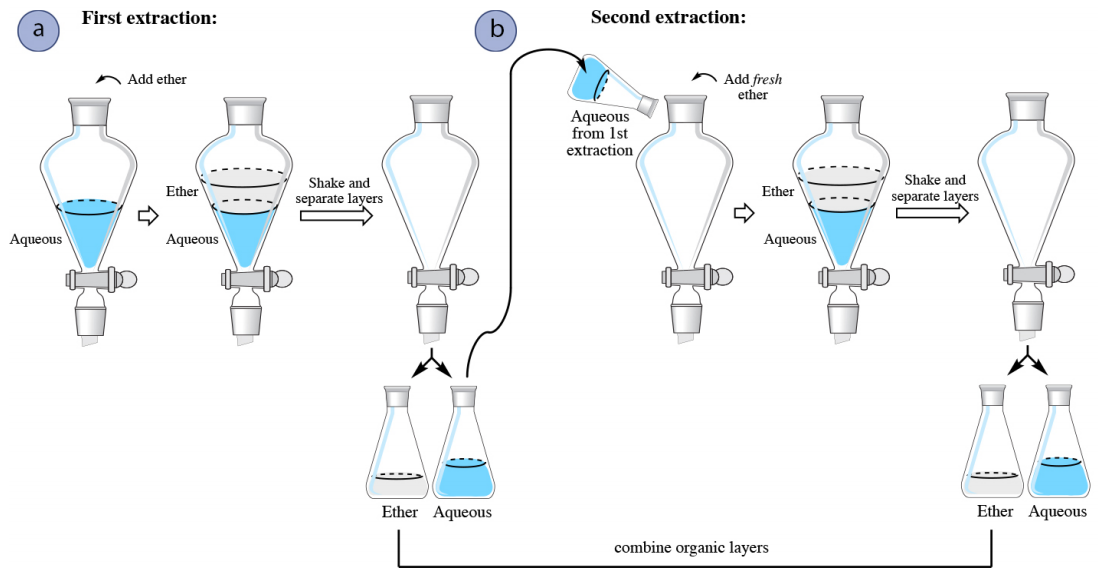
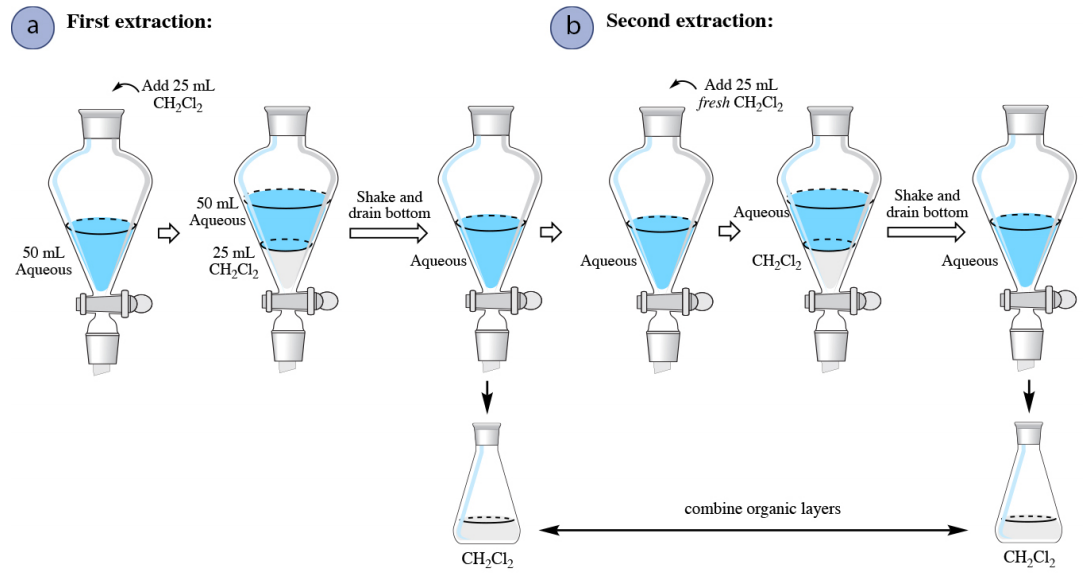
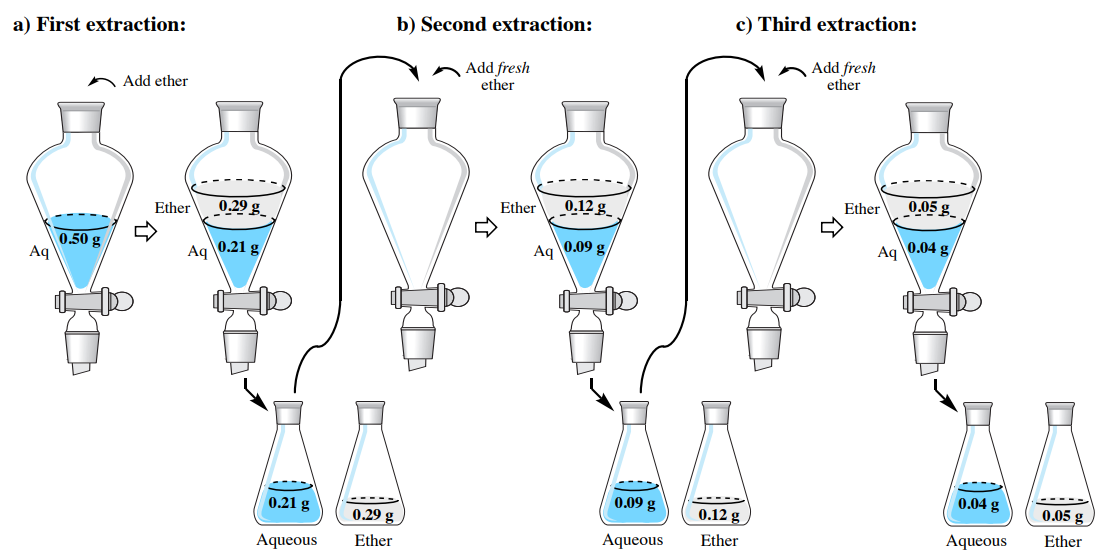
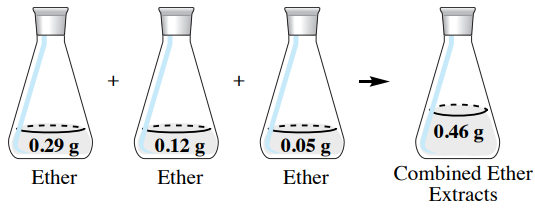
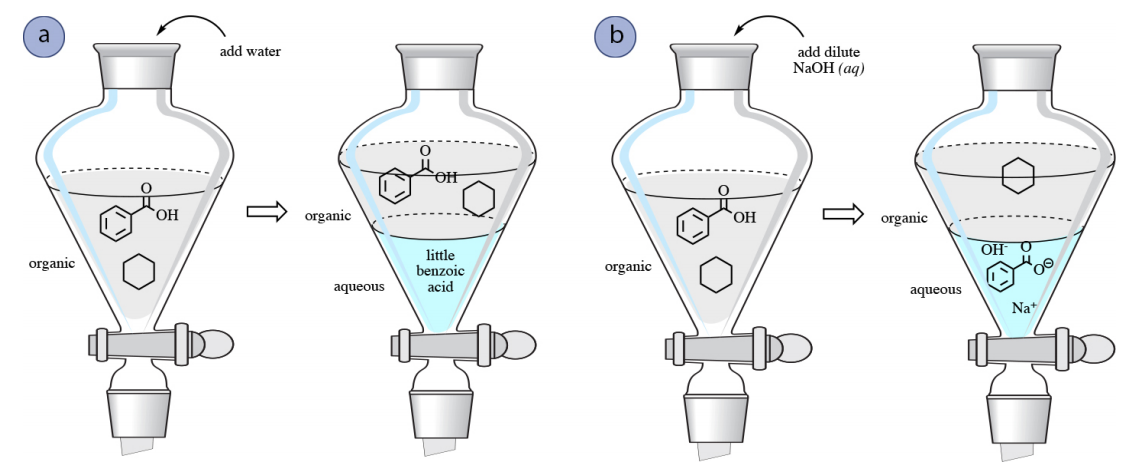
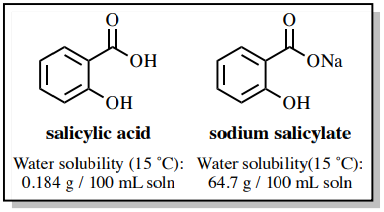
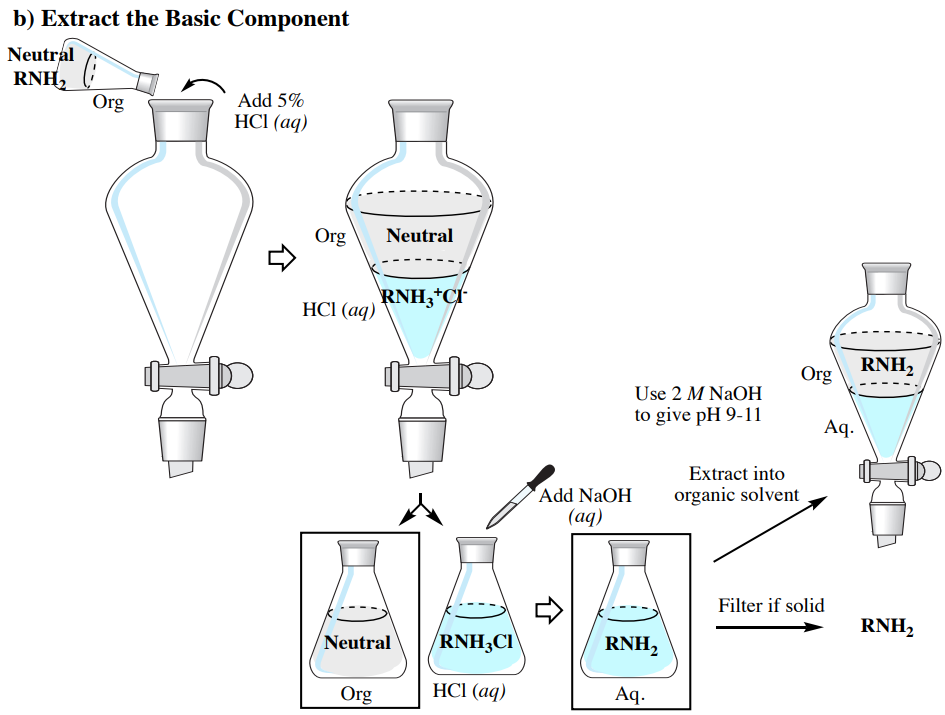
For a neutral solute, a distribution coefficient K = Corganic/Caqueous describes equilibrium between immiscible solvents at fixed conditions. The fraction remaining in the aqueous phase after one extraction is Vaq/(Vaq + KVorg) when K remains constant. Repeated smaller fresh-solvent extractions usually recover more than one extraction with the same total solvent volume. Protonating an amine or deprotonating a carboxylic acid can trap it in water as an ion; neutralizing later allows back-extraction. Identify the upper layer by density, not by assuming every organic solvent floats.
Source: 1.2 Phases and Classification of Matter · 11.3 Solubility · 10.2 Properties of Liquids · 4.5: Extraction Theory · 4.8: Acid-Base Extraction · 5.3A: Theory of Fractional Distillation
Use relative volatility and pressure
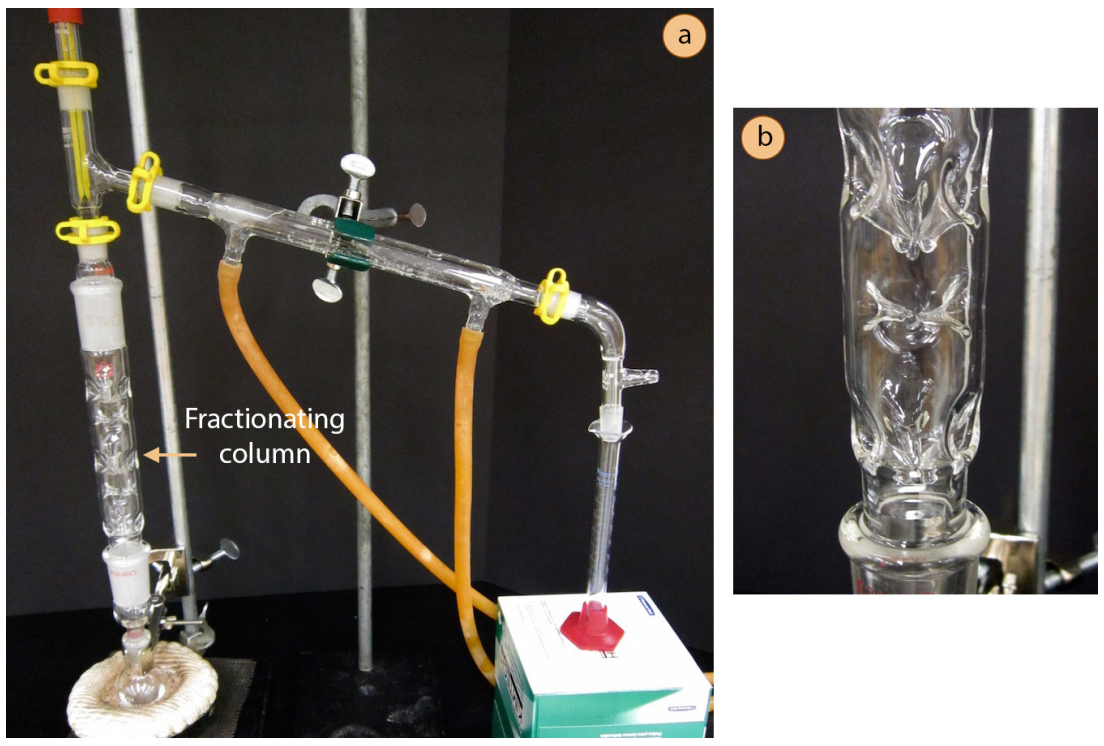
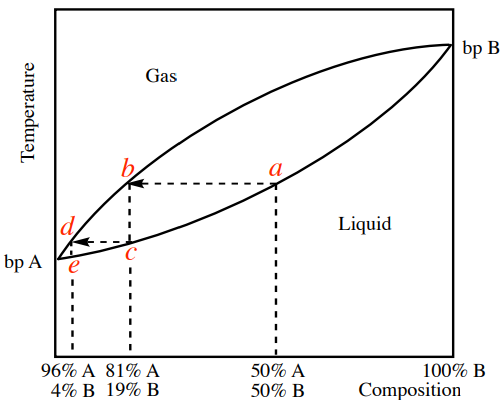
Distillation enriches a vapor in the more volatile component of a liquid mixture. Simple distillation is appropriate for a volatile liquid separated from nonvolatile material or for widely separated boiling points. Fractional distillation repeatedly equilibrates liquid and vapor in a column to improve separation of closer boiling components. Reduced-pressure distillation lowers boiling temperature for heat-sensitive or high-boiling substances. Steam distillation can carry volatile, water-immiscible substances because their vapor pressures add. An azeotrope has matching liquid and vapor compositions at a particular condition, limiting ordinary fractional separation.
Source: 1.2 Phases and Classification of Matter · 11.3 Solubility · 10.2 Properties of Liquids · 4.5: Extraction Theory · 4.8: Acid-Base Extraction · 5.3A: Theory of Fractional Distillation
Apply it
Try before revealing the answer. A neutral solute has Korganic/aqueous = 4 in 100 mL water. Compare one 100 mL organic extraction with two fresh 50 mL extractions.
Worked answer
One extraction leaves fraction 100/(100 + 4×100) = 1/5, recovering 80%. Each 50 mL extraction leaves fraction 100/(100 + 4×50) = 1/3. Two leave (1/3)² = 1/9, recovering 88.9%. This assumes equilibrium, negligible volume change, and no ionization or reaction.
Source: 1.2 Phases and Classification of Matter · 11.3 Solubility · 10.2 Properties of Liquids · 4.5: Extraction Theory · 4.8: Acid-Base Extraction · 5.3A: Theory of Fractional Distillation
1.2 Phases and Classification of Matter — figures and tables
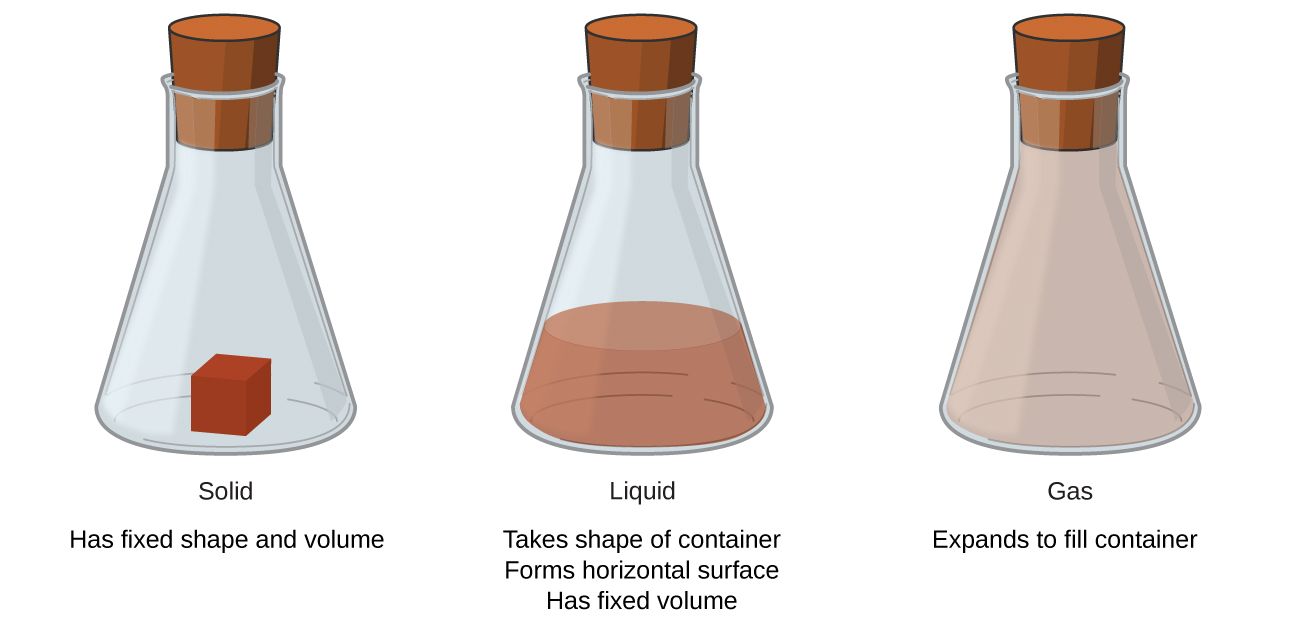
Figure 1.6 The three most common states or phases of matter are solid, liquid, and gas.
Paul Flowers, Klaus Theopold, Richard Langley, and William R. Robinson, Chemistry 2E, OpenStax. · CC BY-NC-SA 4.0 · Original image ↗ · Access for free ↗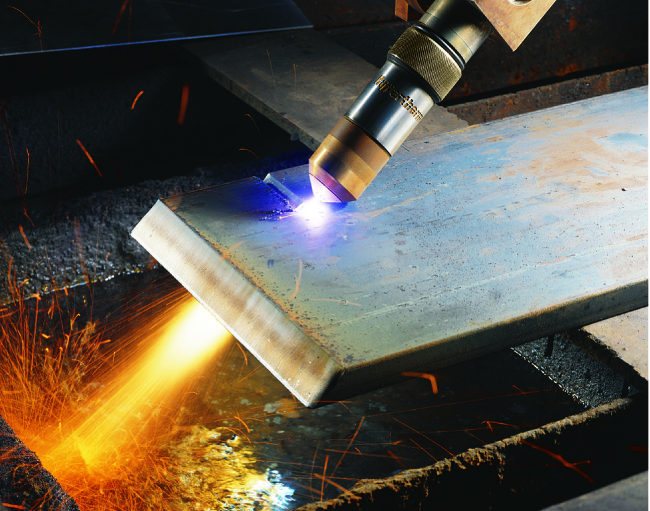
Figure 1.7 A plasma torch can be used to cut metal. (credit: “Hypertherm”/Wikimedia Commons)
Paul Flowers, Klaus Theopold, Richard Langley, and William R. Robinson, Chemistry 2E, OpenStax. (credit: “Hypertherm”/Wikimedia Commons) · CC BY-NC-SA 4.0 · Original image ↗ · Access for free ↗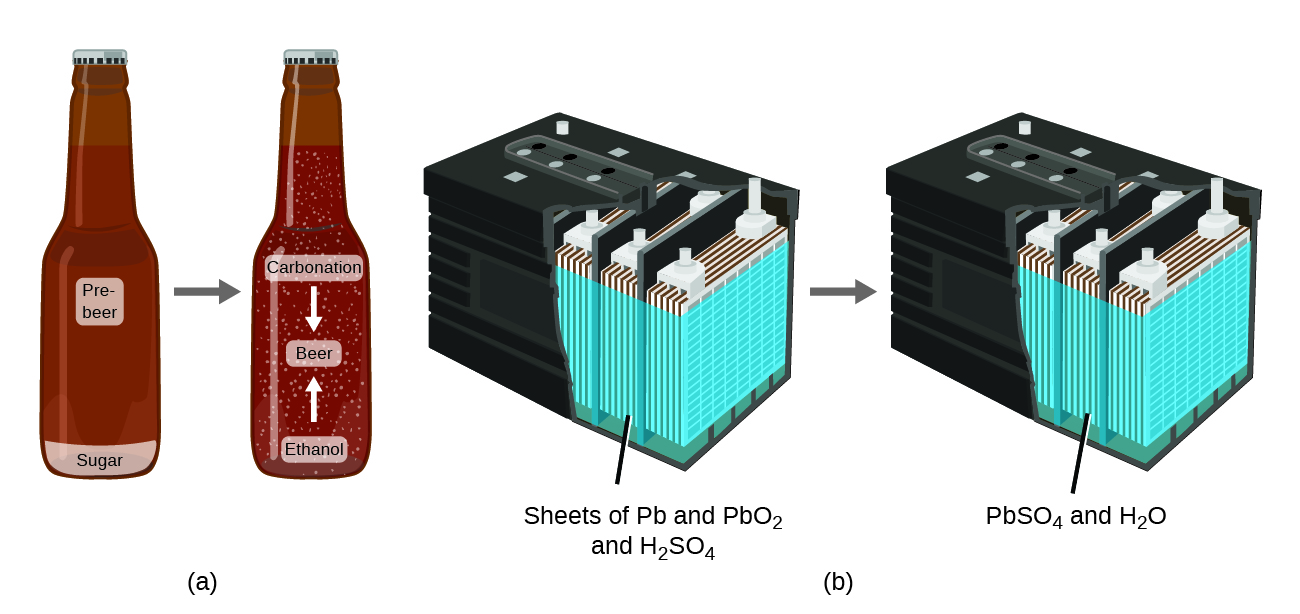
Figure 1.8 (a) The mass of beer precursor materials is the same as the mass of beer produced: Sugar has become alcohol and carbon dioxide. (b) The mass of the lead, lead oxide, and sulfuric acid consumed by the production of electricity is exactly equal to the mass of lead sulfate and water that is formed.
Paul Flowers, Klaus Theopold, Richard Langley, and William R. Robinson, Chemistry 2E, OpenStax. · CC BY-NC-SA 4.0 · Original image ↗ · Access for free ↗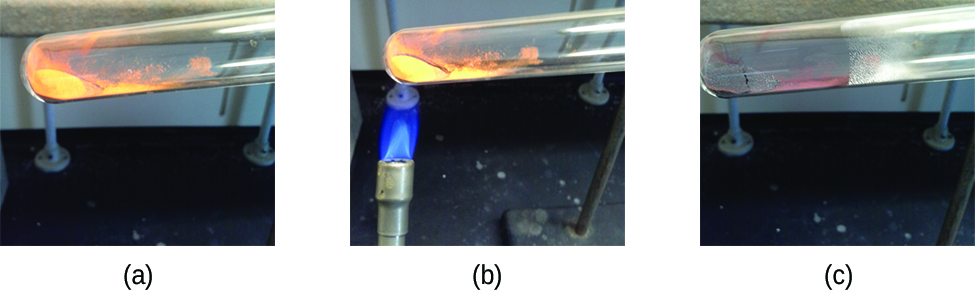
Figure 1.9 (a) The compound mercury(II) oxide, (b) when heated, (c) decomposes into silvery droplets of liquid mercury and invisible oxygen gas. (credit: modification of work by Paul Flowers)
Paul Flowers, Klaus Theopold, Richard Langley, and William R. Robinson, Chemistry 2E, OpenStax. (credit: modification of work by Paul Flowers) · CC BY-NC-SA 4.0 · Original image ↗ · Access for free ↗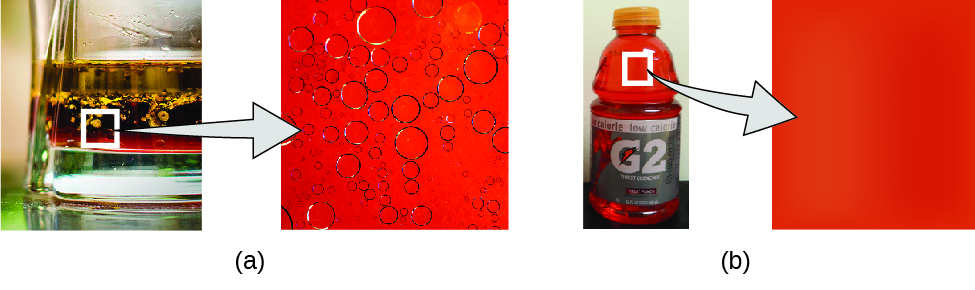
Figure 1.10 (a) Oil and vinegar salad dressing is a heterogeneous mixture because its composition is not uniform throughout. (b) A commercial sports drink is a homogeneous mixture because its composition is uniform throughout. (credit a “left”: modification of work by John Mayer; credit a “right”: modification of work by Umberto Salvagnin; credit b “left: modification of work by Jeff Bedford)
Paul Flowers, Klaus Theopold, Richard Langley, and William R. Robinson, Chemistry 2E, OpenStax. (credit a “left”: modification of work by John Mayer; credit a “right”: modification of work by Umberto Salvagnin; credit b “left: modification of work by Jeff Bedford) · CC BY-NC-SA 4.0 · Original image ↗ · Access for free ↗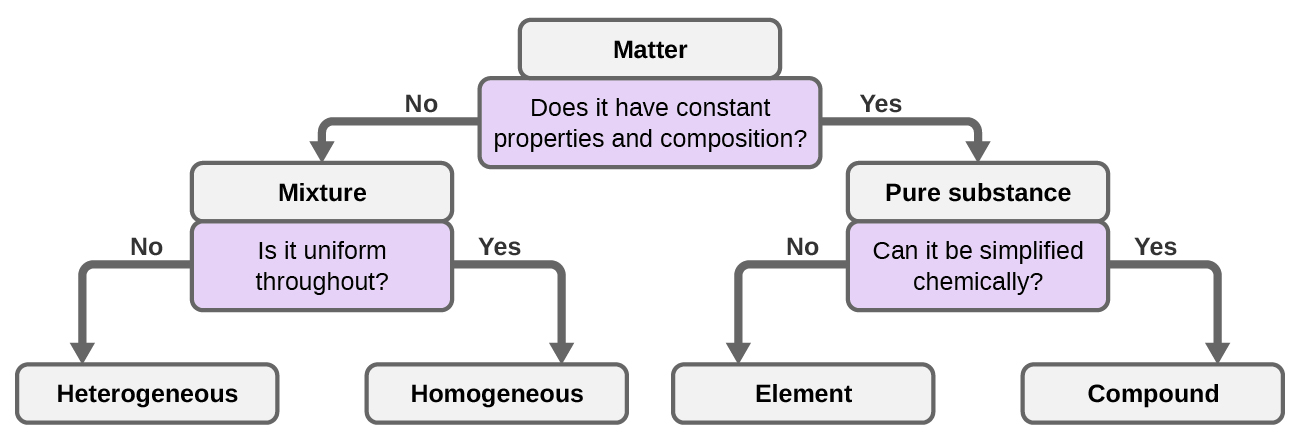
Figure 1.11 Depending on its properties, a given substance can be classified as a homogeneous mixture, a heterogeneous mixture, a compound, or an element.
Paul Flowers, Klaus Theopold, Richard Langley, and William R. Robinson, Chemistry 2E, OpenStax. · CC BY-NC-SA 4.0 · Original image ↗ · Access for free ↗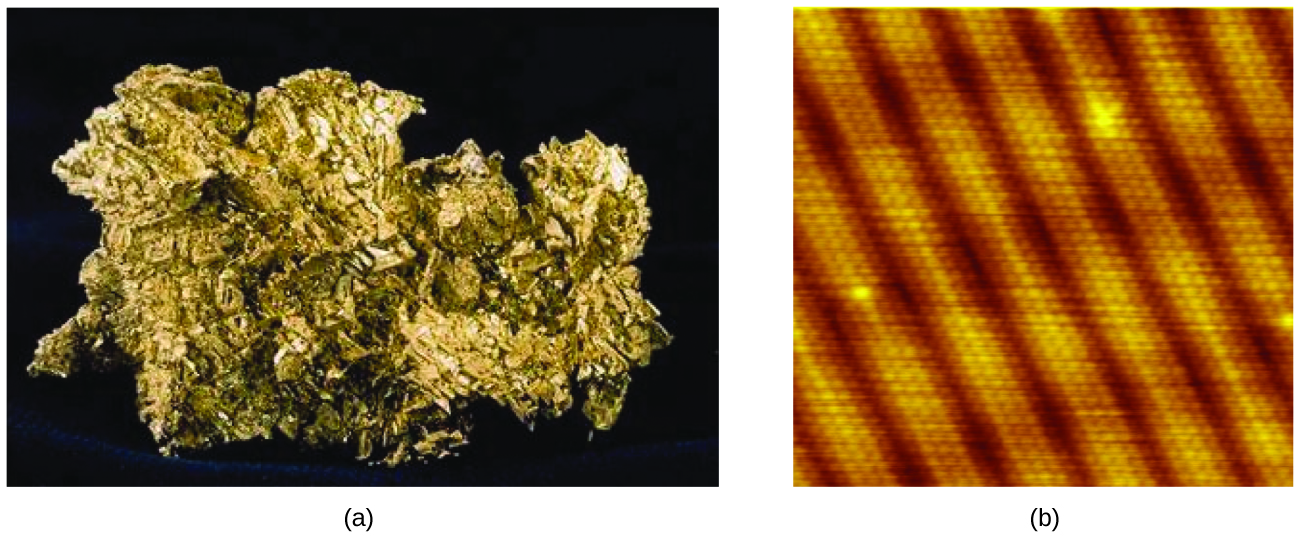
Figure 1.12 (a) This photograph shows a gold nugget. (b) A scanning-tunneling microscope (STM) can generate views of the surfaces of solids, such as this image of a gold crystal. Each sphere represents one gold atom. (credit a: modification of work by United States Geological Survey; credit b: modification of work by “Erwinrossen”/Wikimedia Commons)
Paul Flowers, Klaus Theopold, Richard Langley, and William R. Robinson, Chemistry 2E, OpenStax. (credit a: modification of work by United States Geological Survey; credit b: modification of work by “Erwinrossen”/Wikimedia Commons) · CC BY-NC-SA 4.0 · Original image ↗ · Access for free ↗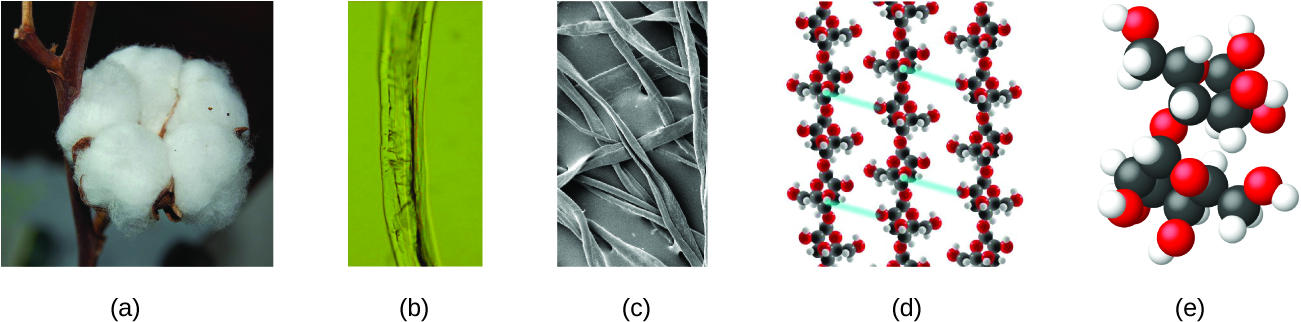
Figure 1.13 These images provide an increasingly closer view: (a) a cotton boll, (b) a single cotton fiber viewed under an optical microscope (magnified 40 times), (c) an image of a cotton fiber obtained with an electron microscope (much higher magnification than with the optical microscope); and (d and e) atomic-level models of the fiber (spheres of different colors represent atoms of different elements). (credit c: modification of work by “Featheredtar”/Wikimedia Commons)
Paul Flowers, Klaus Theopold, Richard Langley, and William R. Robinson, Chemistry 2E, OpenStax. (credit c: modification of work by “Featheredtar”/Wikimedia Commons) · CC BY-NC-SA 4.0 · Original image ↗ · Access for free ↗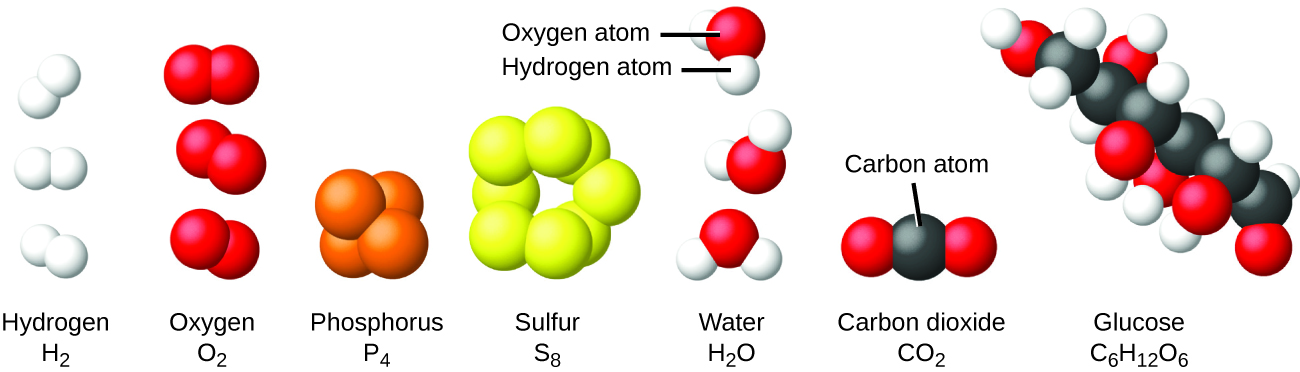
Figure 1.14 The elements hydrogen, oxygen, phosphorus, and sulfur form molecules consisting of two or more atoms of the same element. The compounds water, carbon dioxide, and glucose consist of combinations of atoms of different elements.
Paul Flowers, Klaus Theopold, Richard Langley, and William R. Robinson, Chemistry 2E, OpenStax. · CC BY-NC-SA 4.0 · Original image ↗ · Access for free ↗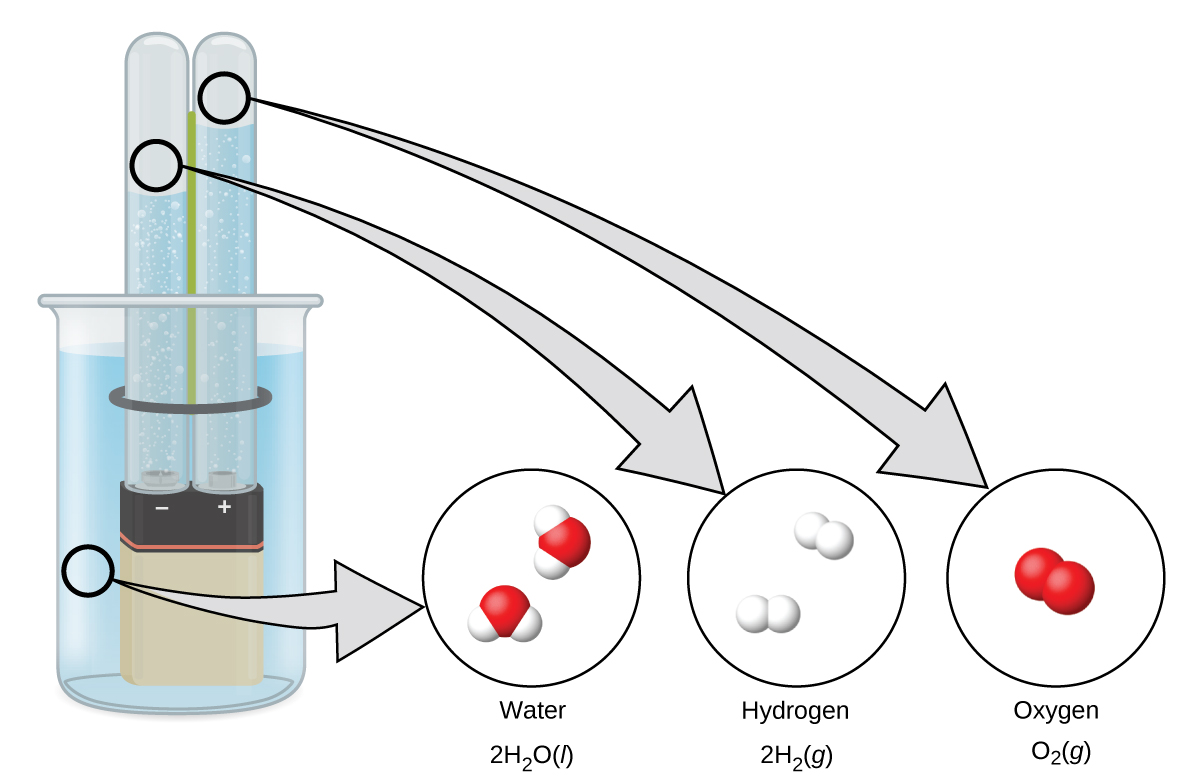
Figure 1.15 The decomposition of water is shown at the macroscopic, microscopic, and symbolic levels. The battery provides an electric current (microscopic) that decomposes water. At the macroscopic level, the liquid separates into the gases hydrogen (on the left) and oxygen (on the right). Symbolically, this change is presented by showing how liquid H 2 O separates into H 2 and O 2 gases.
Paul Flowers, Klaus Theopold, Richard Langley, and William R. Robinson, Chemistry 2E, OpenStax. · CC BY-NC-SA 4.0 · Original image ↗ · Access for free ↗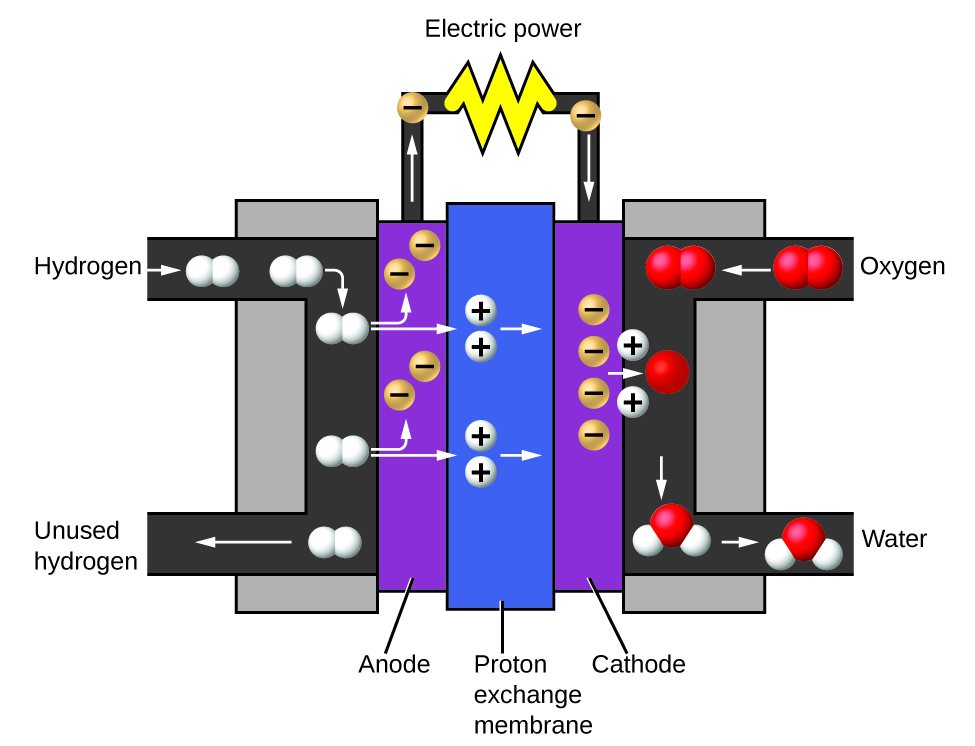
Figure 1.16 A fuel cell generates electrical energy from hydrogen and oxygen via an electrochemical process and produces only water as the waste product.
Paul Flowers, Klaus Theopold, Richard Langley, and William R. Robinson, Chemistry 2E, OpenStax. · CC BY-NC-SA 4.0 · Original image ↗ · Access for free ↗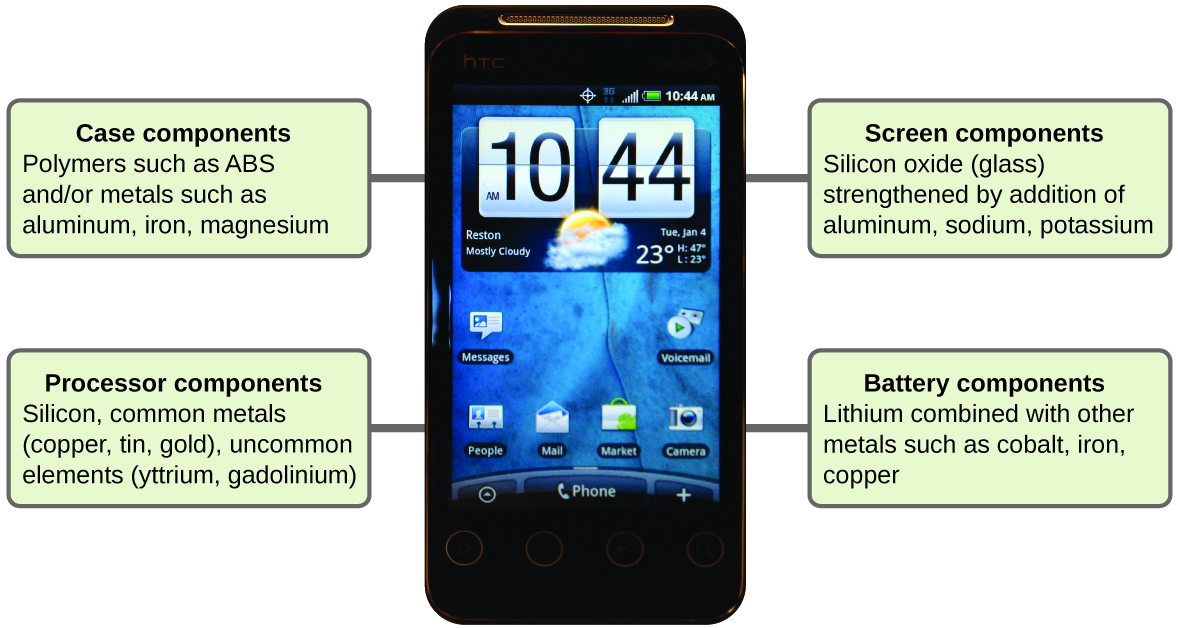
Figure 1.17 Almost one-third of naturally occurring elements are used to make a cell phone. (credit: modification of work by John Taylor)
Paul Flowers, Klaus Theopold, Richard Langley, and William R. Robinson, Chemistry 2E, OpenStax. (credit: modification of work by John Taylor) · CC BY-NC-SA 4.0 · Original image ↗ · Access for free ↗| Element | Symbol | Percent Mass | Element | Symbol | Percent Mass |
|---|---|---|---|---|---|
| oxygen | O | 49.20 | chlorine | Cl | 0.19 |
| silicon | Si | 25.67 | phosphorus | P | 0.11 |
| aluminum | Al | 7.50 | manganese | Mn | 0.09 |
| iron | Fe | 4.71 | carbon | C | 0.08 |
| calcium | Ca | 3.39 | sulfur | S | 0.06 |
| sodium | Na | 2.63 | barium | Ba | 0.04 |
| potassium | K | 2.40 | nitrogen | N | 0.03 |
| magnesium | Mg | 1.93 | fluorine | F | 0.03 |
| hydrogen | H | 0.87 | strontium | Sr | 0.02 |
| titanium | Ti | 0.58 | all others | - | 0.47 |
Table 1.1. Paul Flowers, Klaus Theopold, Richard Langley, and William R. Robinson, Chemistry 2E, OpenStax.
11.3 Solubility — figures and tables
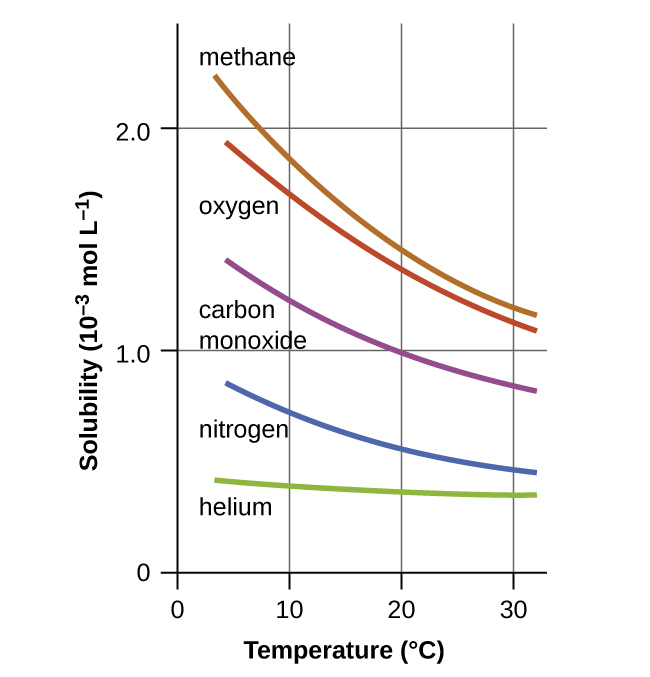
Figure 11.8 The solubilities of these gases in water decrease as the temperature increases. All solubilities were measured with a constant pressure of 101.3 kPa (1 atm) of gas above the solutions.
Paul Flowers, Klaus Theopold, Richard Langley, and William R. Robinson, Chemistry 2E, OpenStax. · CC BY-NC-SA 4.0 · Original image ↗ · Access for free ↗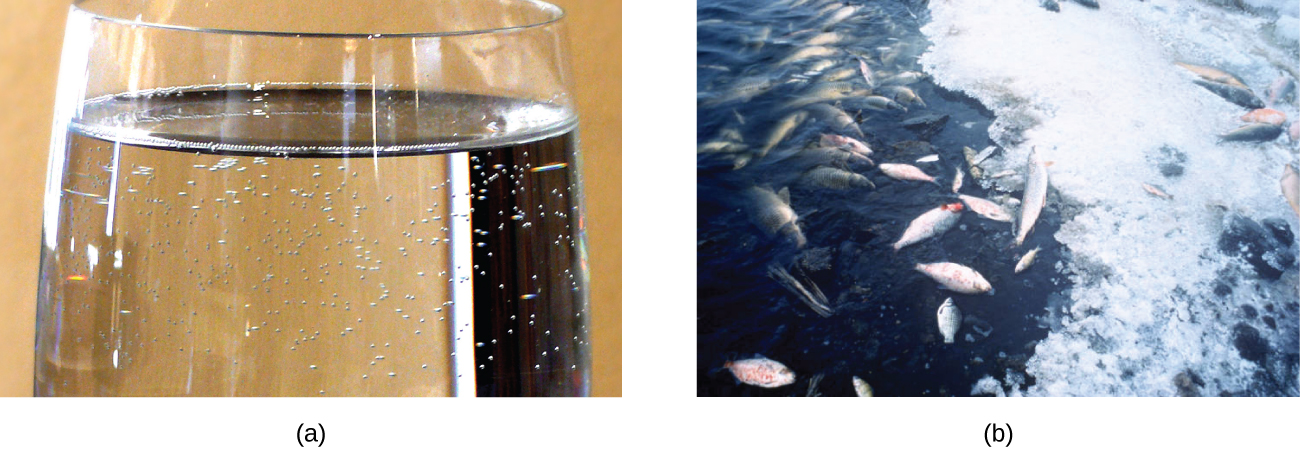
Figure 11.9 (a) The small bubbles of air in this glass of chilled water formed when the water warmed to room temperature and the solubility of its dissolved air decreased. (b) The decreased solubility of oxygen in natural waters subjected to thermal pollution can result in large-scale fish kills. (credit a: modification of work by Liz West; credit b: modification of work by U.S. Fish and Wildlife Service)
Paul Flowers, Klaus Theopold, Richard Langley, and William R. Robinson, Chemistry 2E, OpenStax. (credit a: modification of work by Liz West; credit b: modification of work by U.S. Fish and Wildlife Service) · CC BY-NC-SA 4.0 · Original image ↗ · Access for free ↗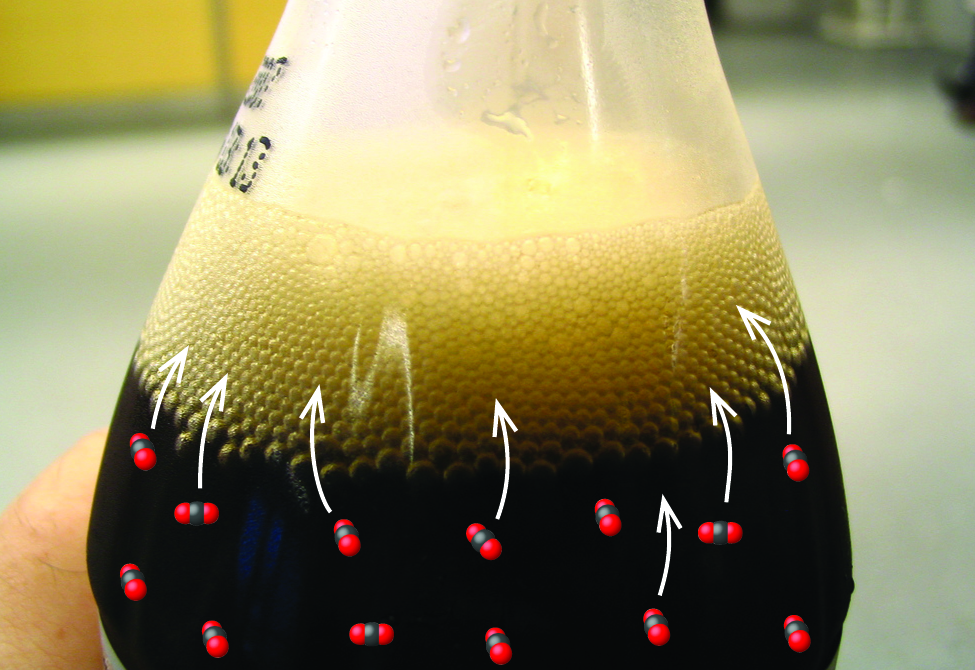
Figure 11.10 Opening the bottle of carbonated beverage reduces the pressure of the gaseous carbon dioxide above the beverage. The solubility of CO 2 is thus lowered, and some dissolved carbon dioxide may be seen leaving the solution as small gas bubbles. (credit: modification of work by Derrick Coetzee)
Paul Flowers, Klaus Theopold, Richard Langley, and William R. Robinson, Chemistry 2E, OpenStax. (credit: modification of work by Derrick Coetzee) · CC BY-NC-SA 4.0 · Original image ↗ · Access for free ↗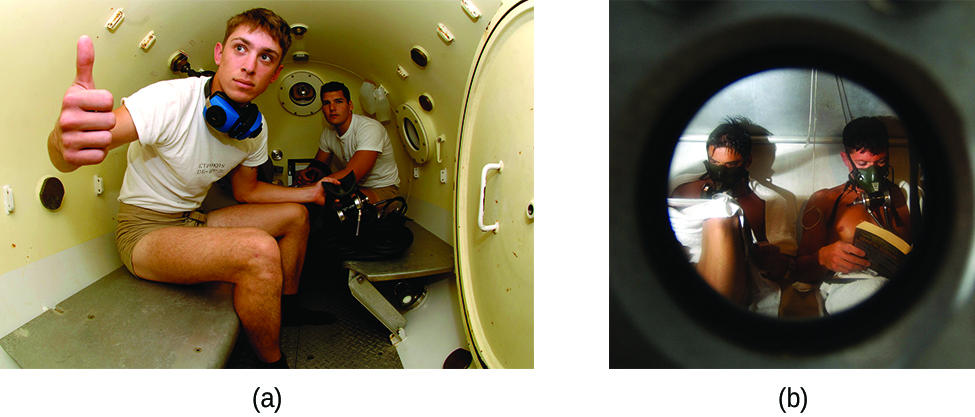
Figure 11.11 (a) US Navy divers undergo training in a recompression chamber. (b) Divers receive hyperbaric oxygen therapy.
Paul Flowers, Klaus Theopold, Richard Langley, and William R. Robinson, Chemistry 2E, OpenStax. · CC BY-NC-SA 4.0 · Original image ↗ · Access for free ↗
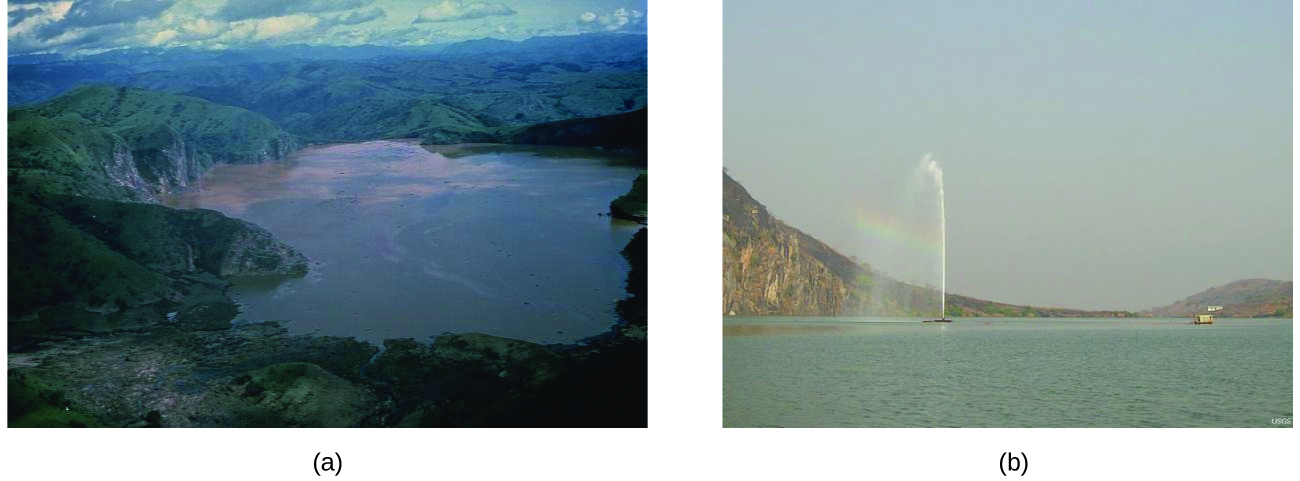
Figure 11.12 (a) It is believed that the 1986 disaster that killed more than 1700 people near Lake Nyos in Cameroon resulted when a large volume of carbon dioxide gas was released from the lake. (b) A CO 2 vent has since been installed to help outgas the lake in a slow, controlled fashion and prevent a similar catastrophe from happening in the future. (credit a: modification of work by Jack Lockwood; credit b: modification of work by Bill Evans)
Paul Flowers, Klaus Theopold, Richard Langley, and William R. Robinson, Chemistry 2E, OpenStax. (credit a: modification of work by Jack Lockwood; credit b: modification of work by Bill Evans) · CC BY-NC-SA 4.0 · Original image ↗ · Access for free ↗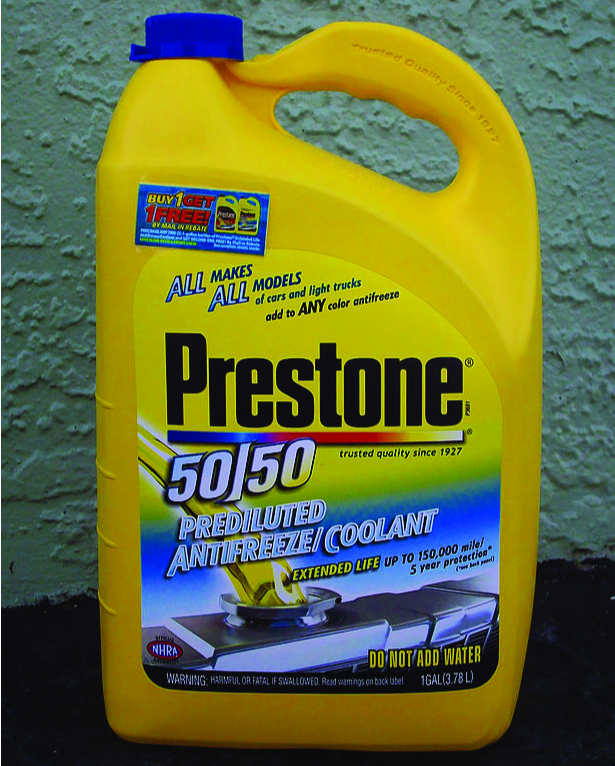
Figure 11.13 Water and antifreeze are miscible; mixtures of the two are homogeneous in all proportions. (credit: “dno1967”/Wikimedia commons)
Paul Flowers, Klaus Theopold, Richard Langley, and William R. Robinson, Chemistry 2E, OpenStax. (credit: “dno1967”/Wikimedia commons) · CC BY-NC-SA 4.0 · Original image ↗ · Access for free ↗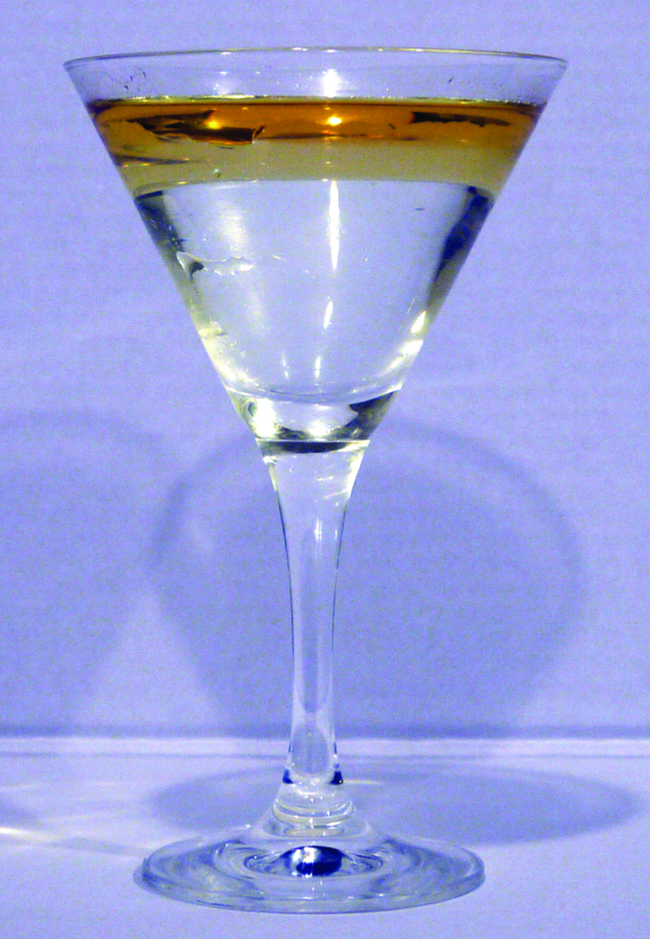
Figure 11.14 Water and oil are immiscible. Mixtures of these two substances will form two separate layers with the less dense oil floating on top of the water. (credit: “Yortw”/Flickr)
Paul Flowers, Klaus Theopold, Richard Langley, and William R. Robinson, Chemistry 2E, OpenStax. (credit: “Yortw”/Flickr) · CC BY-NC-SA 4.0 · Original image ↗ · Access for free ↗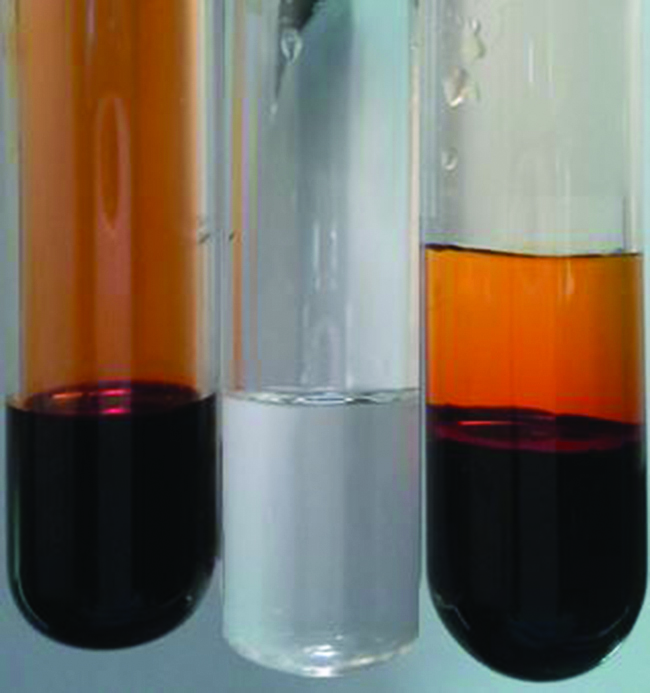
Figure 11.15 Bromine (the deep orange liquid on the left) and water (the clear liquid in the middle) are partially miscible. The top layer in the mixture on the right is a saturated solution of bromine in water; the bottom layer is a saturated solution of water in bromine. (credit: Paul Flowers)
Paul Flowers, Klaus Theopold, Richard Langley, and William R. Robinson, Chemistry 2E, OpenStax. (credit: Paul Flowers) · CC BY-NC-SA 4.0 · Original image ↗ · Access for free ↗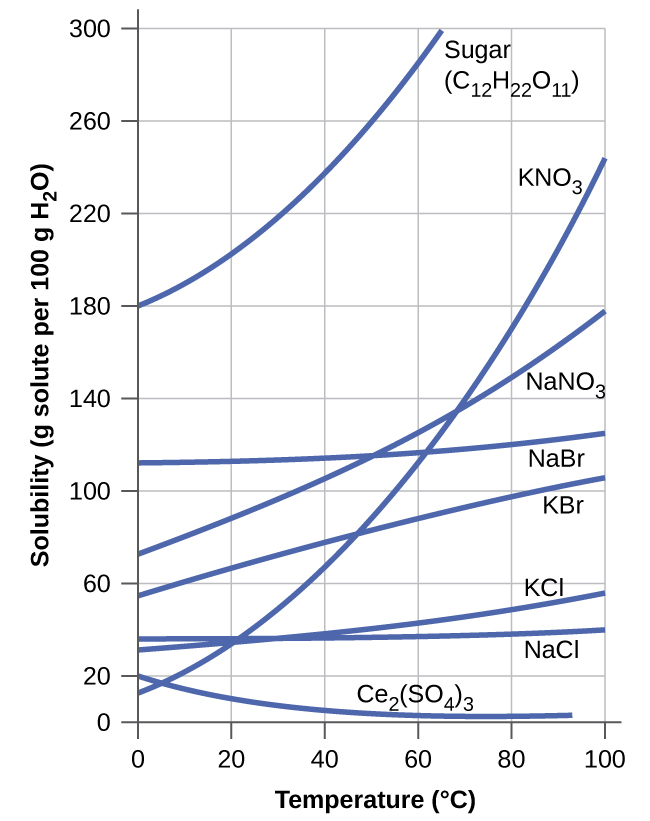
Figure 11.16 This graph shows how the solubility of several solids changes with temperature.
Paul Flowers, Klaus Theopold, Richard Langley, and William R. Robinson, Chemistry 2E, OpenStax. · CC BY-NC-SA 4.0 · Original image ↗ · Access for free ↗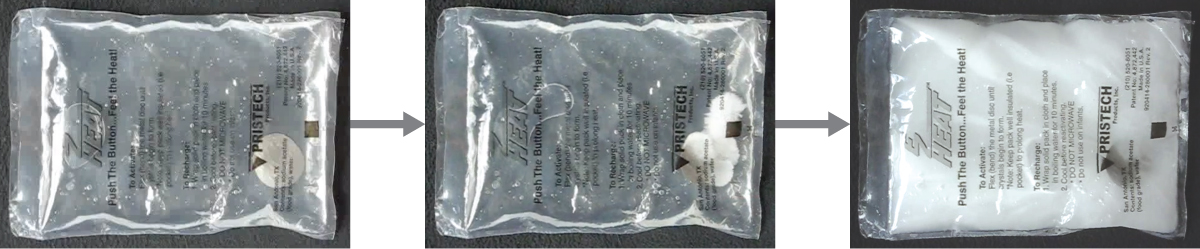
Figure 11.17 This hand warmer produces heat when the sodium acetate in a supersaturated solution precipitates. Precipitation of the solute is initiated by a mechanical shockwave generated when the flexible metal disk within the solution is “clicked.” (credit: modification of work by “Velela”/Wikimedia Commons)
Paul Flowers, Klaus Theopold, Richard Langley, and William R. Robinson, Chemistry 2E, OpenStax. (credit: modification of work by “Velela”/Wikimedia Commons) · CC BY-NC-SA 4.0 · Original image ↗ · Access for free ↗Source: 11.3 Solubility
10.2 Properties of Liquids — figures and tables
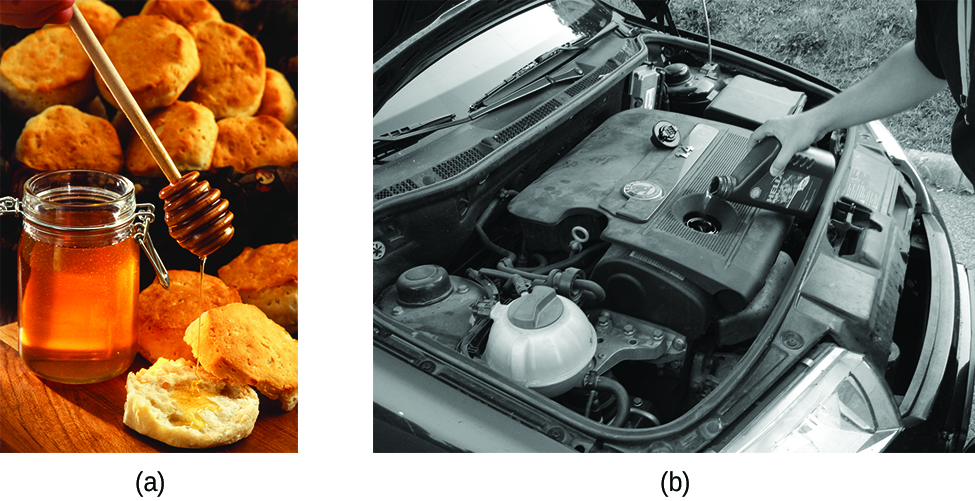
Figure 10.15 (a) Honey and (b) motor oil are examples of liquids with high viscosities; they flow slowly. (credit a: modification of work by Scott Bauer; credit b: modification of work by David Nagy)
Paul Flowers, Klaus Theopold, Richard Langley, and William R. Robinson, Chemistry 2E, OpenStax. (credit a: modification of work by Scott Bauer; credit b: modification of work by David Nagy) · CC BY-NC-SA 4.0 · Original image ↗ · Access for free ↗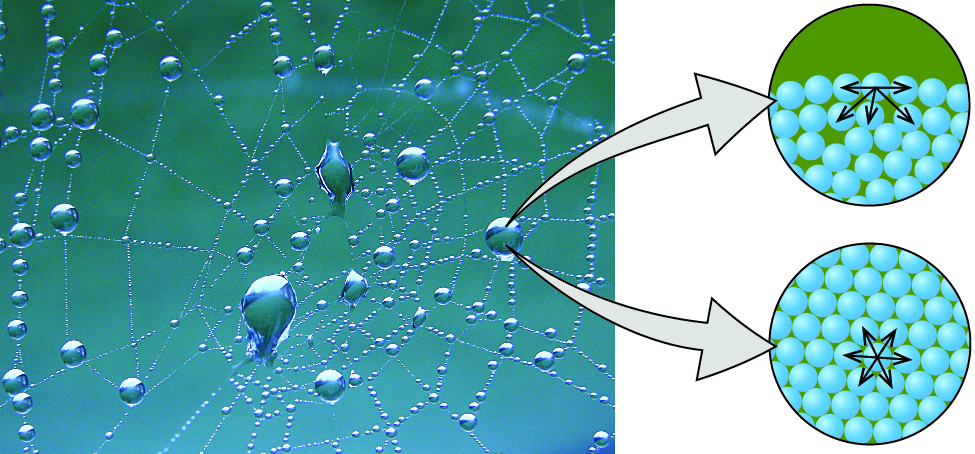
Figure 10.16 Attractive forces result in a spherical water drop that minimizes surface area; cohesive forces hold the sphere together; adhesive forces keep the drop attached to the web. (credit photo: modification of work by “OliBac”/Flickr)
Paul Flowers, Klaus Theopold, Richard Langley, and William R. Robinson, Chemistry 2E, OpenStax. (credit photo: modification of work by “OliBac”/Flickr) · CC BY-NC-SA 4.0 · Original image ↗ · Access for free ↗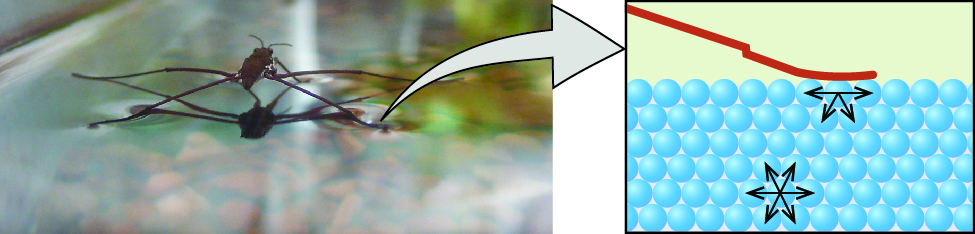
Figure 10.17 Surface tension (right) prevents this insect, a “water strider,” from sinking into the water.
Paul Flowers, Klaus Theopold, Richard Langley, and William R. Robinson, Chemistry 2E, OpenStax. · CC BY-NC-SA 4.0 · Original image ↗ · Access for free ↗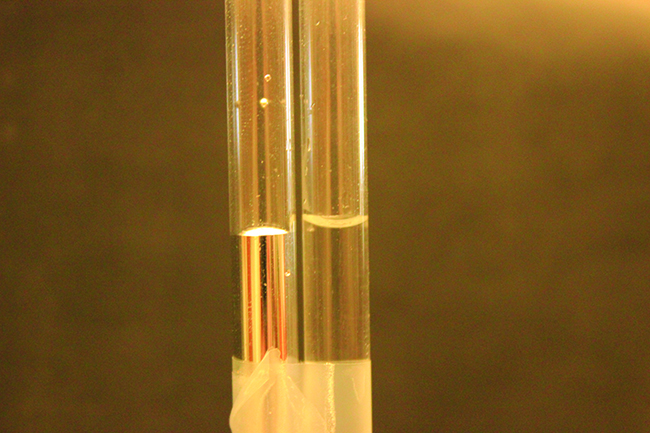
Figure 10.18 Differences in the relative strengths of cohesive and adhesive forces result in different meniscus shapes for mercury (left) and water (right) in glass tubes. (credit: Mark Ott)
Paul Flowers, Klaus Theopold, Richard Langley, and William R. Robinson, Chemistry 2E, OpenStax. (credit: Mark Ott) · CC BY-NC-SA 4.0 · Original image ↗ · Access for free ↗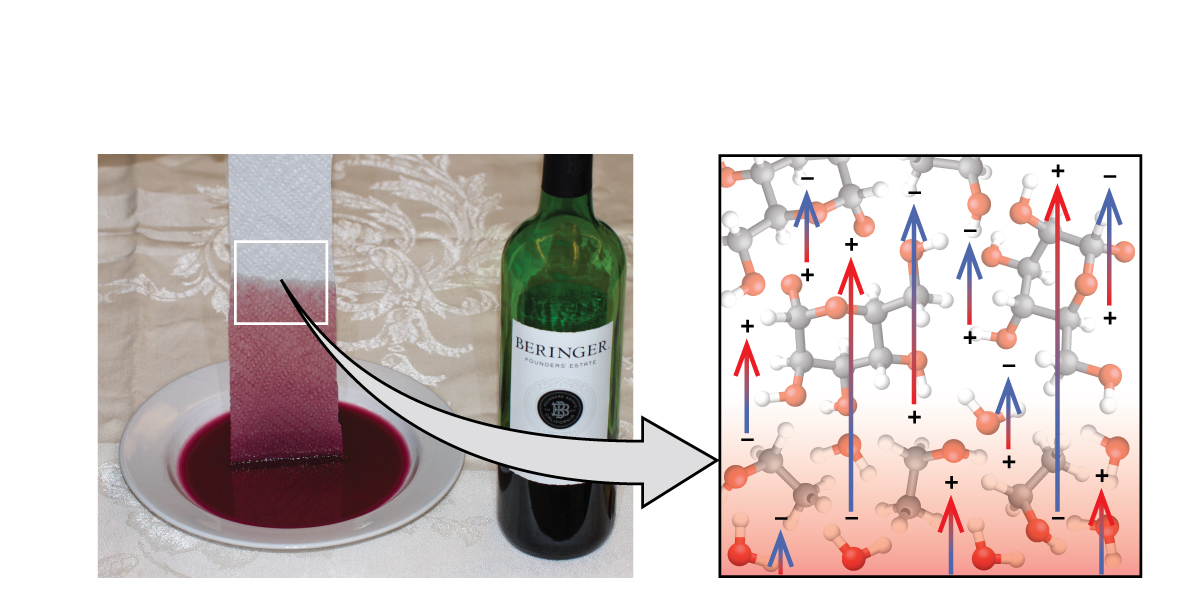
Figure 10.19 Wine wicks up a paper towel (left) because of the strong attractions of water (and ethanol) molecules to the −OH groups on the towel’s cellulose fibers and the strong attractions of water molecules to other water (and ethanol) molecules (right). (credit photo: modification of work by Mark Blaser)
Paul Flowers, Klaus Theopold, Richard Langley, and William R. Robinson, Chemistry 2E, OpenStax. (credit photo: modification of work by Mark Blaser) · CC BY-NC-SA 4.0 · Original image ↗ · Access for free ↗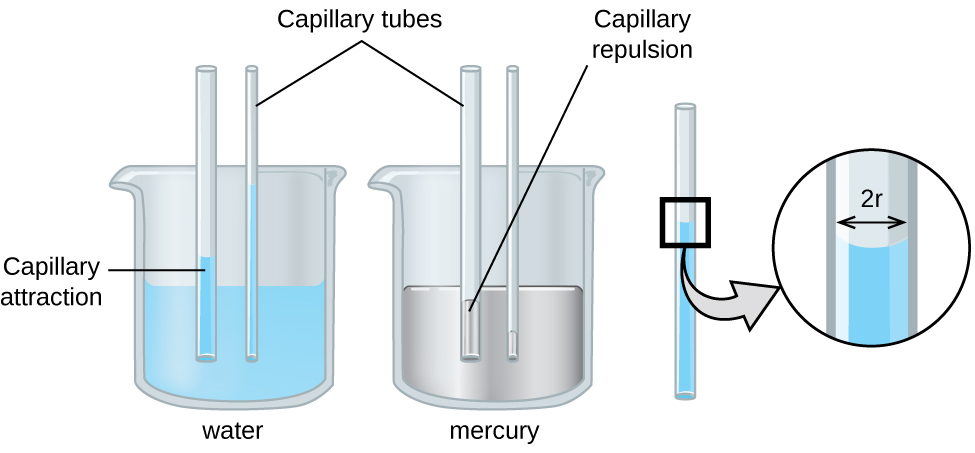
Figure 10.20 Depending upon the relative strengths of adhesive and cohesive forces, a liquid may rise (such as water) or fall (such as mercury) in a glass capillary tube. The extent of the rise (or fall) is directly proportional to the surface tension of the liquid and inversely proportional to the density of the liquid and the radius of the tube.
Paul Flowers, Klaus Theopold, Richard Langley, and William R. Robinson, Chemistry 2E, OpenStax. · CC BY-NC-SA 4.0 · Original image ↗ · Access for free ↗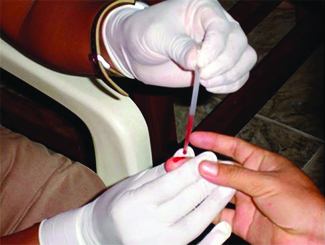
Figure 10.21 Blood is collected for medical analysis by capillary action, which draws blood into a small diameter glass tube. (credit: modification of work by Centers for Disease Control and Prevention)
Paul Flowers, Klaus Theopold, Richard Langley, and William R. Robinson, Chemistry 2E, OpenStax. (credit: modification of work by Centers for Disease Control and Prevention) · CC BY-NC-SA 4.0 · Original image ↗ · Access for free ↗| Substance | Formula | Viscosity (mPa·s) |
|---|---|---|
| water | H2O | 0.890 |
| mercury | Hg | 1.526 |
| ethanol | C2H5OH | 1.074 |
| octane | C8H18 | 0.508 |
| ethylene glycol | CH2(OH)CH2(OH) | 16.1 |
| honey | variable | ~2,000–10,000 |
| motor oil | variable | ~50–500 |
Table 10.2. Paul Flowers, Klaus Theopold, Richard Langley, and William R. Robinson, Chemistry 2E, OpenStax.
| Substance | Formula | Surface Tension (mN/m) |
|---|---|---|
| water | H2O | 71.99 |
| mercury | Hg | 458.48 |
| ethanol | C2H5OH | 21.97 |
| octane | C8H18 | 21.14 |
| ethylene glycol | CH2(OH)CH2(OH) | 47.99 |
Table 10.3. Paul Flowers, Klaus Theopold, Richard Langley, and William R. Robinson, Chemistry 2E, OpenStax.
Source: 10.2 Properties of Liquids
4.5: Extraction Theory — figures and tables
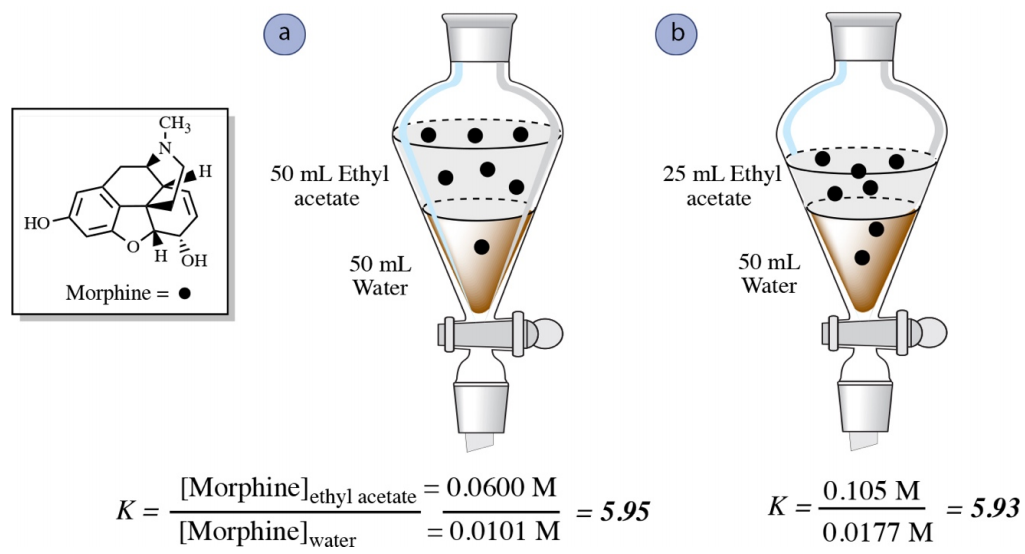
Figure 4.11: Distribution of morphine in ethyl acetate and water.
Lisa Nichols, Organic Chemistry Lab Techniques, Butte College, via Chemistry LibreTexts. · CC BY-NC-ND 4.0 · Original image ↗ · Access for free ↗
Figure 4.12: Caffeine
Lisa Nichols, Organic Chemistry Lab Techniques, Butte College, via Chemistry LibreTexts. · CC BY-NC-ND 4.0 · Original image ↗ · Access for free ↗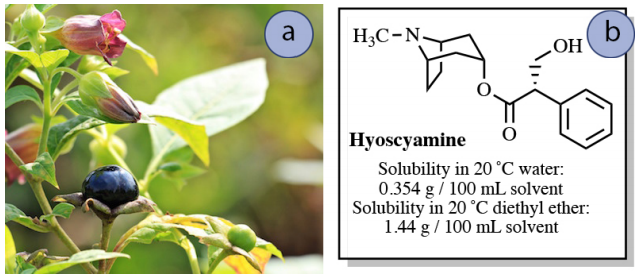
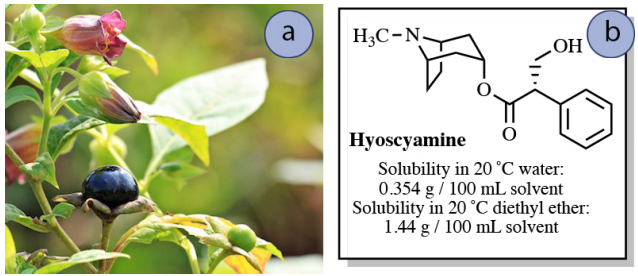
Figure 4.13: a) Deadly nightshade plant (photo public domain from pixabay.com), b) Solubility data for hyoscyamine (Ref. 2).
Lisa Nichols, Organic Chemistry Lab Techniques, Butte College, via Chemistry LibreTexts. · CC BY-NC-ND 4.0 · Original image ↗ · Access for free ↗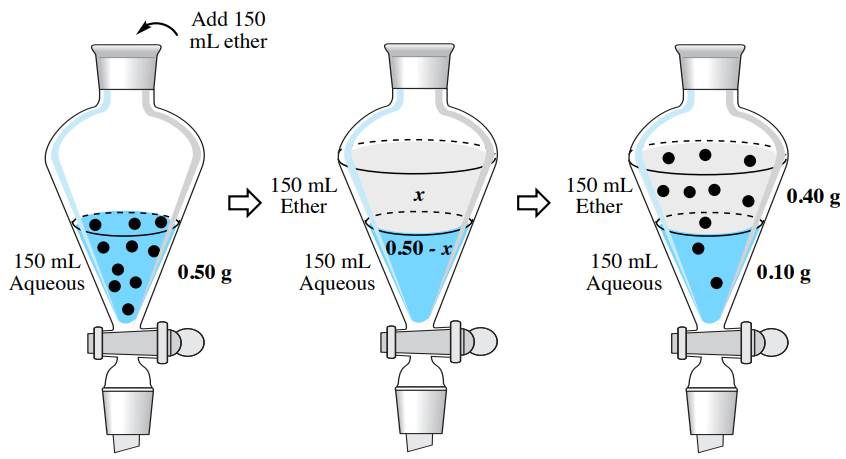
Figure 4.14: Single extraction of hyoscyamine from water into diethyl ether.
Lisa Nichols, Organic Chemistry Lab Techniques, Butte College, via Chemistry LibreTexts. · CC BY-NC-ND 4.0 · Original image ↗ · Access for free ↗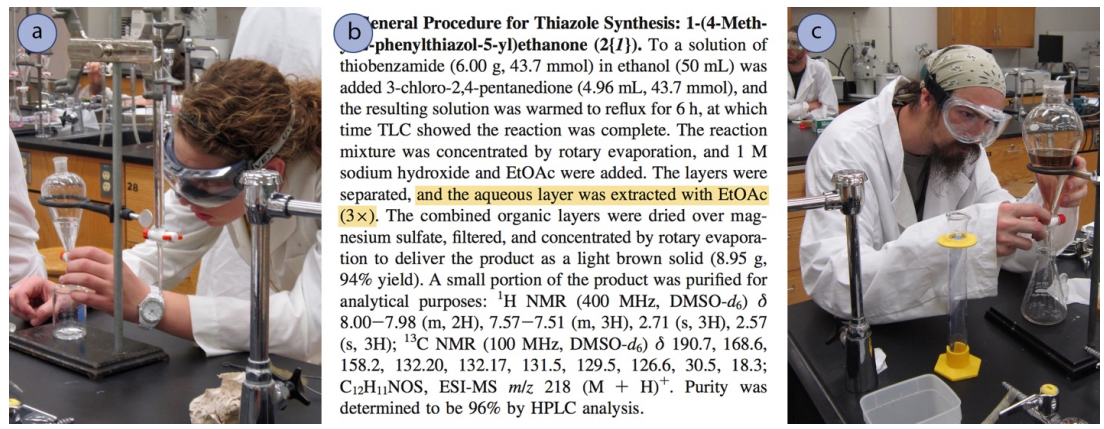
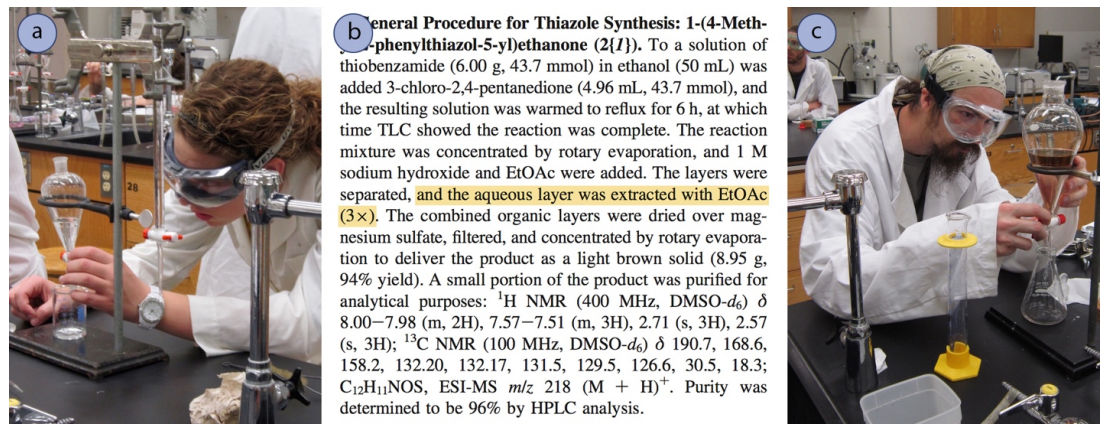
Figure 4.15: a+c) Students using a separatory funnel, b) Journal article from: K. A. Milinkevich, M. J. Kurth, J. Comb. Chem. 2008, 10, 521-525 .
Lisa Nichols, Organic Chemistry Lab Techniques, Butte College, via Chemistry LibreTexts. · CC BY-NC-ND 4.0 · Original image ↗ · Access for free ↗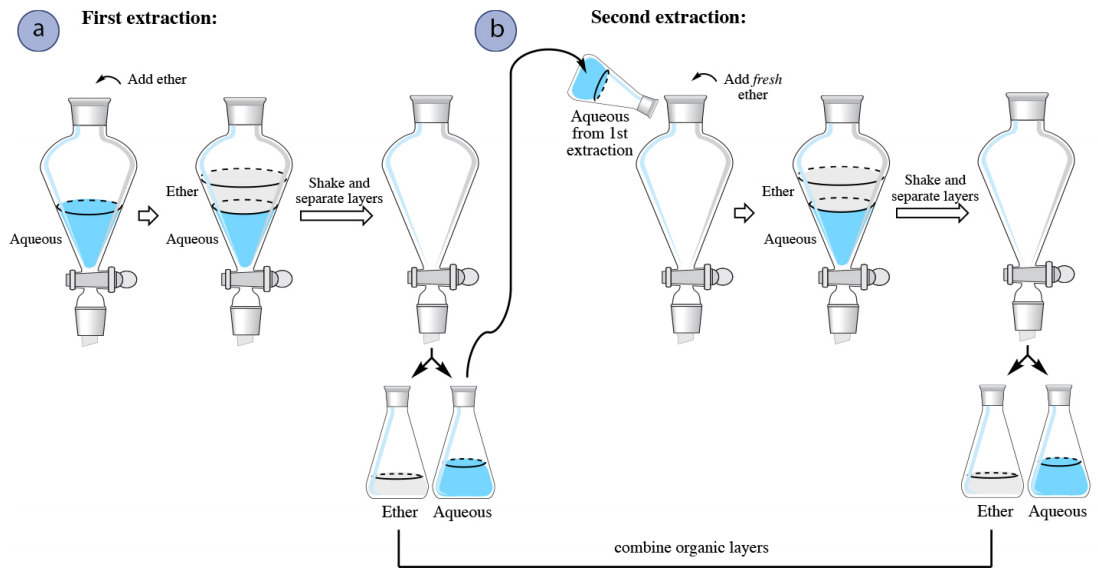
Figure 4.16: Multiple Extractions of an aqueous layer when the organic layer is on the top: a) First extraction, b) Second extraction.
Lisa Nichols, Organic Chemistry Lab Techniques, Butte College, via Chemistry LibreTexts. · CC BY-NC-ND 4.0 · Original image ↗ · Access for free ↗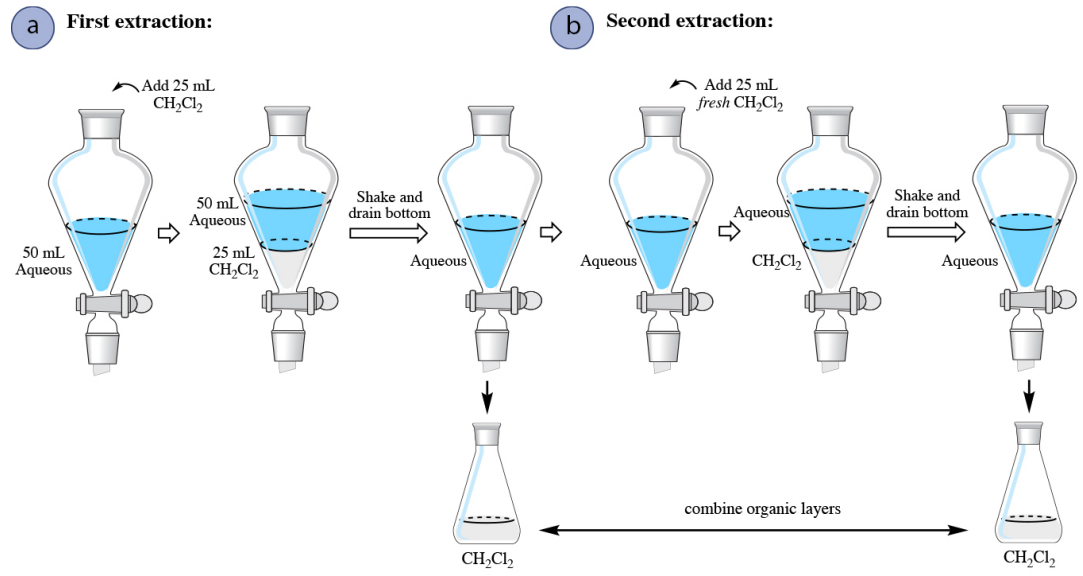
Figure 4.17: Multiple Extractions of an aqueous layer when the organic layer is on the bottom: a) First extraction, b) Second extraction.
Lisa Nichols, Organic Chemistry Lab Techniques, Butte College, via Chemistry LibreTexts. · CC BY-NC-ND 4.0 · Original image ↗ · Access for free ↗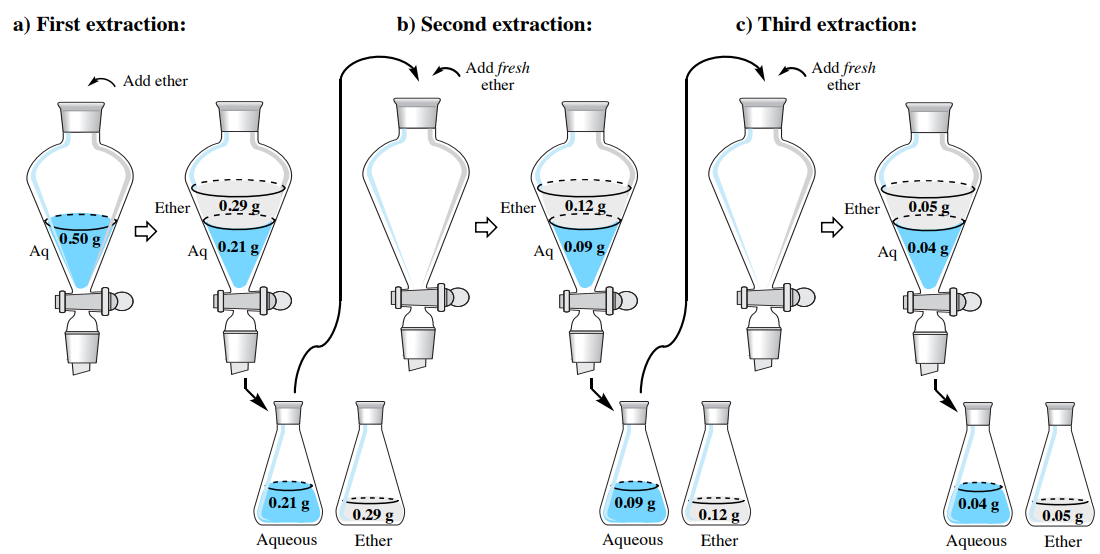
Figure 4.18: Multiple Extractions of hyoscyamine from water into diethyl ether.
Lisa Nichols, Organic Chemistry Lab Techniques, Butte College, via Chemistry LibreTexts. · CC BY-NC-ND 4.0 · Original image ↗ · Access for free ↗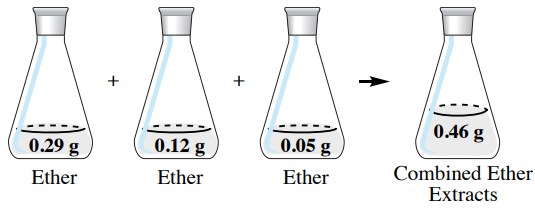
Figure 4.19: Combined organic layers containing hyoscyamine from multiple extractions into diethyl ether.
Lisa Nichols, Organic Chemistry Lab Techniques, Butte College, via Chemistry LibreTexts. · CC BY-NC-ND 4.0 · Original image ↗ · Access for free ↗| Solvent | 1 g caffene dissolves in solvent (at 25 °C) |
|---|---|
| water | 45 mL |
| Diethyl Ether | 530 mL |
| Benzene | 100 mL |
| Chloroform | 5.5 mL |
Lisa Nichols, Organic Chemistry Lab Techniques, Butte College, via Chemistry LibreTexts.
Source: 4.5: Extraction Theory
4.8: Acid-Base Extraction — figures and tables
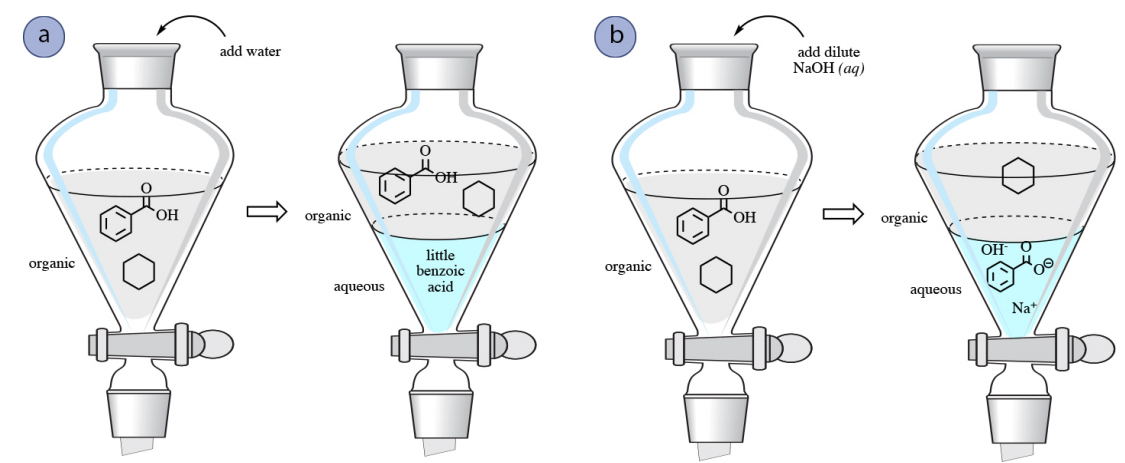
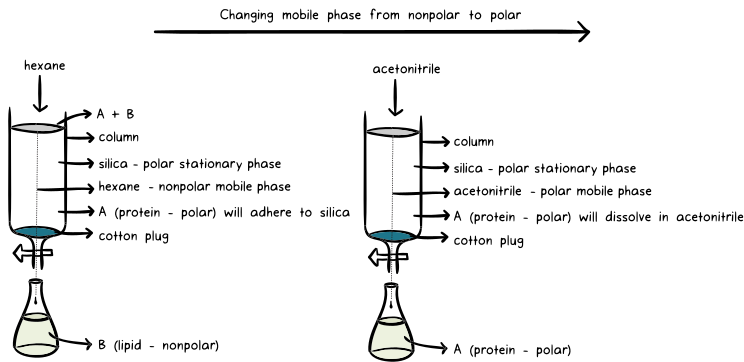
Figure 4.54: Washing a mixture of benzoic acid and cyclohexane with: a) water, b) aqueous .
Lisa Nichols, Organic Chemistry Lab Techniques, Butte College, via Chemistry LibreTexts. · CC BY-NC-ND 4.0 · Original image ↗ · Access for free ↗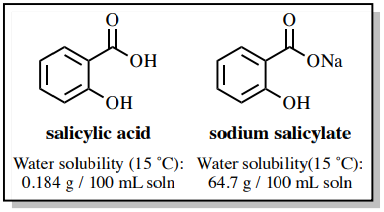
Figure 4.55: Aqueous solubility data for salicylic acid and sodium salicylate (Ref 4).
Lisa Nichols, Organic Chemistry Lab Techniques, Butte College, via Chemistry LibreTexts. · CC BY-NC-ND 4.0 · Original image ↗ · Access for free ↗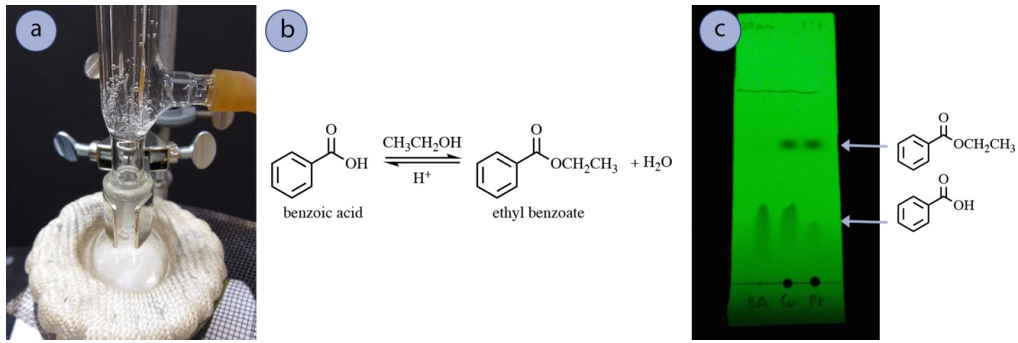
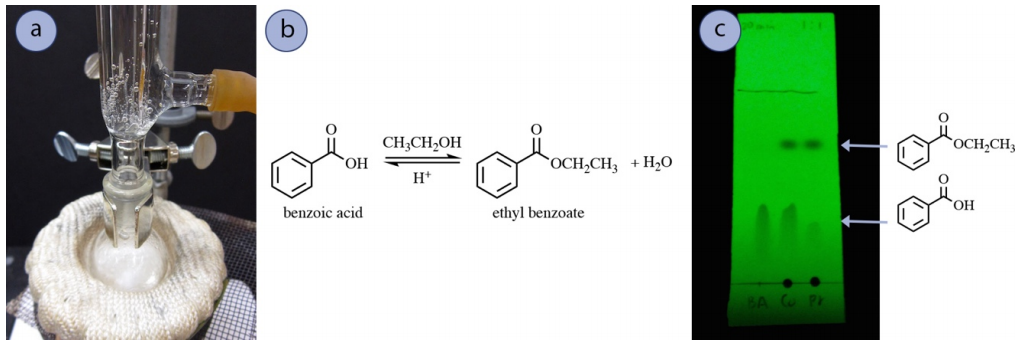
Figure 4.56: a) Refluxing reagents, b) Reaction scheme, c) TLC after 1 hour reflux, where the first lane (BA) is benzoic acid, the second lane (Co) is the co-spot and the third lane (Pr) is the reaction mixture (ran with 1:1 hexanes:ethyl acetate and visualized with UV light).
Lisa Nichols, Organic Chemistry Lab Techniques, Butte College, via Chemistry LibreTexts. · CC BY-NC-ND 4.0 · Original image ↗ · Access for free ↗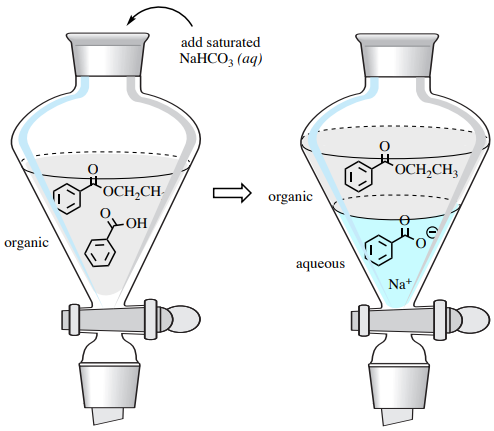
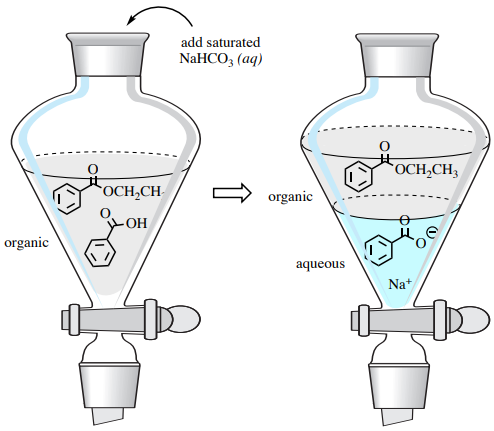
Figure 4.57: Saturated sodium bicarbonate wash to remove residual carboxylic acid from the reaction mixture of a Fischer esterification. The ester is then isolated in the organic layer.
Lisa Nichols, Organic Chemistry Lab Techniques, Butte College, via Chemistry LibreTexts. · CC BY-NC-ND 4.0 · Original image ↗ · Access for free ↗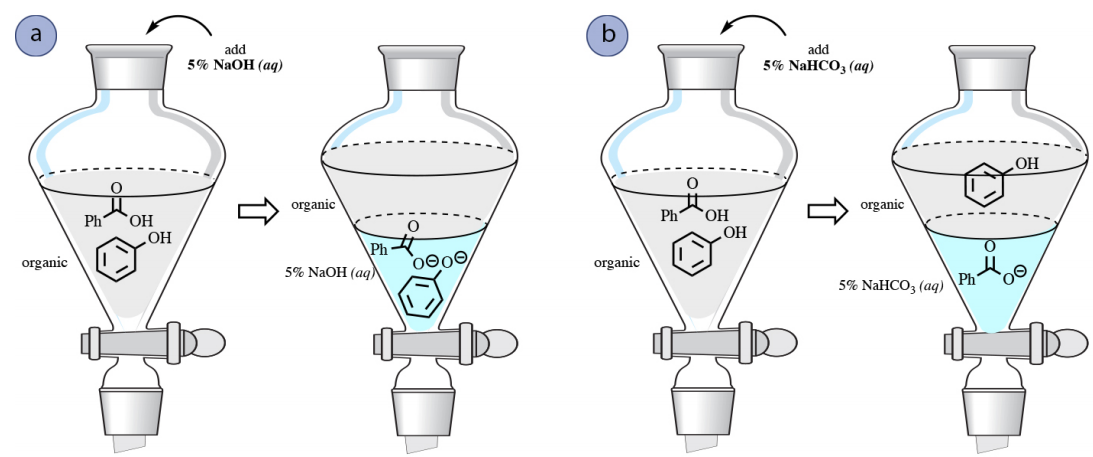
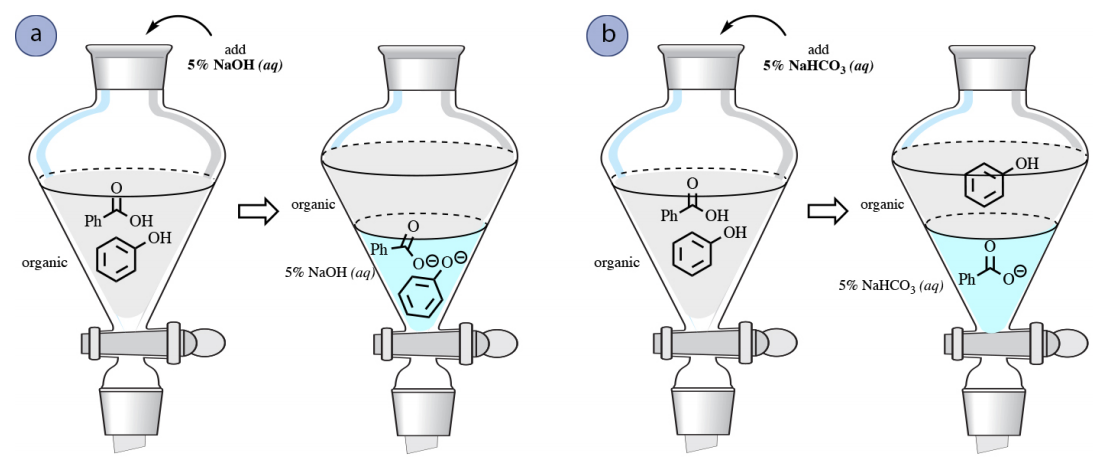
Figure 4.58: a) Extraction of both carboxylic acids and phenols into , b) Extraction of only carboxylic acids into .
Lisa Nichols, Organic Chemistry Lab Techniques, Butte College, via Chemistry LibreTexts. · CC BY-NC-ND 4.0 · Original image ↗ · Access for free ↗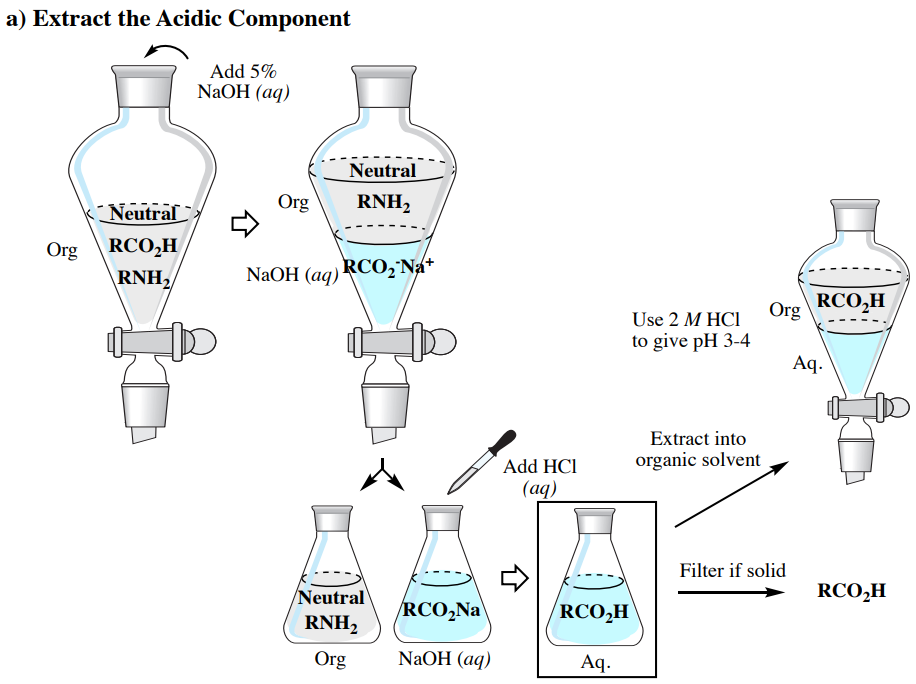
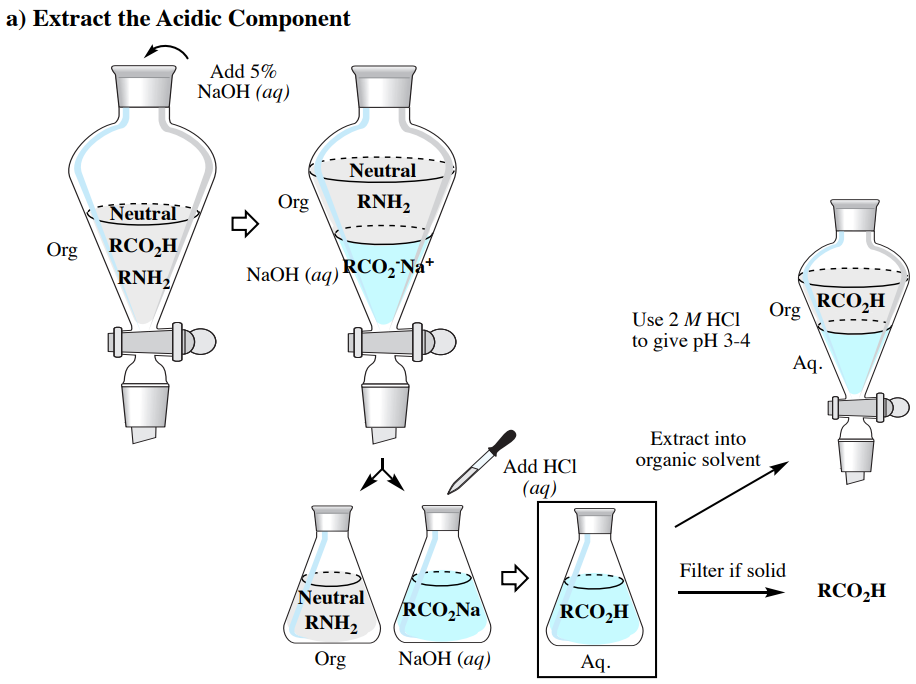
Title: Extract the Acidic Component. First drawing: flask with single organic layer, labelled as neutral, with RCO2H and RNH2 in solution. 5% aqueous sodium hydroxide is added. Second drawing: flask with two layers. Top organic layer, labelled neutral, contains RNH2. Bottom aqueous layer contains sodium cation and RCO2 anion as a salt. The layers are separated into two flasks. Hydrochloric acid is added to the aqueous layer; RCO2H is reformed in the aqueous layer. From the RCO2H, there are two paths. The first path is labelled "extract into organic solvent". This path leads to a flask with two layers: the top organic layer contains RCO2H, and the bottom aqueous layer is empty. Caption reads "Use 2M HCl to give pH 3-4". The other path is labelled "filter if solid", leading to RCO2H by itself, not in solution.
Lisa Nichols, Organic Chemistry Lab Techniques, Butte College, via Chemistry LibreTexts. · CC BY-NC-ND 4.0 · Original image ↗ · Access for free ↗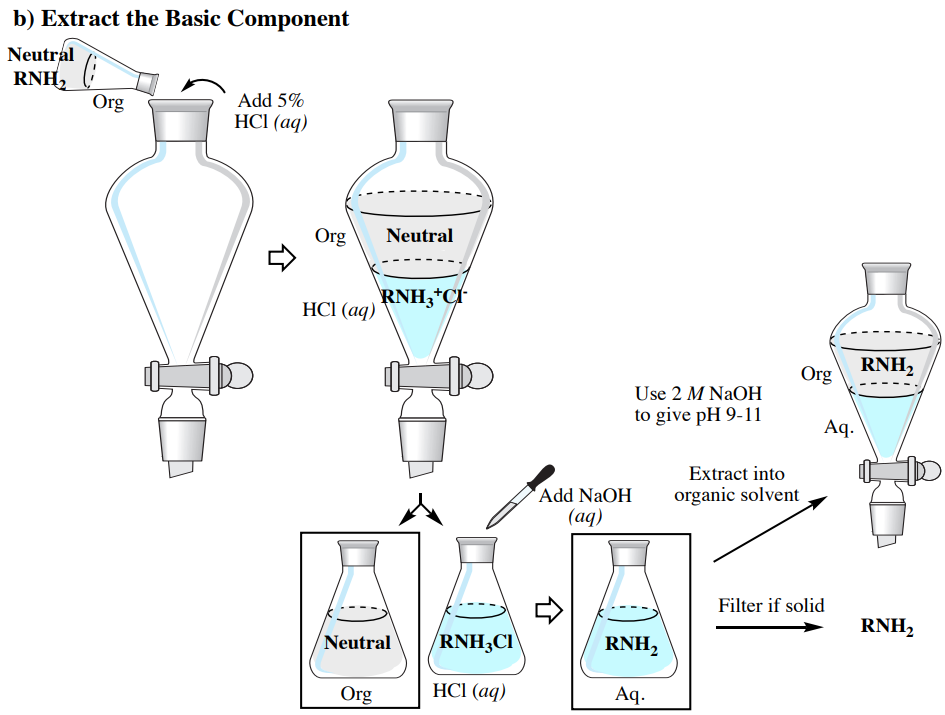
Figure 4.59: Flowchart for separating a mixture containing acidic, basic, and neutral components.
Lisa Nichols, Organic Chemistry Lab Techniques, Butte College, via Chemistry LibreTexts. · CC BY-NC-ND 4.0 · Original image ↗ · Access for free ↗Source: 4.8: Acid-Base Extraction
5.3A: Theory of Fractional Distillation — figures and tables
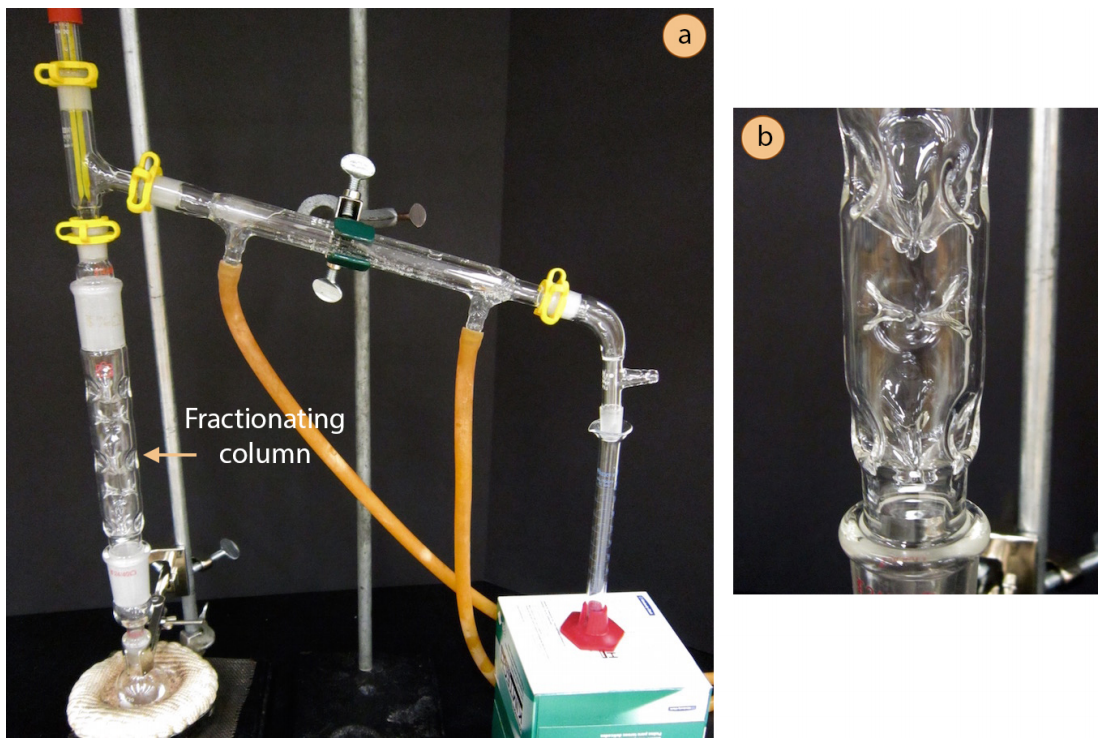
Figure 5.37: a) Fractional distillation setup, b) Zoom in of fractionating column during distillation, with condensation dripping from the glass indentations.
Lisa Nichols, Organic Chemistry Lab Techniques, Butte College, via Chemistry LibreTexts. · CC BY-NC-ND 4.0 · Original image ↗ · Access for free ↗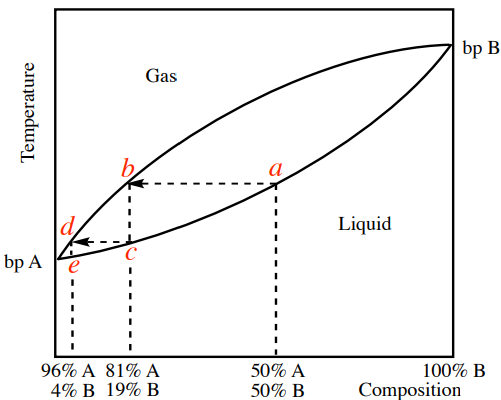
Figure 5.38: Distillation curve of a two-component system of A+B, showing two theoretical plates.
Lisa Nichols, Organic Chemistry Lab Techniques, Butte College, via Chemistry LibreTexts. · CC BY-NC-ND 4.0 · Original image ↗ · Access for free ↗