Education transmits formal knowledge while also sorting credentials and teaching implicit expectations. The hidden curriculum includes punctuality, competition, cooperation, and deference to authority through everyday routines. Teacher expectations can alter feedback and opportunities, potentially contributing to self-fulfilling outcomes. Tracking separates students into programs or levels and can reproduce advantage when assignment reflects unequal resources or biased judgments. Residential segregation and school financing can concentrate opportunities unevenly. Credentialism increases reliance on formal qualifications for access to jobs. A correlation between schooling and income can reflect learning, selection, networks, and credentials; it does not isolate one mechanism without a stronger design.
Compare kinship and family forms, marriage and divorce, and patterns of child, partner, and elder abuse
Kinship organizes socially recognized ties through descent, marriage, adoption, and other relationships. Nuclear and extended families describe household or relationship forms; patrilineal, matrilineal, and bilateral descent organize ancestry differently. Monogamy involves one spouse at a time; polygyny and polyandry are forms of plural marriage. Marriage, cohabitation, divorce, and remarriage patterns vary across institutions and historical conditions. Child, intimate-partner, and elder abuse can include physical, sexual, emotional, or financial harm and neglect, with power and dependence affecting vulnerability. Recorded rates depend on recognition and reporting as well as occurrence; family form alone does not establish safety, stability, or the cause of abuse.
Worked question. Students assigned to a high-expectation classroom receive more feedback and later improve. Can improvement be attributed to expectations alone? A separate study finds more reported elder abuse after a reporting campaign—what should be checked?
Feedback is a plausible pathway through which expectations act, but random assignment and measurement of other classroom differences are needed. For abuse, distinguish increased detection and reporting from increased incidence using consistent ascertainment and multiple data sources. Neither institutional labels nor recorded counts automatically reveal a single causal mechanism.
16.2 Theoretical Perspectives on Education — figures and tables
Figure 16.5 — 16.2 Theoretical Perspectives on Education
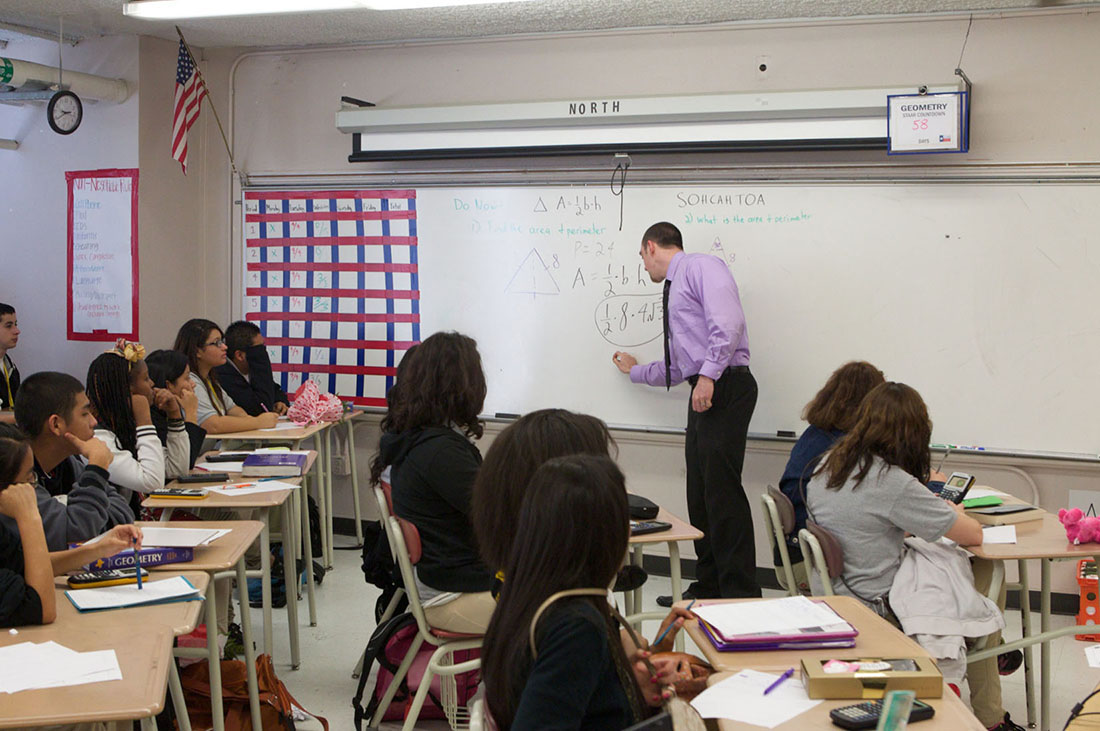
Figure 16.5 The teacher’s authority in the classroom is a way in which education fulfills the manifest functions of social control. (Credit: US Department of Education/flickr)
Tonja R. Conerly, Kathleen Holmes, and Asha Lal Tamang, Introduction Sociology 3E, OpenStax. · CC BY-NC-SA 4.0
· Original image ↗ · Access for free ↗Figure 16.6 — 16.2 Theoretical Perspectives on Education
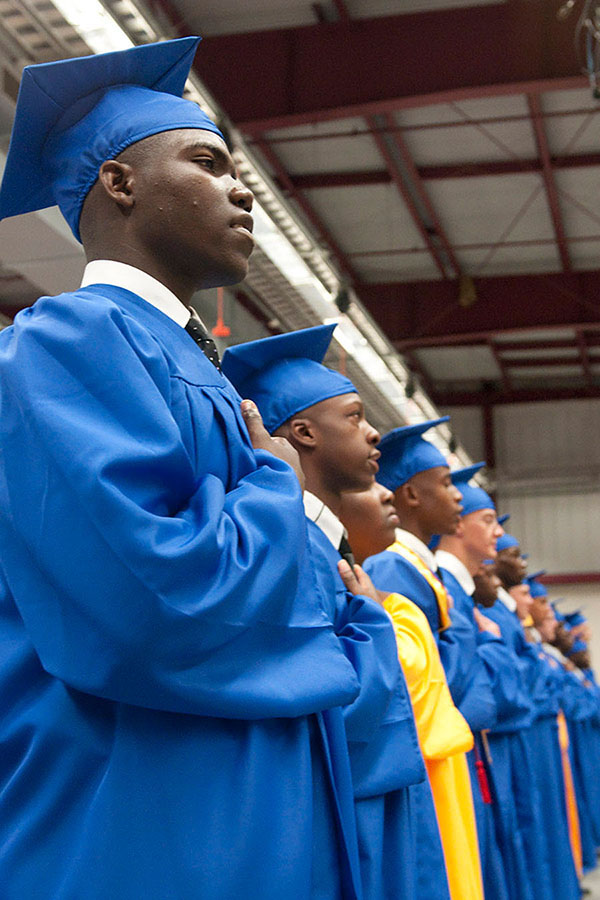
Figure 16.6 Starting each day with the Pledge of Allegiance is one way in which students are taught patriotism. According to a number of court rulings, students in the United States cannot be compelled to recite or salute during the Pledge. (Credit: SC National Guard/flickr)
Tonja R. Conerly, Kathleen Holmes, and Asha Lal Tamang, Introduction Sociology 3E, OpenStax. · CC BY-NC-SA 4.0
· Original image ↗ · Access for free ↗Figure 16.7 — 16.2 Theoretical Perspectives on Education
Figure 16.7 Conflict theorists see the education system as a means by which those in power stay in power. (Credit: Thomas Ricker/flickr)
Table 16.2 Manifest and Latent Functions of Education According to functionalist theory, education contributes both manifest and latent functions.. Tonja R. Conerly, Kathleen Holmes, and Asha Lal Tamang, Introduction Sociology 3E, OpenStax.
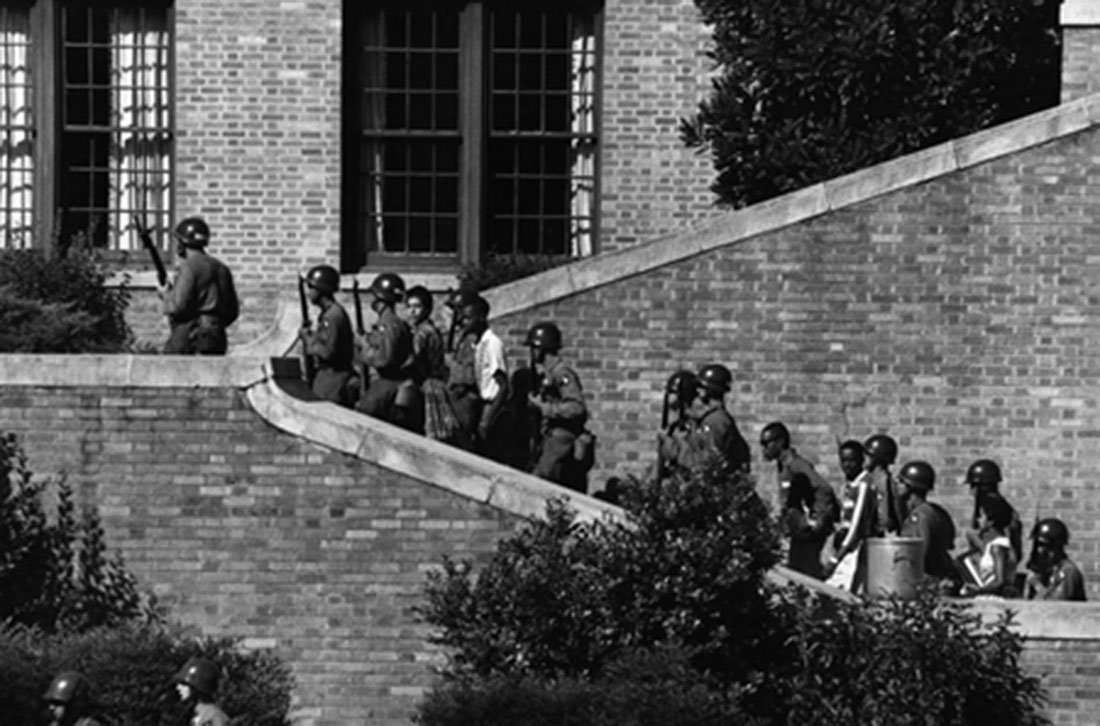
Figure 16.8 President Eisenhower sent members of the 101st Airborne Division from Kentucky to escort Black students into Little Rock Central High School after the governor of Arkansas tried to deny them entry. (Credit: the U.S. Army)
14.1 What Is Marriage? What Is a Family? — figures and tables
Figure 14.2 — 14.1 What Is Marriage? What Is a Family?
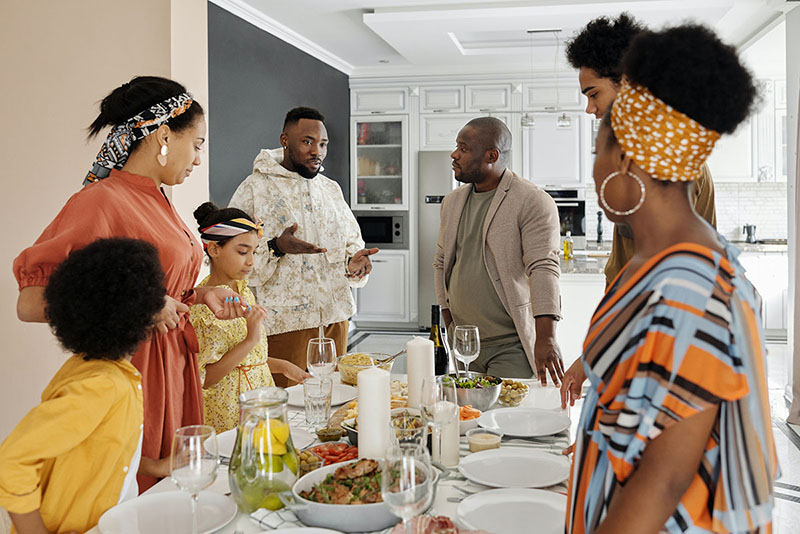
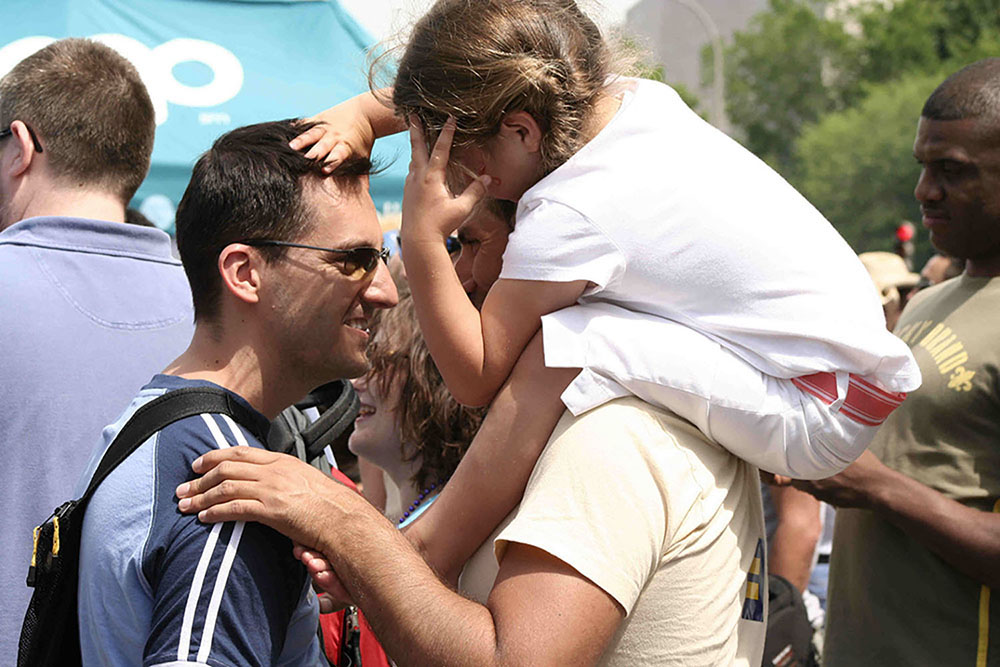
Figure 14.2 If you asked a small child who is in their family, their response might depend more on their living arrangements than on their understanding of formal family structures.
Tonja R. Conerly, Kathleen Holmes, and Asha Lal Tamang, Introduction Sociology 3E, OpenStax. · CC BY-NC-SA 4.0
· Original image ↗ · Access for free ↗Figure 14.3 — 14.1 What Is Marriage? What Is a Family?
Figure 14.3 The ability for parents to socialize and the types of events they can attend is often influenced by the ages and characteristics of their children. Preparing to go out with a four-year-old is usually much easier than doing so with a four-month-old, but the four-year-old needs to be watched more carefully. As children grow and families have more children, and perhaps include extended families, members’ lives and perspective change. (Credit: Elvert Barnes/flickr)
Table 14.1 This table shows one example of how a “stage” theory might categorize the phases a family goes through.. Tonja R. Conerly, Kathleen Holmes, and Asha Lal Tamang, Introduction Sociology 3E, OpenStax.
14.2 Variations in Family Life — figures and tables
Figure 14.4 — 14.2 Variations in Family Life
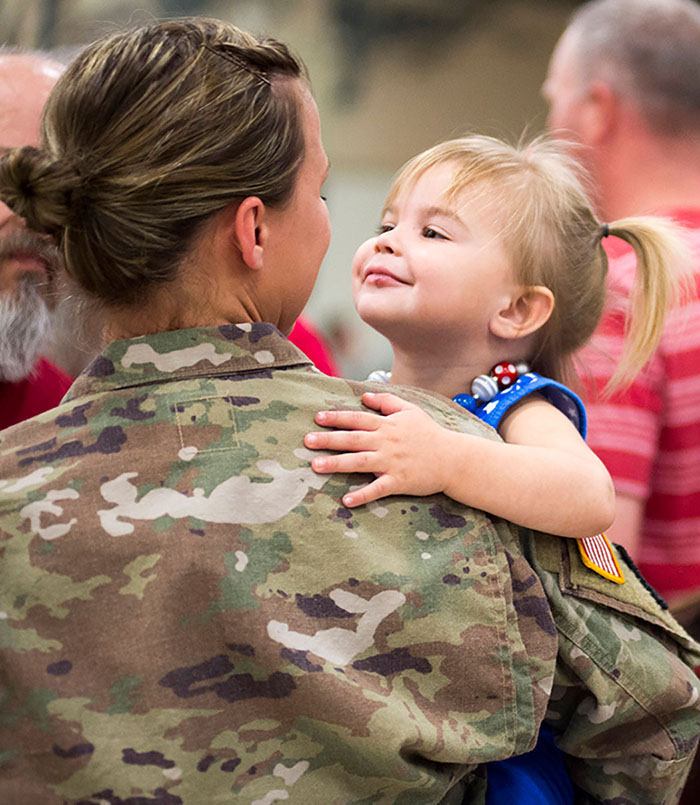
Figure 14.4 Military families sometimes have to endure long parental absences. The other parent or other family members, including older siblings, often take on more responsibility during deployments. The serving parent faces stress and detachment when they are away. (Credit: The National Guard.)
Tonja R. Conerly, Kathleen Holmes, and Asha Lal Tamang, Introduction Sociology 3E, OpenStax. · CC BY-NC-SA 4.0
· Original image ↗ · Access for free ↗Figure 14.5 — 14.2 Variations in Family Life
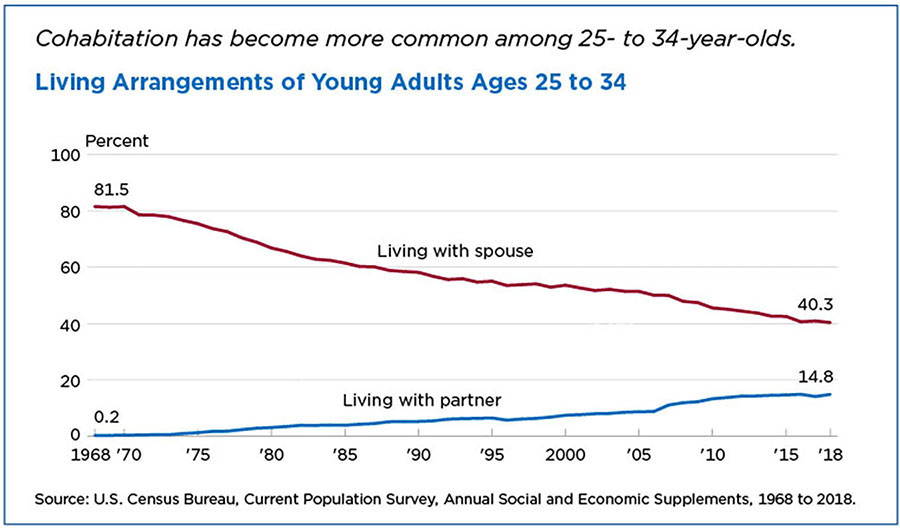
Figure 14.5 As shown by this graph of marital status percentages among young adults, more young people are choosing to delay or opt out of marriage, while the number of people living with a partner has increased. The overall number of people living with either a spouse or a partner has also declined. (Credit: U.S. Census Bureau)
Tonja R. Conerly, Kathleen Holmes, and Asha Lal Tamang, Introduction Sociology 3E, OpenStax. · CC BY-NC-SA 4.0
· Original image ↗ · Access for free ↗Figure 14.6 — 14.2 Variations in Family Life
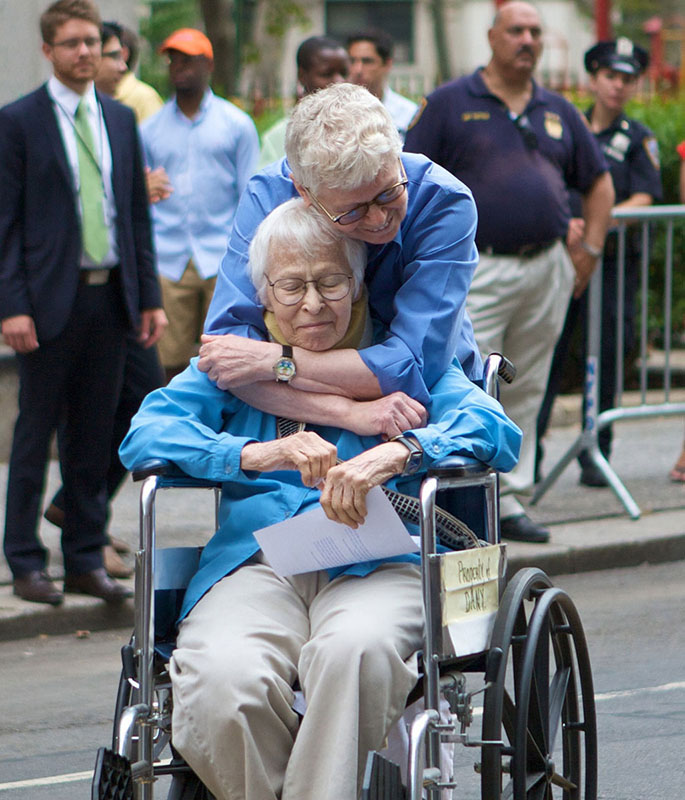
Figure 14.6 After being together for 23 years, Phyllis Siegel (standing) and Connie Kopolev were the first same-sex couple to marry in New York City. (Credit: TJ Sengal/flickr)
14.3 Challenges Families Face — figures and tables
Figure 14.7 — 14.3 Challenges Families Face
Figure 14.7 A study from Radford University indicated that bartenders are among the professions with the highest divorce rates (38.4 percent). Other traditionally low-wage industries (like restaurant service, custodial employment, and factory work) are also associated with higher divorce rates. (Aamodt and McCoy 2010). (Credit: Daniel Lobo/flickr)
Tonja R. Conerly, Kathleen Holmes, and Asha Lal Tamang, Introduction Sociology 3E, OpenStax. · CC BY-NC-SA 4.0
· Original image ↗ · Access for free ↗Figure 14.8 — 14.3 Challenges Families Face
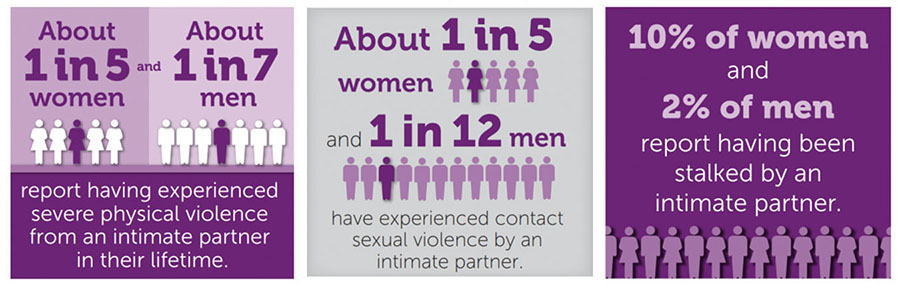
Figure 14.8 Many people have experienced intimate partner violence. Note that while data like this are important to consider and hopefully build awareness around IPV, there are gaps in both reporting and information gathering. For example, less information is known about IPV against transgender people, but analysis of various sources indicate that it is 1.7 times more likely to be committed against transgender people than against cisgender people, as described below. (Credit: Centers for Disease Control)
Tonja R. Conerly, Kathleen Holmes, and Asha Lal Tamang, Introduction Sociology 3E, OpenStax. · CC BY-NC-SA 4.0
· Original image ↗ · Access for free ↗Figure 14.9 — 14.3 Challenges Families Face
Figure 14.9 Dr. Michael C. Irving’s monument for child abuse survivors is composed of handprints and messages of people who have been victims of abuse. (Credit: Harvey K/flickr)
Table 14.2 This chart shows reasons that victims give for why they fail to report abuse to police authorities (Catalano 2007).. Tonja R. Conerly, Kathleen Holmes, and Asha Lal Tamang, Introduction Sociology 3E, OpenStax.
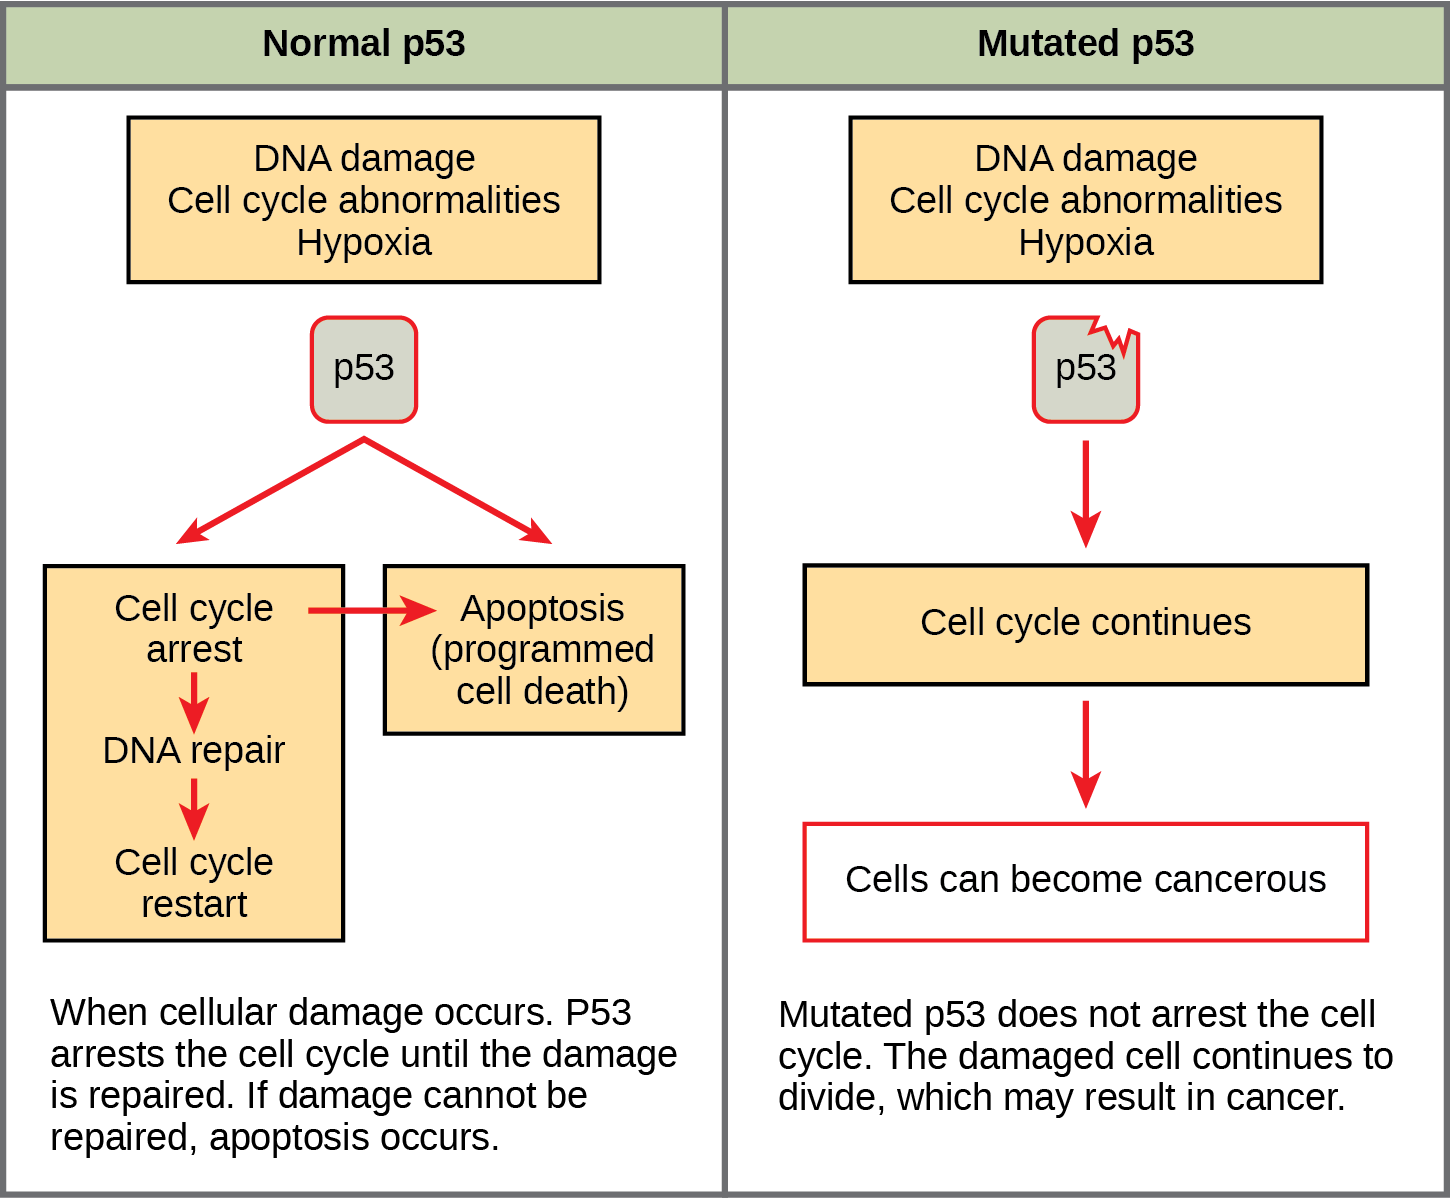
Figure 10.16 The role of normal p53 is to monitor DNA and the supply of oxygen (hypoxia is a condition of reduced oxygen supply). If damage is detected, p53 triggers repair mechanisms. If repairs are unsuccessful, p53 signals apoptosis. A cell with an abnormal p53 protein cannot repair damaged DNA and thus cannot signal apoptosis. Cells with abnormal p53 can become cancerous. (credit: modification of work by Thierry Soussi)
A nitrogen-containing functional group. A free amino acid’s amino group is typically protonated (NH₃⁺) near physiological pH; proline’s ring nitrogen is an exception to this formula.
Figure 15.4 This figure shows the genetic code for translating each nucleotide triplet in mRNA into an amino acid or a termination signal in a protein. (credit: modification of work by NIH)
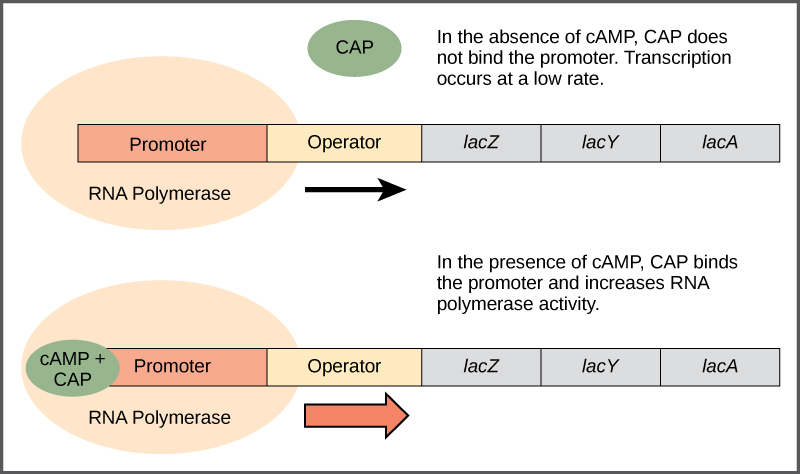
Figure 16.5 Transcriptional activation by the CAP protein. When glucose levels fall, E. coli may use other sugars for fuel but must transcribe new genes to do so. As glucose supplies become limited, cAMP levels increase. This cAMP binds to the CAP protein, a positive regulator that binds to a promoter region upstream of the genes required to use other sugar sources.
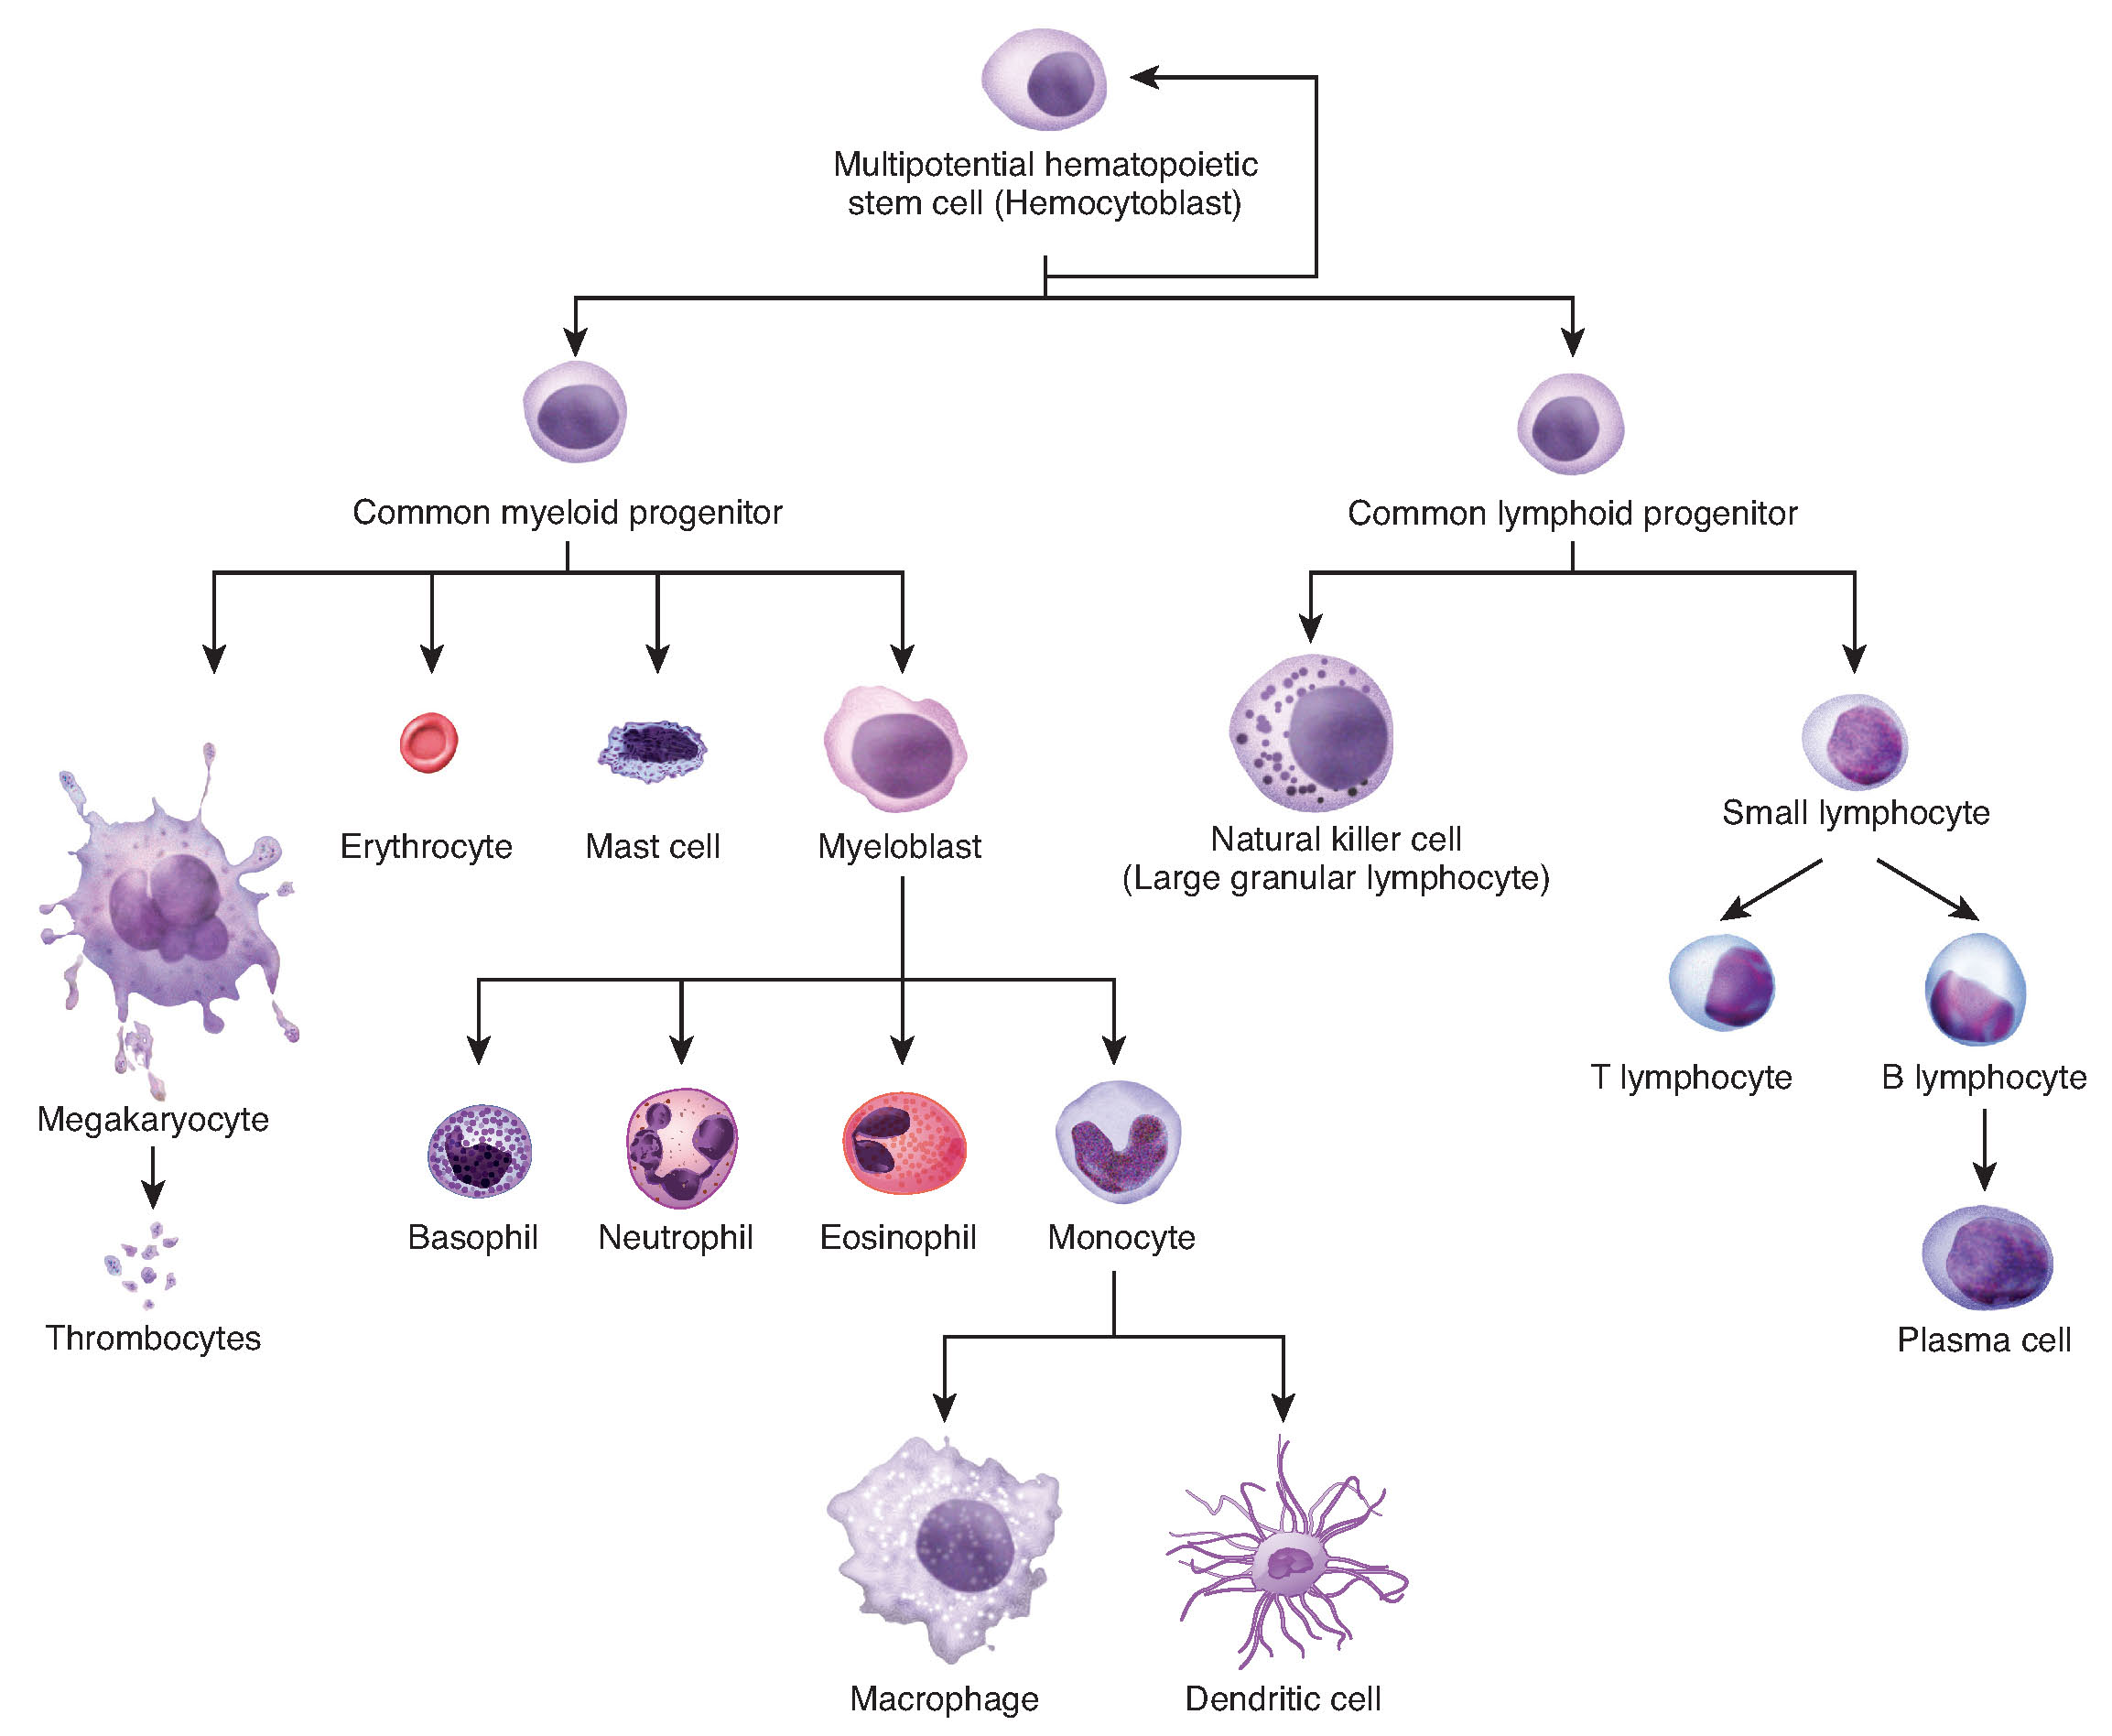
Figure 3.34 Hematopoiesis The process of hematopoiesis involves the differentiation of multipotent cells into blood and immune cells. The multipotent hematopoietic stem cells give rise to many different cell types, including the cells of the immune system and red blood cells.
Figure 12.4 In the P generation, pea plants that are true-breeding for the dominant yellow phenotype are crossed with plants with the recessive green phenotype. This cross produces F 1 heterozygotes with a yellow phenotype. Punnett square analysis can be used to predict the genotypes of the F 2 generation.
An electrical property that can be positive or negative. Opposite charges attract and like charges repel; net charge is the sum of all charges on a particle.
Figure 15.10 A generalized promoter of a gene transcribed by RNA polymerase II is shown. Transcription factors recognize the promoter. RNA polymerase II then binds and forms the transcription initiation complex.
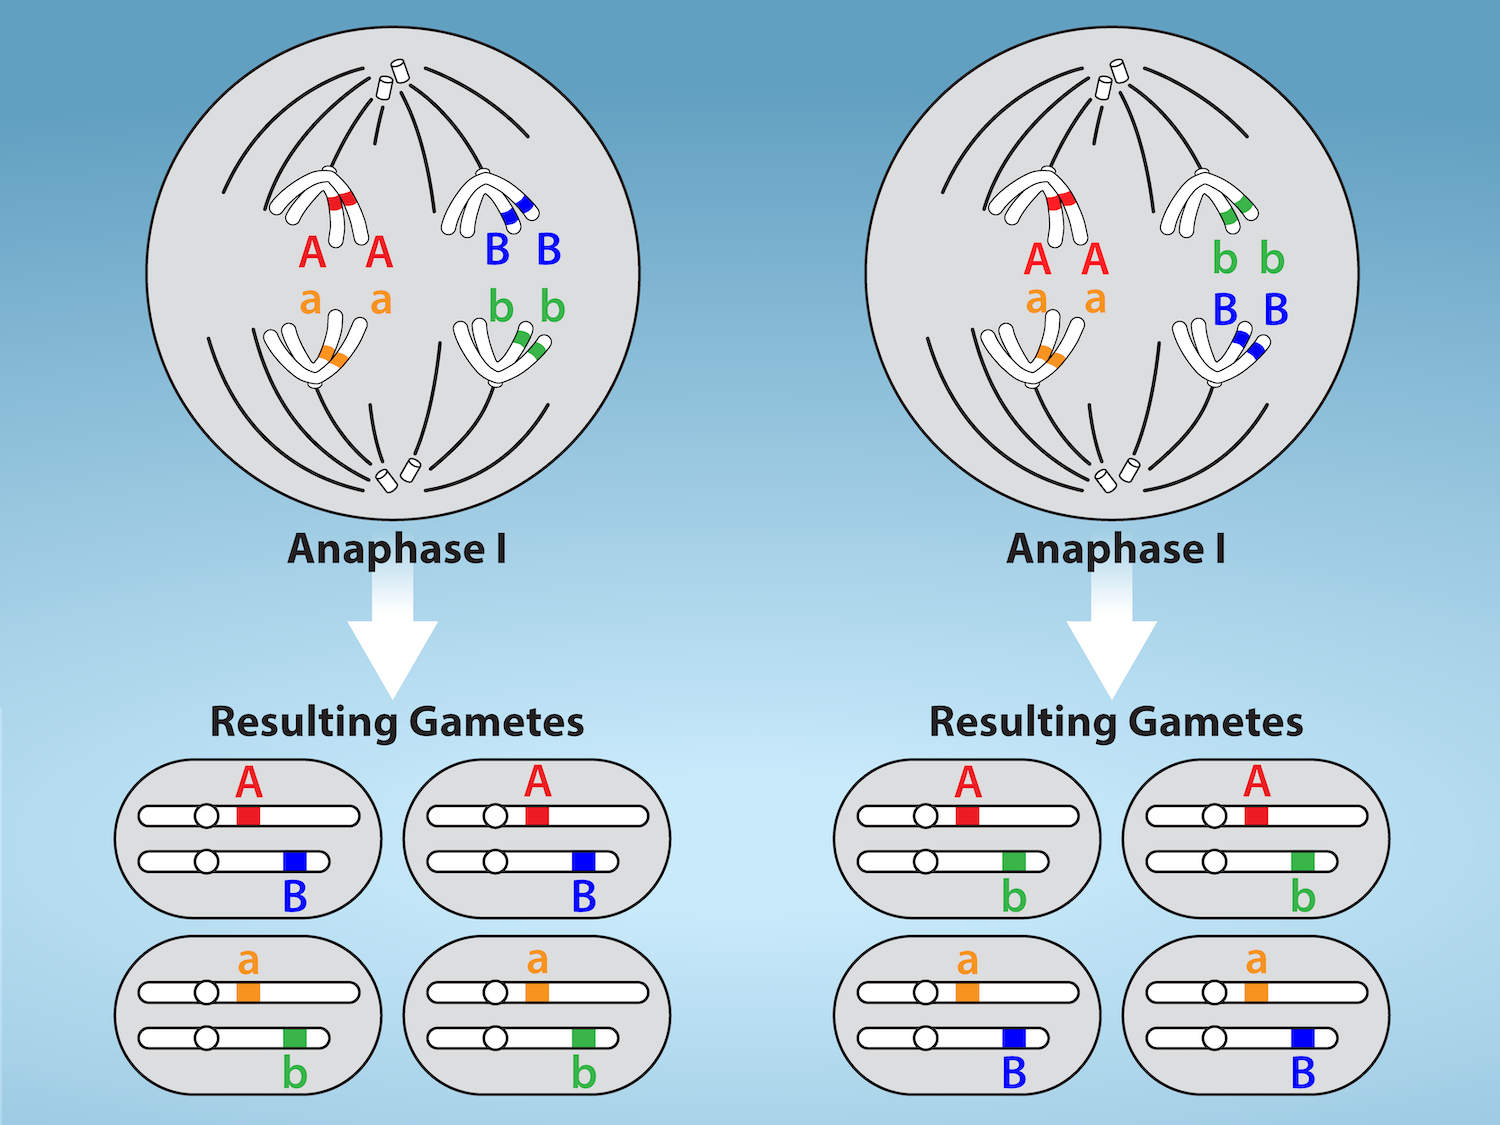
Figure 11.5 Random, independent assortment during metaphase I is demonstrated by considering a cell with a set of two chromosomes (n = 2).
There are two possible homologous chromosome arrangements at the equatorial plane in metaphase I, that are then separated during anaphase I.
The total possible number of different gametes is 2 n , where n equals the number of chromosomes in a set. In this example, there are four possible
genetic combinations for the gametes. With n = 23 in human cells, there are over eight million possible combinations of paternal and maternal
chromosomes. Credit: Rao, A.and Fletcher, S. Department of Biology, Texas A&M University.
Figure 12.4 In the P generation, pea plants that are true-breeding for the dominant yellow phenotype are crossed with plants with the recessive green phenotype. This cross produces F 1 heterozygotes with a yellow phenotype. Punnett square analysis can be used to predict the genotypes of the F 2 generation.
Figure 12.4 In the P generation, pea plants that are true-breeding for the dominant yellow phenotype are crossed with plants with the recessive green phenotype. This cross produces F 1 heterozygotes with a yellow phenotype. Punnett square analysis can be used to predict the genotypes of the F 2 generation.
The exponent needed to obtain a number from a chosen fixed number. For decimal logarithms, log₁₀(100) = 2 because 10² = 100; pH uses the negative decimal logarithm of hydrogen ion activity.
A thin boundary or sheet. Cell membranes are lipid bilayers containing proteins; blotting membranes are synthetic supports that hold proteins or nucleic acids for detection.
Figure 15.11 Eukaryotic pre-mRNA processing. In addition to 5’ Cap and 3’ Poly-A Tail addition, introns must be precisely removed and exons joined to generate a functional mRNA. Nucleotides upstream (towards the 5’cap) of the translation START codon are part of the 5’ untranslated region (5’ UTR). Nucleotides downstream (towards 3’end) of the STOP codon form the 3’ UTR. Both 5’ and 3’ UTRs are important for regulating translation initiation and mRNA stability. Credit: Rao, A., Ryan, K. Fletcher, S. and Tag, A. Department of Biology, Texas A&M University.
Rao, A., Ryan, K. Fletcher, S. and Tag, A. Department of Biology, Texas A&M University.; Mary Ann Clark, Matthew Douglas, and Jung Choi, Biology 2e, OpenStax. · CC BY-NC-SA 4.0
· Original image ↗ · Access for free ↗
Figure 12.4 In the P generation, pea plants that are true-breeding for the dominant yellow phenotype are crossed with plants with the recessive green phenotype. This cross produces F 1 heterozygotes with a yellow phenotype. Punnett square analysis can be used to predict the genotypes of the F 2 generation.
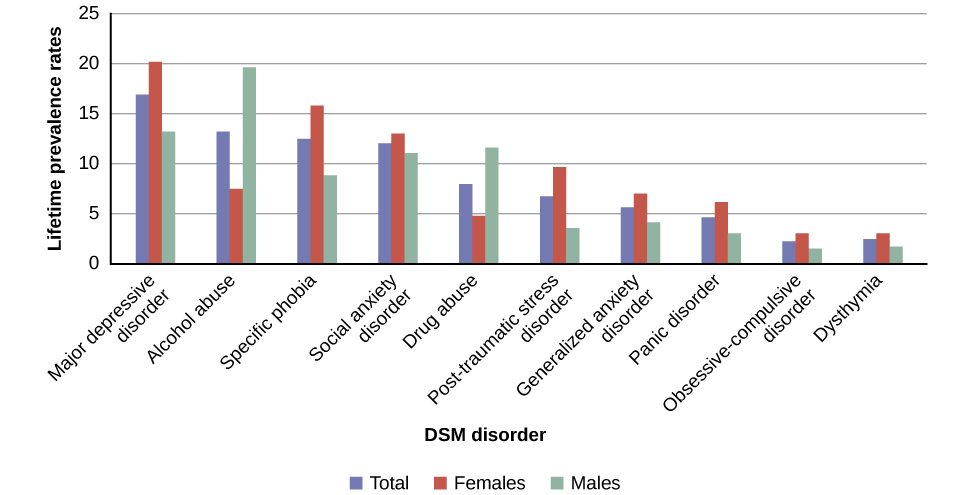
Figure 15.4 The graph shows the breakdown of psychological disorders, comparing the percentage prevalence among adult males and adult females in the United States. Because the data is from 2007, the categories shown here are from the DSM-IV, which has been supplanted by the DSM-5. Most categories remain the same; however, alcohol abuse now falls under a broader Alcohol Use Disorder category.
Figure 12.19 Reaction diagrams for an endothermic process in the absence (red curve) and presence (blue curve) of a catalyst. The catalyzed pathway involves a two-step mechanism (note the presence of two transition states) and an intermediate species (represented by the valley between the two transitions states).
Figure 7.45 - Non-homologous end joining (left) versus homologous recombination (right) - Wikipedia
Wikipedia, as credited by Kevin Ahern, Indira Rajagopal, and Taralyn Tan, Biochemistry Free For All, Oregon State University, via Biology LibreTexts. · Source attribution
· Original image ↗ · Access for free ↗
The amount of a substance that can dissolve in a solvent under specified conditions. Soluble means able to dissolve; insoluble means only very slightly soluble in that solvent.
Figure 15.7 Messenger RNA is a copy of protein-coding information in the coding strand of DNA, with the substitution of U in the RNA for T in the coding sequence. However, new RNA nucleotides base pair with the nucleotides of the template strand. RNA is synthesized in its 5'-3' direction, using the enzyme RNA polymerase. As the template is read, the DNA unwinds ahead of the polymerase and then rewinds behind it.
A fleeting, high-energy arrangement at a reaction barrier. It is an energy maximum along the reaction path, rather than a stable reaction intermediate.
Figure 12.19 Reaction diagrams for an endothermic process in the absence (red curve) and presence (blue curve) of a catalyst. The catalyzed pathway involves a two-step mechanism (note the presence of two transition states) and an intermediate species (represented by the valley between the two transitions states).
Figure 15.18 Translation begins when an initiator tRNA anticodon recognizes a start codon on mRNA bound to a small ribosomal subunit. The large ribosomal subunit joins the small subunit, and a second tRNA is recruited. As the mRNA moves relative to the ribosome, successive tRNAs move through the ribosome and the polypeptide chain is formed. Entry of a release factor into the A site terminates translation and the components dissociate.
No matching terms. Try a different name or abbreviation.
16.2 Theoretical Perspectives on Education
OpenStax · 16.2 Theoretical Perspectives on Education ↗ Instructional page including learning objectives, examples, figures, source tables and questions. Site navigation and embedded media players are omitted; source media links remain available.
Learning Objectives
By the end of this section, you should be able to:
While it is clear that education plays an integral role in individuals’ lives as well as society as a whole, sociologists view that role from many diverse points of view. Functionalists believe that education equips people to perform different functional roles in society. Conflict theorists view education as a means of widening the gap in social inequality. Feminist theorists point to evidence that sexism in education continues to prevent women from achieving a full measure of social equality. Symbolic interactionists study the dynamics of the classroom, the interactions between students and teachers, and how those affect everyday life. In this section, you will learn about each of these perspectives.
Functionalists view education as one of the more important social institutions in a society. They contend that education contributes two kinds of functions: manifest (or primary) functions, which are the intended and visible functions of education; and latent (or secondary) functions, which are the hidden and unintended functions.
Manifest Functions
There are several major manifest functions associated with education. The first is socialization. Beginning in preschool and kindergarten, students are taught to practice various societal roles. The French sociologist Émile Durkheim (1858–1917), who established the academic discipline of sociology, characterized schools as “socialization agencies that teach children how to get along with others and prepare them for adult economic roles” (Durkheim 1898). Indeed, it seems that schools have taken on this responsibility in full.
This socialization also involves learning the rules and norms of the society as a whole. In the early days of compulsory education, students learned the dominantculture. Today, since the culture of the United States is increasingly diverse, students may learn a variety of cultural norms, not only that of the dominantculture.
School systems in the United States also transmit the core values of the nation through manifest functions like social control. One of the roles of schools is to teach students conformity to law and respect for authority. Obviously, such respect, given to teachers and administrators, will help a student navigate the school environment. This function also prepares students to enter the workplace and the world at large, where they will continue to be subject to people who have authority over them. Fulfillment of this function rests primarily with classroom teachers and instructors who are with students all day.
Figure 16.5 — 16.2 Theoretical Perspectives on Education
Figure 16.5 The teacher’s authority in the classroom is a way in which education fulfills the manifest functions of social control. (Credit: US Department of Education/flickr)
Education also provides one of the major methods used by people for upward social mobility. This function is referred to as social placement. College and graduate schools are viewed as vehicles for moving students closer to the careers that will give them the financial freedom and security they seek. As a result, college students are often more motivated to study areas that they believe will be advantageous on the social ladder. A student might value business courses over a class in Victorian poetry because she sees business class as a stronger vehicle for financial success.
Latent Functions
Education also fulfills latent functions. As you well know, much goes on in a school that has little to do with formal education. For example, you might notice an attractive fellow student when he gives a particularly interesting answer in class—catching up with him and making a date speaks to the latent function of courtship fulfilled by exposure to a peer group in the educational setting.
The educational setting introduces students to social networks that might last for years and can help people find jobs after their schooling is complete. Of course, with social media such as Facebook and LinkedIn, these networks are easier than ever to maintain. Another latent function is the ability to work with others in small groups, a skill that is transferable to a workplace and that might not be learned in a homeschool setting.
The educational system, especially as experienced on university campuses, has traditionally provided a place for students to learn about various social issues. There is ample opportunity for social and political advocacy, as well as the ability to develop tolerance to the many views represented on campus. In 2011, the Occupy Wall Street movement swept across college campuses all over the United States, leading to demonstrations in which diverse groups of students were unified with the purpose of changing the political climate of the country.
Manifest Functions: Openly stated functions with intended goals
Latent Functions: Hidden, unstated functions with sometimes unintended consequences
Table
16.2
Manifest and Latent Functions of Education
According to functionalist theory, education contributes both manifest and latent functions.
Functionalists recognize other ways that schools educate and enculturate students. One of the most important U.S. values students in the United States learn is that of individualism—the valuing of the individual over the value of groups or society as a whole. In countries such as Japan and China, where the good of the group is valued over the rights of the individual, students do not learn as they do in the United States that the highest rewards go to the “best” individual in academics as well as athletics. One of the roles of schools in the United States is fostering self-esteem; conversely, schools in Japan focus on fostering social esteem—the honoring of the group over the individual.
In the United States, schools also fill the role of preparing students for competition in life. Obviously, athletics foster a competitive nature, but even in the classroom students compete against one another academically. Schools also fill the role of teaching patriotism. Students recite the Pledge of Allegiance each morning and take history classes where they learn about national heroes and the nation’s past.
Figure 16.6 — 16.2 Theoretical Perspectives on Education
Figure 16.6 Starting each day with the Pledge of Allegiance is one way in which students are taught patriotism. According to a number of court rulings, students in the United States cannot be compelled to recite or salute during the Pledge. (Credit: SC National Guard/flickr)
Another role of schools, according to functionalist theory, is that of sorting, or classifying students based on academic merit or potential. The most capable students are identified early in schools through testing and classroom achievements. Such students are placed in accelerated programs in anticipation of successful college attendance.
Functionalists also contend that school, particularly in recent years, is taking over some of the functions that were traditionally undertaken by family. Society relies on schools to teach about human sexuality as well as basic skills such as budgeting and job applications—topics that at one time were addressed by the family.
Conflict theorists do not believe that public schools reduce social inequality. Rather, they believe that the educational system reinforces and perpetuates social inequalities that arise from differences in class, gender, race, and ethnicity. Where functionalists see education as serving a beneficial role, conflict theorists view it more negatively. To them, educational systems preserve the status quo and push people of lower status into obedience.
Figure 16.7 — 16.2 Theoretical Perspectives on Education
Figure 16.7 Conflict theorists see the education system as a means by which those in power stay in power. (Credit: Thomas Ricker/flickr)
The fulfillment of one’s education is closely linked to social class. Students of low socioeconomic status are generally not afforded the same opportunities as students of higher status, no matter how great their academic ability or desire to learn. Picture a student from a working-class home who wants to do well in school. On a Monday, he’s assigned a paper that’s due Friday. Monday evening, he has to babysit his younger sister while his divorced mother works. Tuesday and Wednesday, he works stocking shelves after school until 10:00 p.m. By Thursday, the only day he might have available to work on that assignment, he’s so exhausted he can’t bring himself to start the paper. His mother, though she’d like to help him, is so tired herself that she isn’t able to give him the encouragement or support he needs. And since English is her second language, she has difficulty with some of his educational materials. They also lack a computer and printer at home, which most of his classmates have, so they have to rely on the public library or school system for access to technology. As this story shows, many students from working-class families have to contend with helping out at home, contributing financially to the family, poor study environments and a lack of support from their families. This is a difficult match with education systems that adhere to a traditional curriculum that is more easily understood and completed by students of higher social classes.
Such a situation leads to social class reproduction, extensively studied by French sociologist Pierre Bourdieu. He researched how cultural capital, or cultural knowledge that serves (metaphorically) as currency that helps us navigate a culture, alters the experiences and opportunities available to French students from different social classes. Members of the upper and middle classes have more cultural capital than do families of lower-class status. As a result, the educational system maintains a cycle in which the dominantculture’s values are rewarded. Instruction and tests cater to the dominantculture and leave others struggling to identify with values and competencies outside their social class. For example, there has been a great deal of discussion over what standardized tests such as the SAT truly measure. Many argue that the tests group students by cultural ability rather than by natural intelligence.
The cycle of rewarding those who possess cultural capital is found in formal educational curricula as well as in the hidden curriculum, which refers to the type of nonacademic knowledge that students learn through informal learning and cultural transmission. This hidden curriculum reinforces the positions of those with higher cultural capital and serves to bestow status unequally.
Conflict theorists point to tracking, a formalized sorting system that places students on “tracks” (advanced versus low achievers) that perpetuate inequalities. While educators may believe that students do better in tracked classes because they are with students of similar ability and may have access to more individual attention from teachers, conflict theorists feel that tracking leads to self-fulfilling prophecies in which students live up (or down) to teacher and societal expectations (Education Week 2004).
To conflict theorists, schools play the role of training working-class students to accept and retain their position as lower members of society. They argue that this role is fulfilled through the disparity of resources available to students in richer and poorer neighborhoods as well as through testing (Lauen and Tyson 2008).
IQ tests have been attacked for being biased—for testing cultural knowledge rather than actual intelligence. For example, a test item may ask students what instruments belong in an orchestra. To correctly answer this question requires certain cultural knowledge—knowledge most often held by more affluent people who typically have more exposure to orchestral music. Though experts in testing claim that bias has been eliminated from tests, conflict theorists maintain that this is impossible. These tests, to conflict theorists, are another way in which education does not provide opportunities, but instead maintains an established configuration of power.
Feminist theory aims to understand the mechanisms and roots of gender inequality in education, as well as their societal repercussions. Like many other institutions of society, educational systems are characterized by unequal treatment and opportunity for women. Almost two-thirds of the world’s 862 million illiterate people are women, and the illiteracy rate among women is expected to increase in many regions, especially in several African and Asian countries (UNESCO 2005; World Bank 2007).
Women in the United States have been relatively late, historically speaking, to be granted entry to the public university system. In fact, it wasn’t until the establishment of Title IX of the Education Amendments in 1972 that discriminating on the basis of sex in U.S. education programs became illegal. In the United States, there is also a post-education gender disparity between what male and female college graduates earn. A study released in May 2011 showed that, among men and women who graduated from college between 2006 and 2010, men out-earned women by an average of more than $5,000 each year. First-year job earnings for men averaged $33,150; for women the average was $28,000 (Godofsky, Zukin, and van Horn 2011). Similar trends are seen among salaries of professionals in virtually all industries.
When women face limited opportunities for education, their capacity to achieve equal rights, including financial independence, are limited. Feminist theory seeks to promote women’s rights to equal education (and its resultant benefits) across the world.
Sociology in the Real World
Grade Inflation: When Is an A Really a C?
In 2019, news emerged of a criminal conspiracy regarding wealthy and, in some cases, celebrity parents who illegally secured college admission for their children. Over 50 people were implicated in the scandal, including employees from prestigious universities; several people were sentenced to prison. Their activity included manipulating test scores, falsifying students’ academic or athletic credentials, and acquiring testing accommodations through dishonest claims of having a disability.
One of the questions that emerged at the time was how the students at the center of these efforts could succeed at these challenging and elite colleges. Meaning, if they couldn’t get in without cheating, they probably wouldn’t do well. Wouldn’t their lack of preparation quickly become clear?
Many people would say no. First, many of the students involved (the children of the conspirators) had no knowledge or no involvement of the fraud; those students may have been admitted anyway. But there may be another safeguard for underprepared students at certain universities: grade inflation.
Grade inflation generally refers to a practice of awarding students higher grades than they have earned. It reflects the observation that the relationship between letter grades and the achievements they reflect has been changing over time. Put simply, what used to be considered C-level, or average, now often earns a student a B, or even an A.
Some, including administrators at elite universities, argue that grade inflation does not exist, or that there are other factors at play, or even that it has benefits such as increased funding and elimination of inequality (Boleslavsky 2014). But the evidence reveals a stark change. Based on data compiled from a wide array of four-year colleges and universities, a widely cited study revealed that the number of A grades has been increasing by several percentage points per decade, and that A’s were the most common grade awarded (Jaschik 2016). In an anecdotal case, a Harvard dean acknowledged that the median grade there was an A-, and the most common was also an A. Williams College found that the number of A+ grades had grown from 212 instances in 2009-10 to 426 instances in 2017-18 (Berlinsky-Schine 2020). Princeton University took steps to reduce inflation by limiting the number of A’s that could be issued, though it then reversed course (Greason 2020).
Why is this happening? Some cite the alleged shift toward a culture that rewards effort instead of product, i.e., the amount of work a student puts in raises the grade, even if the resulting product is poor quality. Another oft-cited contributor is the pressure for instructors to earn positive course evaluations from their students. Finally, many colleges may accept a level of grade inflation because it works. Analysis and formal experiments involving graduate school admissions and hiring practices showed that students with higher grades are more likely to be selected for a job or a grad school. And those higher-grade applicants are still preferred even if decision-maker knows that the applicant’s college may be inflating grades (Swift 2013). In other words, people with high GPA at a school with a higher average GPA are preferred over people who have a high GPA at a school with a lower average GPA.
Ironically, grade inflation is not simply a college issue. Many of the same college faculty and administrators who encounter or engage in some level of grade inflation may lament that it is also occurring at high schools (Murphy 2017).
Symbolic interactionism sees education as one way that labeling theory is seen in action. A symbolic interactionist might say that this labeling has a direct correlation to those who are in power and those who are labeled. For example, low standardized test scores or poor performance in a particular class often lead to a student who is labeled as a low achiever. Such labels are difficult to “shake off,” which can create a self-fulfilling prophecy (Merton 1968).
In his book High School Confidential, Jeremy Iversen details his experience as a Stanford graduate posing as a student at a California high school. One of the problems he identifies in his research is that of teachers applying labels that students are never able to lose. One teacher told him, without knowing he was a bright graduate of a top university, that he would never amount to anything (Iversen 2006). Iversen obviously didn’t take this teacher’s false assessment to heart. But when an actual seventeen-year-old student hears this from a person with authority over her, it’s no wonder that the student might begin to “live down to” that label.
The labeling with which symbolic interactionists concern themselves extends to the very degrees that symbolize completion of education. Credentialism embodies the emphasis on certificates or degrees to show that a person has a certain skill, has attained a certain level of education, or has met certain job qualifications. These certificates or degrees serve as a symbol of what a person has achieved, and allows the labeling of that individual.
Indeed, as these examples show, labeling theory can significantly impact a student’s schooling. This is easily seen in the educational setting, as teachers and more powerful social groups within the school dole out labels that are adopted by the entire school population.
16.3 Issues in Education
OpenStax · 16.3 Issues in Education ↗ Instructional page including learning objectives, examples, figures, source tables and questions. Site navigation and embedded media players are omitted; source media links remain available.
Learning Objectives
By the end of this section, you should be able to:
Identify historical and contemporary issues in education
Discuss the impacts of educational equality efforts
Explain important United States government actions and programs in education
As schools strive to fill a variety of roles in their students’ lives, many issues and challenges arise. Students walk a minefield of bullying, violence in schools, the results of declining funding, changes due to the COVID-19 pandemic, and other problems that affect their education. When Americans are asked about their opinion of public education on the Gallup poll each year, reviews are mixed at best (Saad 2008). Schools are no longer merely a place for learning and socializing. With the landmark Brown v. Board of Education of Topeka ruling in 1954, schools became a repository of much political and legal action that is at the heart of several issues in education.
Equal Education
Until the 1954 Brown v. Board of Education ruling, schools had operated under the precedent set by Plessy v. Ferguson in 1896, which allowed racial segregation in schools and private businesses (the case dealt specifically with railroads) and introduced the much maligned phrase “separate but equal” into the U.S. lexicon. The 1954 Brown v. Board decision overruled this, declaring that state laws that had established separate schools for Black and White students were, in fact, unequal and unconstitutional.
While the ruling paved the way toward civil rights, it was also met with contention in many communities. In Arkansas in 1957, the governor mobilized the state National Guard to prevent Black students from entering Little Rock Central High School. President Eisenhower, in response, sent members of the 101st Airborne Division from Kentucky to uphold the students’ right to enter the school. In 1963, almost ten years after the ruling, Governor George Wallace of Alabama used his own body to block two Black students from entering the auditorium at the University of Alabama to enroll in the school. Wallace’s desperate attempt to uphold his policy of “segregation now, segregation tomorrow, segregation forever,” stated during his 1963 inauguration (PBS 2000) became known as the “Stand in the Schoolhouse Door.” He refused to grant entry to the students until a general from the Alabama National Guard arrived on President Kennedy’s order.
Figure 16.8 — 16.3 Issues in Education
Figure 16.8 President Eisenhower sent members of the 101st Airborne Division from Kentucky to escort Black students into Little Rock Central High School after the governor of Arkansas tried to deny them entry. (Credit: the U.S. Army)
Presently, students of all races and ethnicities are permitted into schools, but there remains a troubling gap in the equality of education they receive. The long-term socially embedded effects of racism—and other discriminations and disadvantages—have left a residual mark of inequality in the nation’s education system. Students from wealthy families and those of lower socioeconomic status do not receive the same opportunities.
Today’s public schools, at least in theory, are positioned to help remedy those gaps. Predicated on the notion of universal access, this system is mandated to accept and retain all students regardless of race, religion, social class, and the like. Moreover, public schools are held accountable to equitable per-student spending (Resnick 2004). Private schools, usually only accessible to students from high-income families, and schools in more affluent areas generally enjoy access to greater resources and better opportunities. In fact, some of the key predictors for student performance include socioeconomic status and family background. Children from families of lower socioeconomic status often enter school with learning deficits they struggle to overcome throughout their educational tenure. These patterns, uncovered in the landmark Coleman Report of 1966, are still highly relevant today, as sociologists still generally agree that there is a great divide in the performance of white students from affluent backgrounds and their nonwhite, less affluent, counterparts (Coleman 1966).
The findings in the Coleman Report were so powerful that they brought about two major changes to education in the United States. The federal Head Start program, which is still active and successful today, was developed to give low-income students an opportunity to make up the preschool deficit discussed in Coleman’s findings. The program provides academic-centered preschool to students of low socioeconomic status.
Transfers and Busing
In the years following Brown v. Board of Education, the Southern states were not alone in their resistance to change. In New York City, schools in lower-income neighborhoods had less experienced teachers, inadequate facilities, and lower spending per student than did schools in higher-income neighborhoods, even though all of the schools were in the same district. In 1958, Activist Mae Mallory, with the support of grassroots advocate Ella Baker and the NAACP, led a group of parents who kept their children out of school, essentially boycotting the district. She and the rest of the group, known as the Harlem Nine, were publicly chastised and pursued by the judicial system. After several decisions and appeals, the culminating legal decision found that the city was effectively segregating schools, and that students in certain neighborhoods were still receiving a “discriminatorily inferior education.” New York City, the nation’s largest school district, enacted an open transfer policy that laid the groundwork for further action (Jeffries 2012).
With the goal of further desegregating education, courts across the United States ordered some school districts to begin a program that became known as “busing.” This program involved bringing students to schools outside their neighborhoods (and therefore schools they would not normally have the opportunity to attend) to bring racial diversity into balance. This practice was met with a great deal of public resistance from people on both sides dissatisfied with White students traveling to inner city schools and minority students being transported to schools in the suburbs.
No Child Left Behind and Every Student Succeeds
In 2001, the Bush administration passed the No Child Left Behind Act, which requires states to test students in grades three through eight. The results of those tests determine eligibility to receive federal funding. Schools that do not meet the standards set by the Act run the risk of having their funding cut. Sociologists and teachers alike have contended that the impact of the No Child Left Behind Act is far more negative than positive, arguing that a “one size fits all” concept cannot apply to education.
As a result of widespread criticism, many of the national aspects of the act were gradually altered, and in 2015 they were essentially eliminated. That year, Congress passed the Every Student Succeeds Act (ESSA). The law decreases the federal role in education. Annual testing is still required, but the achievement and improvement accountability is shifted to the states, which must submit plans and goals regarding their approaches to the U.S. Department of Education for approval. While this aspect of ESSA was delayed for several years under the Trump administration, the Department of Education announced in April, 2020 that Massachusetts had become the first to have its plans approved. The COVID-19 pandemic delayed many states’ further action in terms of ESSA approval.
New Views On Standardized Tests
The funding tie-in of the No Child Left Behind Act has led to the social phenomenon commonly called “teaching to the test,” which describes when a curriculum focuses on equipping students to succeed on standardized tests, to the detriment of broader educational goals and concepts of learning. At issue are two approaches to classroom education: the notion that teachers impart knowledge that students are obligated to absorb, versus the concept of student-centered learning that seeks to teach children not facts, but problem solving abilities and learning skills. Both types of learning have been valued in the U.S. school system. The former, to critics of “teaching to the test,” only equips students to regurgitate facts, while the latter, to proponents of the other camp, fosters lifelong learning and transferable work skills.
The Scholastic Aptitude Test (SAT) and the American College Testing (ACT) have for decades served as rites of passage for millions of high school students. Colleges utilize the scores as benchmarks in the admissions process. Since the tests have been important in college admissions, many families place significant emphasis on preparing for them.
However, the disparity in how much money families are able to spend on that preparation results in inequities. SAT/ACT-prep courses and tutors are expensive, and not everyone can afford them. As a result, the inequity found in K-12 education may extend to college.
For years, college admissions programs have been taking these disparities into account, and have based admissions on factors beyond standardized test scores. However, issues with the tests remain. In 2020, a slate of highly selective colleges eliminated their standardized test requirement for admission, and, in 2021 several colleges expanded and extended their “test-optional” approach.
Students With Disabilities
Since the 1978 implementation of what would become the Individuals with Disabilities Education Act (IDEA), states and local districts have continually increased their investment in the quality of education for students with disabilities. The Act’s reauthorization, coupled with No Child Left Behind, added requirements and guidance for states and school districts. Until that point in time, students with intellectual or other disabilities had been steadily improving their achievement, graduation rates, and success in post-high school endeavors. However, significant disparities existed (and persist today) based on race, ethnicity, and also on geography. Beyond the quality of education for students with disabilities, the disparity was often most noticeable in the classification of those students. States varied on which disabilities received services, and how much support was provided.
Many students with dyslexia, ADHD, and other disorders are either not diagnosed, not taken seriously, or not given as much support as they require in order to succeed. This can extend into adulthood. For example, ADHD was for years considered only a children’s disease, something that people “grew out of.” But the disorder can impact people at any age, something that many educators and even some doctors are not aware of.
No Child Left Behind’s focus on standards and standardized testing extended to students with disabilities as well. A core goal was that students with disabilities would work toward the same standards and take the same tests (with accommodations, if needed) as did students without disabilities. The outcomes were mixed. Test performance for students with disabilities increased, but so did drop outs. There was also evidence that some schools were less welcoming to students with disabilities, as a way to increase average scores (National Council on Disabilities 2004).
In general, programs have improved to the point that students with disabilities are graduating from high school at a national average of about 73 percent. This is lower than the average graduation rate for students in all populations, which is 88 percent, but it is a vast improvement over previous decades (NCES 2020). However, several issues remain. First, students from lower-income and areas and states with lower education budgets still are offered far fewer services; they graduate high school at a much lower rate than the average. Second, because identification remains a major gap, many students with disabilities may be in the “mainstream” population but are not supported as well as they should be. Even when this group gets to college, they may be starting with a lower level of preparation (Samuels 2019).
School Choice
As we have seen, education is not equal, and people have varied needs. Parents, guardians, and child advocates work to obtain the best schooling for children, which may take them outside the traditional environment.
Public school alternatives to traditional schools include vocational schools, special education schools, magnet schools, charter schools, alternative schools, early college schools, and virtual schools. Private school options may include religious and non-religious options, as well as boarding schools. In some locations, a large number of students engage in these options. For example, in North Carolina, one in five students does not attend a traditional public school (Hui 2019).
Homeschooling refers to children being educated in their own homes, typically by a parent, instead of in a traditional public or private school system. Proponents of this type of education argue that it provides an outstanding opportunity for student-centered learning while circumventing problems that plague today’s education system. Opponents counter that homeschooled children miss out on the opportunity for social development that occurs in standard classroom environments and school settings.
School choice advocates promote the idea that more choice allows parents and students a more effective educational experience that is right for them. They may choose a nontraditional school because it is more aligned with their philosophy, because they’ve been bullied or had other trouble in their neighborhood school, or because they want to prepare for a specific career (American Federation for Children 2017). School choice opponents may argue that while the alternative schools may be more effective for those students who need them and are fortunate enough to get in, the money would be better spent in general public schools.
Remote and Hybrid Schooling
The COVID-19 pandemic was among the most disruptive events in American education. You likely have your own stories, successes, failures, and preferences based on your experiences as students, parents, and family members. Educators at every level went through stages of intense stress, lack of information, and difficult choices. In many cities and states, families, school districts, governments, and health departments found themselves on different sides of debates. Countless arguments raged over attendance, mental health, instructional quality, safety, testing, academic integrity, and the best ways to move forward as the situation began to improve.
College students and their families went through similar disruptions and debates, compounded by the fact that many students felt that the high costs of particular colleges were not worth it. Overall college enrollment dipped significantly during the pandemic (Koenig 2020).
At the time of this writing, the sociological and educational impact of the pandemic is difficult to assess, though many are studying it. Overall data indicates that most outcomes are negative. Students underperformed, stress and mental health problems increased, and overall plans and pathways were interrupted. Perhaps most damaging was that the pandemic amplified many of the other challenges in education, meaning that under-resourced districts and underserved students were impacted even more severely than others. On the other hand, once instructors and students adapted to the technological and social differences, many began to employ new techniques to ensure more caretaking, connection, differentiated instruction, and innovation. Most agree that education will be changed for years following the pandemic, but it might not all be for the worse.
14.1 What Is Marriage? What Is a Family?
OpenStax · 14.1 What Is Marriage? What Is a Family? ↗ Instructional page including learning objectives, examples, figures, source tables and questions. Site navigation and embedded media players are omitted; source media links remain available.
Learning Objectives
By the end of this section, you should be able to:
Describe society’s current understanding of family
Recognize changes in marriage and family patterns
Differentiate between lines of descent and residence
Figure 14.2 — 14.1 What Is Marriage? What Is a Family?
Figure 14.2 If you asked a small child who is in their family, their response might depend more on their living arrangements than on their understanding of formal family structures.
Marriage and family are key structures in many societies. Many of us learn from a young age that finding and joining the right person is a key to happiness and security. We’re told that children need two parents. Many of the tax laws, medical laws, retirement benefit laws, and banking and loan processes seem to favor or assume marriage. Should those assumptions be changed? Is marriage still the foundation of the family and our society?
In 1960, 66 percent of households in America were headed by a married couple. That meant that most children grew up in such households, as did their friends and extended families. Marriage could certainly be seen as the foundation of the culture. By 2010, that number of households headed by married couples had dropped to 45 percent (Luscombe 2014). The major drop in households headed by a married couple is more than just a statistic; it has significant practical effects. It means that nearly every child in most parts of America is either in or is close to a family that is not headed by a married couple. It means that teachers and counselors and even people who meet children in a restaurant can’t assume they live with two married parents. Some view this decline as a problem with outcomes related to values, crime, financial strength, and mental health. Sociologists may study that viewpoint to determine if it is actually true.
What is marriage? Not even sociologists are able to agree on a single meaning. For our purposes, we’ll define marriage as a legally recognized social contract between two people, traditionally based on a sexual relationship and implying a permanence of the union. In practicing cultural relativism, we should also consider variations, such as whether a legal union is required, whether more than two people can be involved, or whether the marriage is a religious one or a civil one.
Sociologists are interested in the relationship between the institution of marriage and the institution of family because, historically, marriages are what create a family, and families are the most basic social unit upon which society is built. Both marriage and family create status roles that are sanctioned by society.
The question of what constitutes a family may be an even more difficult one to answer; it’s a prime area of debate in family sociology, as well as in politics and religion. Social conservatives tend to define the family in terms of structure with each family member filling a certain role (like father, mother, or child). Sociologists, on the other hand, tend to define family more in terms of the manner in which members relate to one another than on a strict configuration of status roles. Here, we’ll define family as a socially recognized group (usually joined by blood, marriage, cohabitation, or adoption) that forms an emotional connection and serves as an economic unit of society. Sociologists identify different types of families based on how one enters into them. A family of orientation refers to the family into which a person is born. A family of procreation describes one that is formed through marriage. These distinctions have cultural significance related to issues of lineage.
Drawing on two sociological paradigms, the sociological understanding of what constitutes a family can be explained by symbolic interactionism as well as functionalism. These two theories indicate that families are groups in which participants view themselves as family members and act accordingly. In other words, families are groups in which people come together to form a strong primary group connection and maintain emotional ties to one another over a long period of time. Such families may include groups of close friends or teammates. In addition, the functionalist perspective views families as groups that perform vital roles for society—both internally (for the family itself) and externally (for society as a whole). Families provide for one another’s physical, emotional, and social well-being. Parents care for and socialize children. Later in life, adult children often care for elderly parents. While interactionism helps us understand the subjective experience of belonging to a “family,” functionalism illuminates the many purposes of families and their roles in the maintenance of a balanced society (Parsons and Bales 1956). We will go into more detail about how these theories apply to family in the following pages.
Challenges Families Face
People in the United States as a whole are somewhat divided when it comes to determining what does and what does not constitute a family. In a 2010 survey conducted by professors at the University of Indiana, nearly all participants (99.8 percent) agreed that a husband, wife, and children constitute a family. Ninety-two percent stated that a husband and a wife without children still constitute a family. The numbers drop for less traditional structures: unmarried couples with children (83 percent), unmarried couples without children (39.6 percent), gay male couples with children (64 percent), and gay male couples without children (33 percent) (Powell et al. 2010). This survey revealed that children tend to be the key indicator in establishing “family” status: the percentage of individuals who agreed that unmarried couples and gay couples constitute a family nearly doubled when children were added.
The study also revealed that 60 percent of U.S. respondents agreed that if you consider yourself a family, you are a family (a concept that reinforces an interactionist perspective) (Powell 2010). The government, however, is not so flexible in its definition of “family.” The U.S. Census Bureau defines a family as “a group of two people or more (one of whom is the householder) related by birth, marriage, or adoption and residing together” (U.S. Census Bureau 2010). While this structured definition can be used as a means to consistently track family-related patterns over several years, it excludes individuals such as cohabitating unmarried couples. Legality aside, sociologists would argue that the general concept of family is more diverse and less structured than in years past. Society has given more leeway to the design of a family making room for what works for its members (Jayson 2010).
Family is, indeed, a subjective concept, but it is a fairly objective fact that family (whatever one’s concept of it may be) is very important to people in the United States. In a 2010 survey by Pew Research Center in Washington, DC, 76 percent of adults surveyed stated that family is “the most important” element of their life—just one percent said it was “not important” (Pew Research Center 2010). It is also very important to society. President Ronald Reagan notably stated, “The family has always been the cornerstone of American society. Our families nurture, preserve, and pass on to each succeeding generation the values we share and cherish, values that are the foundation of our freedoms” (Lee 2009). While the design of the family may have changed in recent years, the fundamentals of emotional closeness and support are still present. Most responders to the Pew survey stated that their family today is at least as close (45 percent) or closer (40 percent) than the family with which they grew up (Pew Research Center 2010).
As you may have seen in the chapter on Aging and the Elderly, different generations have varying living situations and views on aging. The same goes for living situations with family. The Pew Research Center analyzed living situation of 40-year-olds from different generations. At that age, Millennials indicated that 45 percent of them were not living in a family of their own. In contrast, when Gen Xers and Baby Boomers were about 40 years old (around 2003 and 1987, respectively), an average of 33 percent of them lived outside of a family (Barroso 2020). The dynamic of nearly a 50-50 split between family/non-family for Millennials is very different from a two-third/one third split of Boomers and Gen X.
The data also show that women are having children later in life and that men are much less likely to live in a household with their own children. In 2019, 32 percent of Millennial men were living in a household with their children, compared to 41 percent of Gen X men in 2003 and 44 percent of Boomer men in 1987 (Barroso 2020). Again, the significant drop off in parenting roles likely has an impact on attitudes toward family.
Alongside the debate surrounding what constitutes a family is the question of what people in the United States believe constitutes a marriage. Many religious and social conservatives believe that marriage can only exist between a man and a woman, citing religious scripture and the basics of human reproduction as support. Social liberals and progressives, on the other hand, believe that marriage can exist between two consenting adults—be they a man and a woman, or a woman and a woman—and that it would be discriminatory to deny such a couple the civil, social, and economic benefits of marriage.
Marriage Patterns
With single parenting and cohabitation (when a couple shares a residence but not a marriage) becoming more acceptable in recent years, people may be less motivated to get married. In a recent survey, 39 percent of respondents answered “yes” when asked whether marriage is becoming obsolete (Pew Research Center 2010). The institution of marriage is likely to continue, but some previous patterns of marriage will become outdated as new patterns emerge. In this context, cohabitation contributes to the phenomenon of people getting married for the first time at a later age than was typical in earlier generations (Glezer 1991). Furthermore, marriage will continue to be delayed as more people place education and career ahead of “settling down.”
One Partner or Many?
People in the United States typically equate marriage with monogamy, when someone is married to only one person at a time. In many countries and cultures around the world, however, having one spouse is not the only form of accepted marriage, even if it is the most common. Polygamy, or being married to more than one person at a time, is accepted to varying degrees around the world, with most polygamous societies existing in northern Africa and east Asia (OECD 2019). Instances of polygamy are almost exclusively in the form of a man being married to more than one woman at the same time, rather than a woman being married to more than one man (Altman and Ginat 1996).
While the majority of societies accept polygamy, the majority of people do not practice it. Even in the regions where it is most common, only an average of 11 percent of the population lives in arrangements that include more than one spouse (Kramer 2020). In these relationships, the husbands are often older, wealthy, high-status men (Altman and Ginat 1996). The average plural marriage involves no more than three wives. Negev Bedouin men in Israel, for example, typically have two wives, although it is acceptable to have up to four (Griver 2008). As urbanization increases in these cultures, polygamy is likely to decrease as a result of greater access to mass media, technology, and education (Altman and Ginat 1996).
In the United States, polygamy is illegal. A recent Gallup poll showed that 21 percent of people believe polygamy is morally acceptable, which is a major increase since earlier versions of the same poll. But the poll also found that polygamy was among the least acceptable behaviors considered in the study; for example, polygamy was far less acceptable than consensual sex between teenagers, though it was more acceptable than a married person having an affair (Brenan 2020). The act of entering into marriage while still married to another person is referred to as bigamy and is considered a felony in most states.
Residency and Lines of Descent
When considering one’s lineage, most people in the United States look to both their father’s and mother’s sides. Both paternal and maternal ancestors are considered part of one’s family. This pattern of tracing kinship is called bilateral descent. Note that kinship, or one’s traceable ancestry, can be based on blood or marriage or adoption. Sixty percent of societies, mostly modernized nations, follow a bilateral descent pattern. Unilateral descent (the tracing of kinship through one parent only) is practiced in the other 40 percent of the world’s societies, with high concentration in pastoral cultures (O’Neal 2006).
There are three types of unilateral descent: patrilineal, which follows the father’s line only; matrilineal, which follows the mother’s side only; and ambilineal, which follows either the father’s only or the mother’s side only, depending on the situation. In patrilineal societies, such as those in rural China and India, only males carry on the family surname. This gives males the prestige of permanent family membership while females are seen as only temporary members (Harrell 2001). U.S. society assumes some aspects of patrilineal decent. For instance, most children assume their father’s last name even if the mother retains her birth name.
In matrilineal societies, inheritance and family ties are traced to women. Matrilineal descent is common in Native American societies, notably the Crow and Cherokee tribes. In these societies, children are seen as belonging to the women and, therefore, one’s kinship is traced to one’s mother, grandmother, great grandmother, and so on (Mails 1996). In ambilineal societies, which are most common in Southeast Asian countries, parents may choose to associate their children with the kinship of either the mother or the father. This choice may be based on the desire to follow stronger or more prestigious kinship lines or on cultural customs such as men following their father’s side and women following their mother’s side (Lambert 2009).
Tracing one’s line of descent to one parent rather than the other can be relevant to the issue of residence. In many cultures, newly married couples move in with, or near to, family members. In a patrilocal residence system it is customary for the wife to live with (or near) her husband’s blood relatives (or family of orientation). Patrilocal systems can be traced back thousands of years. In a DNA analysis of 4,600-year-old bones found in Germany, scientists found indicators of patrilocal living arrangements (Haak et al 2008). Patrilocal residence is thought to be disadvantageous to women because it makes them outsiders in the home and community; it also keeps them disconnected from their own blood relatives. In China, where patrilocal and patrilineal customs are common, the written symbols for maternal grandmother (wáipá) are separately translated to mean “outsider” and “women” (Cohen 2011).
Similarly, in matrilocal residence systems, where it is customary for the husband to live with his wife’s blood relatives (or her family of orientation), the husband can feel disconnected and can be labeled as an outsider. The Minangkabau people, a matrilocal society that is indigenous to the highlands of West Sumatra in Indonesia, believe that home is the place of women and they give men little power in issues relating to the home or family (Joseph and Najmabadi 2003). Most societies that use patrilocal and patrilineal systems are patriarchal, but very few societies that use matrilocal and matrilineal systems are matriarchal, as family life is often considered an important part of the culture for women, regardless of their power relative to men.
Stages of Family Life
Figure 14.3 — 14.1 What Is Marriage? What Is a Family?
Figure 14.3 The ability for parents to socialize and the types of events they can attend is often influenced by the ages and characteristics of their children. Preparing to go out with a four-year-old is usually much easier than doing so with a four-month-old, but the four-year-old needs to be watched more carefully. As children grow and families have more children, and perhaps include extended families, members’ lives and perspective change. (Credit: Elvert Barnes/flickr)
As we’ve established, the concept of family has changed greatly in recent decades. Historically, it was often thought that many families evolved through a series of predictable stages. Developmental or “stage” theories used to play a prominent role in family sociology (Strong and DeVault 1992). Today, however, these models have been criticized for their linear and conventional assumptions as well as for their failure to capture the diversity of family forms. While reviewing some of these once-popular theories, it is important to identify their strengths and weaknesses.
The set of predictable steps and patterns families experience over time is referred to as the family life cycle. One of the first designs of the family life cycle was developed by Paul Glick in 1955. In Glick’s original design, he asserted that most people will grow up, establish families, rear and launch their children, experience an “empty nest” period, and come to the end of their lives. This cycle will then continue with each subsequent generation (Glick 1989). Glick’s colleague, Evelyn Duvall, elaborated on the family life cycle by developing these classic stages of family (Strong and DeVault 1992):
Stage Theory
Stage
Family Type
Children
1
Marriage Family
Childless
2
Procreation Family
Children ages 0 to 2.5
3
Preschooler Family
Children ages 2.5 to 6
4
School-age Family
Children ages 6–13
5
Teenage Family
Children ages 13–20
6
Launching Family
Children begin to leave home
7
Empty Nest Family
“Empty nest”; adult children have left home
Table
14.1
This table shows one example of how a “stage” theory might categorize the phases a family goes through.
The family life cycle was used to explain the different processes that occur in families over time. Sociologists view each stage as having its own structure with different challenges, achievements, and accomplishments that transition the family from one stage to the next. For example, the problems and challenges that a family experiences in Stage 1 as a married couple with no children are likely much different than those experienced in Stage 5 as a married couple with teenagers. The success of a family can be measured by how well they adapt to these challenges and transition into each stage. While sociologists use the family life cycle to study the dynamics of family over time, consumer and marketing researchers have used it to determine what goods and services families need as they progress through each stage (Murphy and Staples 1979).
As early “stage” theories have been criticized for generalizing family life and not accounting for differences in gender, ethnicity, culture, and lifestyle, less rigid models of the family life cycle have been developed. One example is the family life course, which recognizes the events that occur in the lives of families but views them as parting terms of a fluid course rather than in consecutive stages (Strong and DeVault 1992). This type of model accounts for changes in family development, such as the fact that in today’s society, childbearing does not always occur with marriage. It also sheds light on other shifts in the way family life is practiced. Society’s modern understanding of family rejects rigid “stage” theories and is more accepting of new, fluid models.
Sociology in the Real World
The Evolution of Television Families
Whether you grew up watching the Huxtables, the Simpsons, the Kardashians, or the Johnsons, most of the drama or comedy you saw involved the relationships, tensions, challenges, and sometimes ridiculousness of family life. You may have also seen a great deal of change. The 1960s was the height of the suburban U.S. nuclear family on television with shows such as The Donna Reed Show and Father Knows Best. While some shows of this era portrayed single parents (My Three Sons and Bonanza, for instance), the single status almost always resulted from being widowed—not divorced or unwed.
Although family dynamics in real U.S. homes were changing, the expectations for families portrayed on television were not. The United States’ first reality show, An American Family aired on PBS in 1973. The show chronicled Bill and Pat Loud and their children. During the series, the oldest son, Lance, announced to the family that he was gay, and at the series’ conclusion, Bill and Pat decided to divorce. Although the Loud’s union was among the 30 percent of marriages that ended in divorce in 1973, the family was featured on the cover of the March 12 issue of Newsweek with the title “The Broken Family” (Ruoff 2002).
Less traditional family structures in sitcoms gained popularity in the 1980s with shows such as Diff’rent Strokes (a widowed man with two adopted African American sons) and One Day at a Time (a divorced woman with two teenage daughters). Still, traditional families such as those in Family Ties and The Cosby Show dominated the ratings. The late 1980s and the 1990s saw the introduction of the dysfunctional family. Shows such as Roseanne, Married with Children, and The Simpsons portrayed traditional nuclear families, but in a much less flattering light than those from the 1960s did (Museum of Broadcast Communications 2011).
In the early 2000s, the nontraditional family has become somewhat of a tradition in television. While many situation comedies focus on single men and women without children, those that do portray families often stray from the classic structure: they include unmarried and divorced parents, adopted children, gay or lesbian couples, and multigenerational households.
In 2009, ABC emphasized the changes in family dynamics with their choice of title for Modern Family. The show follows an extended family—which is a household that includes at least one parent and child as well as other relatives like grandparents, aunts, uncles, and cousins—that consists of a divorced and remarried father with one stepchild and his biological adult children, one of whom is in a traditional two-parent household and the other who is a gay man in a committed relationship raising an adopted daughter. Black-ish, which portrays an extended family of African Americans, has at many times dealt with the issue implied by its name: That sometimes what it means to be Black can bring issues of interpretation conflict, especially across generations. For example, the children of the central family have shown interest in “blending in” with their White friends, which brings negative reactions from their grandparents.
Other shows, such as Shameless, interweave family diversity with complex and painful issues such as addiction. The series has a large cast of characters representing different groups, and central to the series are the roles of children, rather than parents, as family leaders. “The families on shows like this one aren’t as idealistic, but they remain relatable,” states television critic Maureen Ryan. “The most successful shows, comedies especially, have families that you can look at and see parts of your family in them” (Respers France 2010).
14.2 Variations in Family Life
OpenStax · 14.2 Variations in Family Life ↗ Instructional page including learning objectives, examples, figures, source tables and questions. Site navigation and embedded media players are omitted; source media links remain available.
Learning Objectives
By the end of this section, you should be able to:
Recognize variations in family life
Explain the prevalence and unique characteristics of single parents, blended families, foster care, cohabitation, same-sex couples, and unmarried individuals
Discuss the social impact of changing family structures
The combination of husband, wife, and children that 99.8 percent of people in the United States believe constitutes a family is not representative of 99.8 percent of U.S. families. According to 2010 census data, only 66 percent of children under seventeen years old live in a household with two married parents. This is a decrease from 77 percent in 1980 (U.S. Census 2011). This two-parent family structure is known as a nuclear family, referring to married parents and children as the nucleus, or core, of the group. Recent years have seen a rise in variations of the nuclear family with the parents not being married. Three percent of children live with two cohabiting parents (U.S. Census 2011).
Figure 14.4 — 14.2 Variations in Family Life
Figure 14.4 Military families sometimes have to endure long parental absences. The other parent or other family members, including older siblings, often take on more responsibility during deployments. The serving parent faces stress and detachment when they are away. (Credit: The National Guard.)
Single Parents, Blended Families, and Foster Families
Single-parent households are on the rise. In 2017, 32 percent of children lived with a single parent only, up from 25 percent in 2008. Of that 32 percent, 21 percent live with their mother. Four percent live with their father, which is a percentage that is growing in share; in 1968, for example, only one percent of children lived with a solo father, and three percent lived with a solo father in 2008 (Livingston 2018).
About 16 percent of children are living in blended families, those with step parents and/or step-siblings. This number has remained relatively stable since the 1980s when the Census Bureau began reliably measuring it. Four percent of children live in families with couples who are not married. (That number is partially composed of parents in same-sex relationships who were previously prohibited from getting married.)
In some cases, parents can no longer care for their children. In 2018, three million children lived with a guardian who was neither their biological nor adoptive parent. The causes range from parental mental health issues, drug use, or incarceration, as well as physical or sexual abuse of the children by the parent, or abandonment by the parent. The wide array of causes leads to a similarly wide array of arrangements and types of people and organizations involved. About half of these children live with grandparents, and about 20 percent live with other relatives (ChildStats 2019). Sometimes a grandparent or other relative temporarily assumes care of children, perhaps informally, while other times the arrangement is longer term and the state or city child welfare or similar department is involved.
25 percent of children who do not live with an adoptive or biological parent live with nonrelatives, including foster parents, temporary guardians, or people in other types of relationships with the child or the child's parents. Non-relative foster parents are state-certified adults, who care for children under the guidance and supervision of a relevant agency. Foster parents comply with guideline and are provided with financial support for the children they care for. (Sometimes the term foster parent refers to a relative who cares for the children under agency guidelines, and sometimes these "kinship" foster parents are also provided financial support.)
When children are placed into foster care or other non-parental care, agencies and families usually do their best to keep siblings together. Brothers and sisters usually provide each other with someone to navigate social challenges and provide continuity over time. Studies have shown that siblings placed together show more closeness to their foster caregivers and like living in the foster home more than those not placed with a sibling (Hegar and Rosenthal, 2011). Separating siblings can cause them to worry about each other or their birth families, and slows acceptance of their new home (Affronti, Rittner, & Semanchin Jones, 2015).
Siblings sometimes play more of a parental role themselves, especially when there are large age gaps or if there are very young children involved. These older siblings may take on some parental responsibilities during a divorce or when children are sent to live with others. "Parentified" siblings may have trouble navigating the complexities of parental roles when they themselves are often still very young. These experiences can actually be traumatic and lead to compulsive disorders as well as lifelong issues with relationships and self-care (Lamothe 2017)
Changes in the traditional family structure raise questions about how such societal shifts affect children. U.S. Census statistics have long shown that children living in homes with both parents grow up with more financial and educational advantages than children who are raised in single-parent homes (U.S. Census 1997). Parental marital status seems to be a significant indicator of advancement in a child’s life. Children living with a divorced parent typically have more advantages than children living with a parent who never married; this is particularly true of children who live with divorced fathers. This correlates with the statistic that never-married parents are typically younger, have fewer years of schooling, and have lower incomes (U.S. Census 1997). Six in ten children living with only their mother live near or below the poverty level. Of those being raised by single mothers, 69 percent live in or near poverty compared to 45 percent for divorced mothers (U.S. Census 1997). Though other factors such as age and education play a role in these differences, it can be inferred that marriage between parents is generally beneficial for children.
Cohabitation
Living together before or in lieu of marriage is a growing option for many couples. Cohabitation is when two people live together in a sexual relationship without being married. In 2018, 15 percent of young adults ages 25-34 live with an unmarried partner, up from 12 percent 10 years ago (Gurrentz 2018). This surge in cohabitation is likely due to the decrease in social stigma pertaining to the practice. 69 percent of surveyed Americans believe it is acceptable for adults to live together if they are not currently married or do not plan to get married, while 16 percent say it is acceptable only if they plan to get married. (Horowitz 2019).
Cohabitating couples may choose to live together in an effort to spend more time together or to save money on living costs. Many couples view cohabitation as a “trial run” for marriage. 66 percent of married couples who cohabited but were not engaged saw cohabitation as a step toward marriage. And 44 percent of cohabiting adults who are not yet engaged or married see moving in with their partner as a step toward marriage (Horowitz 2019).
While couples may use this time to “work out the kinks” of a relationship before they wed, the most recent research has found that cohabitation has little effect on the success of a marriage. In fact, those who do not cohabitate before marriage have slightly better rates of remaining married for more than ten years (Jayson 2010). Cohabitation may contribute to the increase in the number of men and women who delay marriage. The median age for marriage is the highest it has ever been since the U.S. Census kept records—age twenty-six for women and age twenty-eight for men (U.S. Census 2010).
Figure 14.5 — 14.2 Variations in Family Life
Figure 14.5 As shown by this graph of marital status percentages among young adults, more young people are choosing to delay or opt out of marriage, while the number of people living with a partner has increased. The overall number of people living with either a spouse or a partner has also declined. (Credit: U.S. Census Bureau)
Figure 14.6 After being together for 23 years, Phyllis Siegel (standing) and Connie Kopolev were the first same-sex couple to marry in New York City. (Credit: TJ Sengal/flickr)
The number of same-sex couples has grown significantly in the past decade. The U.S. Census Bureau reported 594,000 same-sex couple households in the United States, a 50 percent increase from 2000. This increase is a result of more coupling, the growing social acceptance of LGBTQ people, and a subsequent increase in people’s willingness to share more about their identity. Nationally, same-sex couple households make up 1.5 percent of the total partner-headed households in the United States (U.S. Census Bureau 2020). When the 2015 Obergefell vs. Hodges Supreme Court decision legalized same-sex marriage throughout the United States, all federally mandated spousal rights and benefits began to apply to same-sex married couples. These have impacts on Social Security and veterans benefits, family leave, and so on. For example, when same-sex marriage was not legal, an LGBTQ person couldn't take the same type of family leave as an opposite sex spouse could if their partner became ill, and could even be prohibited from visiting their partner in the hospital.
In terms of demographics, same-sex couples are not very different from opposite-sex couples. Same-sex couple households have an average age of 52 and an average annual household income of about $107,000; opposite-sex couple households have an average age of 59 and an average household income of $97,000. Same-sex couples are less likely to have children under 18-years-old, with a rate of 14 percent compared to 38 percent of opposite-sex couples; note these include both married and unmarried couples (Census Bureau 2020).
In an analysis of 81 parenting studies, sociologists found no quantifiable data to support the notion that opposite-sex parenting is any better than same-sex parenting. Children of lesbian couples, however, were shown to have slightly lower rates of behavioral problems and higher rates of self-esteem (Biblarz and Stacey 2010). Prior to the nationwide legalization, studies also showed that the rate of suicide among high school students declined in states where same-sex marriage was legal. Suicide is the second-highest cause of death among high school students, and it is a tragic outcome for LGBTQ teenagers who feel unaccepted or vulnerable. The evidence indicates that the legalization of same-sex marriage had positive outcomes for the emotional and mental wellbeing of LGBTQ people (Johns Hopkins University 2017).
Staying Single
About three-in-ten American adults report that they are single, meaning that they are neither married nor in a committed relationship. That group varies greatly by age and gender. Half of men below age 30 are single, compared with about a quarter of men between ages 30-64. About 30 percent of women under 30 are single, and that drops to 19 percent for women between 30 and 60 years-old. There are also differences among racial lines, with White and Hispanic adults less likely to be single than are Black people. Single individuals are found in higher concentrations in large cities or metropolitan areas, with New York City being one of the highest.
Although both single men and single women report social pressure to get married, women are subject to greater scrutiny. Single women are often portrayed as unhappy or in some way lacking something they should have. Single men, on the other hand, are typically portrayed as lifetime bachelors who cannot settle down or simply “have not found the right girl.” Single women report feeling insecure and displaced in their families when their single status is disparaged (Roberts 2007). However, single women older than thirty-five years old report feeling secure and happy with their unmarried status, as many women in this category have found success in their education and careers. In general, women feel more independent and more prepared to live a large portion of their adult lives without a spouse or domestic partner than they did in the 1960s (Roberts 2007).
The decision to marry or not to marry can be based on a variety of factors including religion and cultural expectations. Asian individuals are the most likely to marry, while African Americans are the least likely to marry (Venugopal 2011). Additionally, individuals who place no value on religion are more likely to be unmarried than those who place a high value on religion. For Black women, however, the importance of religion made no difference in marital status (Bakalar 2010). In general, being single is not a rejection of marriage; rather, it is a lifestyle that does not necessarily include marriage.
Sociological Research
Deceptive Divorce Rates
It is often cited that half of all marriages end in divorce. This statistic has made many people cynical when it comes to marriage, but it is misleading. Let’s take a closer look at the data.
Using National Center for Health Statistics data from 2003 that show a marriage rate of 7.5 (per 1000 people) and a divorce rate of 3.8, it would appear that exactly one half of all marriages failed (Hurley 2005). This reasoning is deceptive, however, because instead of tracing actual marriages to see their longevity (or lack thereof), this compares what are unrelated statistics: that is, the number of marriages in a given year does not have a direct correlation to the divorces occurring that same year. Research published in the New York Times took a different approach—determining how many people had ever been married, and of those, how many later divorced. The result? According to this analysis, U.S. divorce rates have only gone as high as 41 percent (Hurley 2005). Another way to calculate divorce rates would be through a cohort study. For instance, we could determine the percentage of marriages that are intact after, say, five or seven years, compared to marriages that have ended in divorce after five or seven years. Sociological researchers must remain aware of research methods and how statistical results are applied. As illustrated, different methodologies and different interpretations can lead to contradictory, and even misleading, results.
Theoretical Perspectives on Marriage and Family
Sociologists study families on both the macro and micro level to determine how families function. Sociologists may use a variety of theoretical perspectives to explain events that occur within and outside of the family.
When considering the role of family in society, functionalists uphold the notion that families are an important social institution and that they play a key role in stabilizing society. They also note that family members take on status roles in a marriage or family. The family—and its members—perform certain functions that facilitate the prosperity and development of society.
Sociologist George Murdock conducted a survey of 250 societies and determined that there are four universal residual functions of the family: sexual, reproductive, educational, and economic (Lee 1985). According to Murdock, the family (which for him includes the state of marriage) regulates sexual relations between individuals. He does not deny the existence or impact of premarital or extramarital sex, but states that the family offers a socially legitimate sexual outlet for adults (Lee 1985). This outlet gives way to reproduction, which is a necessary part of ensuring the survival of society.
Once children are produced, the family plays a vital role in training them for adult life. As the primary agent of socialization and enculturation, the family teaches young children the ways of thinking and behaving that follow social and cultural norms, values, beliefs, and attitudes. Parents teach their children manners and civility. A well-mannered child reflects a well-mannered parent.
Parents also teach children gender roles. Gender roles are an important part of the economic function of a family. In each family, there is a division of labor that consists of instrumental and expressive roles. Men tend to assume the instrumental roles in the family, which typically involve work outside of the family that provides financial support and establishes family status. Women tend to assume the expressive roles, which typically involve work inside of the family which provides emotional support and physical care for children (Crano and Aronoff 1978). According to functionalists, the differentiation of the roles on the basis of sex ensures that families are well balanced and coordinated. When family members move outside of these roles, the family is thrown out of balance and must recalibrate in order to function properly. For example, if the father assumes an expressive role such as providing daytime care for the children, the mother must take on an instrumental role such as gaining paid employment outside of the home in order for the family to maintain balance and function.
Conflict theorists are quick to point out that U.S. families have been defined as private entities, the consequence of which has been to leave family matters to only those within the family. Many people in the United States are resistant to government intervention in the family: parents do not want the government to tell them how to raise their children or to become involved in domestic issues. Conflict theory highlights the role of power in family life and contends that the family is often not a haven but rather an arena where power struggles can occur. This exercise of power often entails the performance of family status roles. Conflict theorists may study conflicts as simple as the enforcement of rules from caretaker to child, or they may examine more serious issues such as domestic violence (spousal and child), sexual assault, marital rape, and incest.
The first study of marital power was performed in 1960. Researchers found that the person with the most access to value resources held the most power. As money is one of the most valuable resources, men who worked in paid labor outside of the home held more power than women who worked inside the home (Blood and Wolfe 1960). Conflict theorists find disputes over the division of household labor to be a common source of marital discord. Household labor offers no wages and, therefore, no power. Studies indicate that when men do more housework, women experience more satisfaction in their marriages, reducing the incidence of conflict (Coltrane 2000). In general, conflict theorists tend to study areas of marriage and life that involve inequalities or discrepancies in power and authority, as they are reflective of the larger social structure.
Interactionists view the world in terms of symbols and the meanings assigned to them (LaRossa and Reitzes 1993). The family itself is a symbol. To some, it is a father, mother, and children; to others, it is any union that involves respect and compassion. Interactionists stress that family is not an objective, concrete reality. Like other social phenomena, it is a social construct that is subject to the ebb and flow of social norms and ever-changing meanings.
Consider the meaning of other elements of family: “parent” was a symbol of a biological and emotional connection to a child; with more parent-child relationships developing through adoption, remarriage, or change in guardianship, the word “parent” today is less likely to be associated with a biological connection than with whoever is socially recognized as having the responsibility for a child’s upbringing. Similarly, the terms “mother” and “father” are no longer rigidly associated with the meanings of caregiver and breadwinner. These meanings are more free-flowing through changing family roles.
Interactionists also recognize how the family status roles of each member are socially constructed, playing an important part in how people perceive and interpret social behavior. Interactionists view the family as a group of role players or “actors” that come together to act out their parts in an effort to construct a family. These roles are up for interpretation. In the late nineteenth and early twentieth century, a “good father,” for example, was one who worked hard to provide financial security for his children. Today, a “good father” is one who takes the time outside of work to promote his children’s emotional well-being, social skills, and intellectual growth—in some ways, a much more daunting task.
14.3 Challenges Families Face
OpenStax · 14.3 Challenges Families Face ↗ Instructional page including learning objectives, examples, figures, source tables and questions. Site navigation and embedded media players are omitted; source media links remain available.
Learning Objectives
By the end of this section, you should be able to:
Describe the social and interpersonal impact of divorce
Describe the social and interpersonal impact of family abuse
As the structure of family changes over time, so do the challenges families face. Events like divorce and remarriage present new difficulties for families and individuals. Other long-standing domestic issues such as abuse continue to strain the health and stability of today’s families.
Divorce and Remarriage
Divorce, while fairly common and accepted in modern U.S. society, was once a word that would only be whispered and was accompanied by gestures of disapproval. In 1960, divorce was generally uncommon, affecting only 9.1 out of every 1,000 married persons. That number more than doubled (to 20.3) by 1975 and peaked in 1980 at 22.6. Over the last quarter century, divorce rates have dropped steadily and are now similar to those in 1970 (Wang 2020). The dramatic increase in divorce rates after the 1960s has been associated with the liberalization of divorce laws, as well as the shift in societal makeup due to women increasingly entering the workforce (Michael 1978). The decrease in divorce rates can be attributed to three probable factors: First, an increase in the age at which people get married, and second, an increased level of education among those who marry—both of which have been found to promote greater marital stability. The third factor is that the marriage rate itself is going down, and with it the divorce rate. In 2019, there were 16.3 new marriages for every 1,000 women age 15 and over in the United States, down from 17.6 in 2009 (Anderson 2020).
Divorce does not occur equally among all people in the United States; some segments of the U.S. population are more likely to divorce than others. According to the American Community Survey (ACS), men and women in the Northeast and Midwest have the lowest rates of divorce. The South generally has the highest rate of divorce. Divorce rates are likely higher in the South because marriage rates are higher and marriage occurs at younger-than-average ages in this region. In the Northeast, the marriage rate is lower and first marriages tend to be delayed; therefore, the divorce rate is lower (Reynolds 2020). Note that these are generalizations. For example, the District of Columbia has a high marriage rate but among the lowest divorce rate (Anderson 2020).
So what causes divorce? While more young people are choosing to postpone or opt out of marriage, those who enter into the union do so with the expectation that it will last. A great deal of marital problems can be related to stress, especially financial stress. According to researchers participating in the University of Virginia’s National Marriage Project, couples who enter marriage without a strong asset base (like a home, savings, and a retirement plan) are 70 percent more likely to be divorced after three years than are couples with at least $10,000 in assets. This is connected to factors such as age and education level that correlate with low incomes.
The addition of children to a marriage creates added financial and emotional stress. Research has established that marriages enter their most stressful phase upon the birth of the first child (Popenoe and Whitehead 2007). This is particularly true for couples who have multiples (twins, triplets, and so on). Married couples with twins or triplets are 17 percent more likely to divorce than those with children from single births (McKay 2010). Another contributor to the likelihood of divorce is a general decline in marital satisfaction over time. As people get older, they may find that their values and life goals no longer match up with those of their spouse (Popenoe and Whitehead 2004).
Divorce is thought to have a cyclical pattern. Children of divorced parents are 40 percent more likely to divorce than children of married parents. And when we consider children whose parents divorced and then remarried, the likelihood of their own divorce rises to 91 percent (Wolfinger 2005). This might result from being socialized to a mindset that a broken marriage can be replaced rather than repaired (Wolfinger 2005). That sentiment is also reflected in the finding that when both partners of a married couple have been previously divorced, their marriage is 90 percent more likely to end in divorce (Wolfinger 2005).
Figure 14.7 — 14.3 Challenges Families Face
Figure 14.7 A study from Radford University indicated that bartenders are among the professions with the highest divorce rates (38.4 percent). Other traditionally low-wage industries (like restaurant service, custodial employment, and factory work) are also associated with higher divorce rates. (Aamodt and McCoy 2010). (Credit: Daniel Lobo/flickr)
About 15 percent of all married couples involve one partner who is in their second marriage while the other partner is in their first marriage. About 9 percent of married couples are both in their second marriage. (U.S. Census Bureau 2015). The vast majority (91 percent) of remarriages occur after divorce; only 9 percent occur after death of a spouse (Kreider 2006). Most men and women remarry within five years of a divorce, with the median length for men (three years) being lower than for women (4.4 years). This length of time has been fairly consistent since the 1950s. The majority of those who remarry are between the ages of twenty-five and forty-four (Kreider 2006). The general pattern of remarriage also shows that White people are more likely to remarry than Black people.
Marriage the second time around (or third or fourth) can be a very different process than the first. Remarriage lacks many of the classic courtship rituals of a first marriage. In a second marriage, individuals are less likely to deal with issues like parental approval, premarital sex, or desired family size (Elliot 2010). In a survey of households formed by remarriage, a mere 8 percent included only biological children of the remarried couple. Of the 49 percent of homes that include children, 24 percent included only the woman’s biological children, 3 percent included only the man’s biological children, and 9 percent included a combination of both spouse’s children (U.S. Census Bureau 2006).
Children of Divorce and Remarriage
Divorce and remarriage can be stressful on partners and children alike. Divorce is often justified by the notion that children are better off in a divorced family than in a family with parents who do not get along. However, long-term studies determine that to be generally untrue. Research suggests that while marital conflict does not provide an ideal childrearing environment, going through a divorce can be damaging. Children are often confused and frightened by the threat to their family security. They may feel responsible for the divorce and attempt to bring their parents back together, often by sacrificing their own well-being (Amato 2000). Only in high-conflict homes do children benefit from divorce and the subsequent decrease in conflict. The majority of divorces come out of lower-conflict homes, and children from those homes are more negatively impacted by the stress of the divorce than the stress of unhappiness in the marriage (Amato 2000). Studies also suggest that stress levels for children are not improved when a child acquires a stepfamily through marriage. Although there may be increased economic stability, stepfamilies typically have a high level of interpersonal conflict (McLanahan and Sandefur 1994).
Children’s ability to deal with a divorce may depend on their age. Research has found that divorce may be most difficult for school-aged children, as they are old enough to understand the separation but not old enough to understand the reasoning behind it. Older teenagers are more likely to recognize the conflict that led to the divorce but may still feel fear, loneliness, guilt, and pressure to choose sides. Infants and preschool-age children may suffer the heaviest impact from the loss of routine that the marriage offered (Temke 2006).
Proximity to parents also makes a difference in a child’s well-being after divorce. Boys who live or have joint arrangements with their fathers show less aggression than those who are raised by their mothers only. Similarly, girls who live or have joint arrangements with their mothers tend to be more responsible and mature than those who are raised by their fathers only. Nearly three-fourths of the children of parents who are divorced live in a household headed by their mother, leaving many boys without a father figure residing in the home (U.S. Census Bureau 2011b). Still, researchers suggest that a strong parent-child relationship can greatly improve a child’s adjustment to divorce (Temke 2006).
There is empirical evidence that divorce has not discouraged children in terms of how they view marriage and family. A blended family has additional stress resulting from combining children from the current and previous relationships. The blended family may also have a parent that has different discipline techniques. In a survey conducted by researchers from the University of Michigan, about three-quarters of high school seniors said it was “extremely important” to have a strong marriage and family life. And over half believed it was “very likely” that they would be in a lifelong marriage (Popenoe and Whitehead 2007). These numbers have continued to climb over the last twenty-five years.
Violence and Abuse
Violence and abuse are among the most disconcerting of the challenges that today’s families face. Abuse can occur between spouses, between parent and child, as well as between other family members. The frequency of violence among families is a difficult to determine because many cases of spousal abuse and child abuse go unreported. In any case, studies have shown that abuse (reported or not) has a major impact on families and society as a whole.
Domestic Violence
Domestic violence is a significant social problem in the United States. It is often characterized as violence between household or family members, specifically spouses. To include unmarried, cohabitating, and same-sex couples, family sociologists have created the term intimate partner violence (IPV). (Note that healthcare and support personnel, researchers, or victims may use these terms or related ones interchangeably to refer to the same general issue of violence, aggression, and abuse.) Women are the primary victims of intimate partner violence. It is estimated that one in five women has experienced some form of IPV in her lifetime (compared to one in seven men) (Catalano 2007). IPV may include physical violence, such as punching, kicking, or other methods of inflicting physical pain; sexual violence, such as rape or other forced sexual acts; threats and intimidation that imply either physical or sexual abuse; and emotional abuse, such as harming another’s sense of self-worth through words or controlling another’s behavior. IPV often starts as emotional abuse and then escalates to other forms or combinations of abuse (Centers for Disease Control 2012). IPV includes stalking as well as technological violence (sometimes called cyber aggression), which is committed through communications/social networks or which uses cameras or other technologies to harm victims or control their behavior (Watkins 2016).
Figure 14.8 — 14.3 Challenges Families Face
Figure 14.8 Many people have experienced intimate partner violence. Note that while data like this are important to consider and hopefully build awareness around IPV, there are gaps in both reporting and information gathering. For example, less information is known about IPV against transgender people, but analysis of various sources indicate that it is 1.7 times more likely to be committed against transgender people than against cisgender people, as described below. (Credit: Centers for Disease Control)
Beyond its tragic outcomes and damaging long-term effects, sociologists and other researchers seeking to understand and prevent IPV and support victims may find a wide variance in the data.
On a global scale, intimate partners kill over 130 women each day. The UN Office of Drugs and Crime reported that, “women continue to pay the highest price as a result of gender inequality, discrimination and negative stereotypes... They are also the most likely to be killed by intimate partners and family” (Doom 2018).
The types of violence can vary significantly according to gender. In 2010, of IPV acts that involved physical actions against women, 57 percent involved physical violence only; 9 percent involved rape and physical violence; 14 percent involved physical violence and stalking; 12 percent involved rape, physical violence, and stalking; and 4 percent involved rape only (CDC 2011). This is vastly different than IPV abuse patterns for men, which show that nearly all (92 percent) physical acts of IVP take the form of physical violence and fewer than 1 percent involve rape alone or in combination (Catalano 2007). Perpetrators of IPV work to establish and maintain dependence in order to hold power and control over their victims, making them feel stupid, crazy, or ugly—in some way worthless.
IPV affects different segments of the population at different rates. The rate of IPV for Native American and Alaskan Native women is higher than any other race (Bureau of Justice Statistics 2017). The rate of IPV for Black women (4.6 per 1,000 persons over the age of twelve) is higher than that for White women (3.1). These numbers have been fairly stable for both racial groups over the last ten years.
Accurate statistics on IPV are difficult to determine, as it is estimated that more than half of nonfatal IPV goes unreported. It is not until victims choose to report crimes that patterns of abuse are exposed. Most victims studied stated that abuse had occurred for at least two years prior to their first report (Carlson, Harris, and Holden 1999). Also, studies and research methods apply a range of categories, which makes comparative or reinforcing data difficult to obtain. For example, some studies may only ask about IPV in two categories (for example, physical and sexual violence only) and may find fewer respondents reporting IPV than do studies that add psychological abuse, stalking, and technological violence.
Sometimes abuse is reported to police by a third party, but it still may not be confirmed by victims. A study of domestic violence incident reports found that even when confronted by police about abuse, 29 percent of victims denied that abuse occurred. Surprisingly, 19 percent of their assailants were likely to admit to abuse (Felson, Ackerman, and Gallagher 2005). According to the National Criminal Victims Survey, victims cite varied reasons why they are reluctant to report abuse, as shown in the table below.
Reason Abuse Is Unreported
% Females
% Males
Considered a Private Matter
22
39
Fear of Retaliation
12
5
To Protect the Abuser
14
16
Belief That Police Won’t Do Anything
8
8
Table
14.2
This chart shows reasons that victims give for why they fail to report abuse to police authorities (Catalano 2007).
IPV against LGBTQ people is generally higher than it is against non-LGBTQ people. Gay men report experiencing IPV in their lifetimes less often (26 percent) than straight men (29 percent) or bisexual men (37 percent). 44 percent of lesbian women report experiencing some type of IPV in their lifetime, compared to 35 percent of straight women. 61 percent of bisexual women report experiencing IPV, a much higher rate than any other sexual orientation frequently studied.
Studies regarding intimate partner violence against transgender people are relatively limited, but several are ongoing. A meta-analysis of available information indicated that physical IPV had occurred in the lifetimes of 38 percent of transgender people, and 25 percent of transgender people had experienced sexual IPV in their lifetimes. Compared with cisgender individuals, transgender individuals were 1.7 times more likely to experience any IPV (Peitzmeier 2020).
Many college students encounter IPV, as well. Overall, psychological violence seems to be the type of IPV college students face most frequently, followed by physical and/or sexual violence (Cho & Huang, 2017). Of high schoolers who report being in a dating relationship, 10% experience physical violence by a boyfriend or girlfriend, 7% experience forced sexual intercourse, and 11% experience sexual dating violence. Seven percent of women and four percent of men who experience IPV are victimized before age 18 (NCJRS 2017). IPV victimization during young adulthood, including the college years, is likely to lead to continuous victimization in adulthood, possibly throughout a lifetime (Greenman & Matsuda, 2016)
Child Abuse
Children are among the most helpless victims of abuse. In 2010, there were more than 3.3 million reports of child abuse involving an estimated 5.9 million children (Child Help 2011). Three-fifths of child abuse reports are made by professionals, including teachers, law enforcement personnel, and social services staff. The rest are made by anonymous sources, other relatives, parents, friends, and neighbors.
Child abuse may come in several forms, the most common being neglect (78.3 percent), followed by physical abuse (10.8 percent), sexual abuse (7.6 percent), psychological maltreatment (7.6 percent), and medical neglect (2.4 percent) (Child Help 2011). Some children suffer from a combination of these forms of abuse. The majority (81.2 percent) of perpetrators are parents; 6.2 percent are other relatives.
Infants (children less than one year old) were the most victimized population with an incident rate of 20.6 per 1,000 infants. This age group is particularly vulnerable to neglect because they are entirely dependent on parents for care. Some parents do not purposely neglect their children; factors such as cultural values, standard of care in a community, and poverty can lead to hazardous level of neglect. If information or assistance from public or private services are available and a parent fails to use those services, child welfare services may intervene (U.S. Department of Health and Human Services).
Figure 14.9 — 14.3 Challenges Families Face
Figure 14.9 Dr. Michael C. Irving’s monument for child abuse survivors is composed of handprints and messages of people who have been victims of abuse. (Credit: Harvey K/flickr)
Infants are also often victims of physical abuse, particularly in the form of violent shaking. This type of physical abuse is referred to as shaken-baby syndrome, which describes a group of medical symptoms such as brain swelling and retinal hemorrhage resulting from forcefully shaking or causing impact to an infant’s head. A baby’s cry is the number one trigger for shaking. Parents may find themselves unable to soothe a baby’s concerns and may take their frustration out on the child by shaking him or her violently. Other stress factors, such as a poor economy, unemployment, and general dissatisfaction with parental life, may contribute this type of abuse. While there is no official central registry of shaken-baby syndrome statistics, it is estimated that each year 1,400 babies die or suffer serious injury from being shaken (Barr 2007).
Social Policy and Debate
Corporal Punishment
Physical abuse in children may come in the form of beating, kicking, throwing, choking, hitting with objects, burning, or other methods. Injury inflicted by such behavior is considered abuse even if the parent or caregiver did not intend to harm the child. Other types of physical contact that are characterized as discipline (spanking, for example) are not considered abuse as long as no injury results (Child Welfare Information Gateway 2008).
This issue is rather controversial among modern-day people in the United States. While some parents feel that physical discipline, or corporal punishment, is an effective way to respond to bad behavior, others feel that it is a form of abuse. According to a poll conducted by ABC News, 65 percent of respondents approve of spanking and 50 percent said that they sometimes spank their child.
Tendency toward physical punishment may be affected by culture and education. Those who live in the South are more likely than those who live in other regions to spank their child. Those who do not have a college education are also more likely to spank their child (Crandall 2011). Currently, 23 states officially allow spanking in the school system; however, many parents may object and school officials must follow a set of clear guidelines when administering this type of punishment (Crandall 2011). Studies have shown that spanking is not an effective form of punishment and may lead to aggression by the victim, particularly in those who are spanked at a young age (Berlin 2009).
Child abuse occurs at all socioeconomic and education levels and crosses ethnic and cultural lines. Just as child abuse is often associated with stresses felt by parents, including financial stress, parents who demonstrate resilience to these stresses are less likely to abuse (Samuels 2011). Young parents are typically less capable of coping with stresses, particularly the stress of becoming a new parent. Teenage mothers are more likely to abuse their children than their older counterparts. As a parent’s age increases, the risk of abuse decreases. Children born to mothers who are fifteen years old or younger are twice as likely to be abused or neglected by age five than are children born to mothers ages twenty to twenty-one (George and Lee 1997).
Drug and alcohol use is also a known contributor to child abuse. Children raised by substance abusers have a risk of physical abuse three times greater than other kids, and neglect is four times as prevalent in these families (Child Welfare Information Gateway 2011). Other risk factors include social isolation, depression, low parental education, and a history of being mistreated as a child. Approximately 30 percent of abused children will later abuse their own children (Child Welfare Information Gateway 2006).
The long-term effects of child abuse impact the physical, mental, and emotional wellbeing of a child. Injury, poor health, and mental instability occur at a high rate in this group, with 80 percent meeting the criteria of one or more psychiatric disorders, such as depression, anxiety, or suicidal behavior, by age twenty-one. Abused children may also suffer from cognitive and social difficulties. Behavioral consequences will affect most, but not all, of child abuse victims. Children of abuse are 25 percent more likely, as adolescents, to suffer from difficulties like poor academic performance and teen pregnancy, or to engage in behaviors like drug abuse and general delinquency. They are also more likely to participate in risky sexual acts that increase their chances of contracting a sexually transmitted disease (Child Welfare Information Gateway 2006). Other risky behaviors include drug and alcohol abuse. As these consequences can affect the health care, education, and criminal systems, the problems resulting from child abuse do not just belong to the child and family, but to society as a whole.