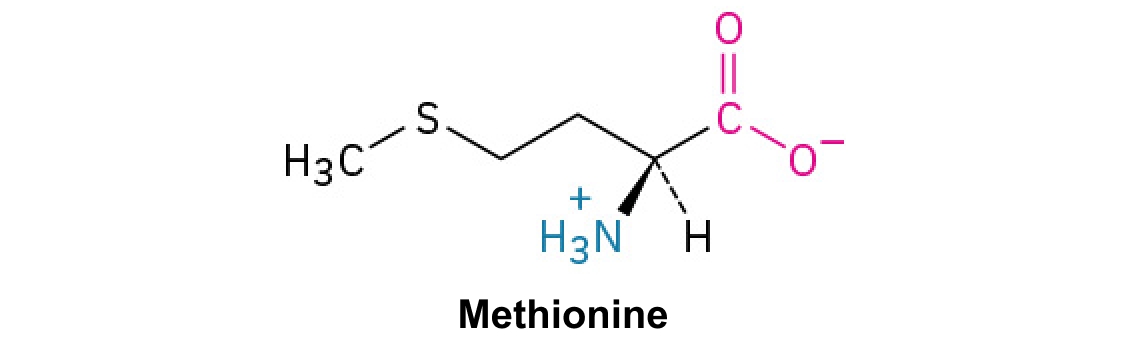
Foundation 1 · 1C · Inheritance and genetic diversity

Inheritance and genetic crosses

Sources ↗

remain discrete through generations; predict inheritance by separating , , and the assumptions behind each cross.

Why is hereditary material

Griffith found that heat-killed virulent could transform living nonvirulent into heritably virulent cells. This established a transferable transforming principle, not its chemical identity. Avery, MacLeod, and McCarty found that DNase destroyed transforming activity whereas and RNase did not, implicating .

Hershey and Chase labeled with and with sulfur-35. After infection, blending removed attached coats and separated from coats: most label entered the , while most label stayed in the supernatant. Follow the label into cells and progeny, and distinguish the causal treatment from the physical separation control.

Source: 14.1 Historical Basis of Modern Understanding · 12.2 Characteristics and Traits · 12.3 Laws of Inheritance

, , and observable traits

A is a functional hereditary sequence; its is its position. are alternative versions at that . A individual usually has two copies of an autosomal : identical make a , different a . The specifies the ; the is the measured outcome influenced by and environment. denotes a reference or commonly observed form and does not imply dominance, optimal function, or evolutionary ancestry. Different can produce the same , so alone often cannot identify the .

Source: 14.1 Historical Basis of Modern Understanding · 12.2 Characteristics and Traits · 12.3 Laws of Inheritance

Dominance does not measure frequency or

With , Aa and AA share the specified . gives an intermediate , whereas makes both detectable, as in ABO blood type AB. Dominance depends on the measured trait: activity may differ even when outward match. is the proportion of a group expressing a ; is its degree among affected individuals.

Reduced hybrid viability removes some before observation and changes expected offspring ratios. Hybrid sterility allows survival but prevents successful reproduction. Neither dominance nor a Mendelian ratio guarantees equal survival, fertility, or an environmentally invariant .

Source: 14.1 Historical Basis of Modern Understanding · 12.2 Characteristics and Traits · 12.3 Laws of Inheritance

Crosses, , and probability

Cross true-breeding AA and aa parents to obtain an all-Aa . Under and equal viability, Aa × Aa produces an ratio 1 AA:2 Aa:1 aa and ratio 3 :1 . Test an unknown by crossing it with aa: offspring demonstrate that the unknown parent is Aa, while a small all- sample does not prove AA.

Multiply probabilities for independent events: an AaBb × AaBb cross gives P(aabb)=1/4 × 1/4=1/16 when assort independently. Add probabilities for mutually exclusive outcomes. Among - offspring of Aa × Aa, P(Aa | )=2/3 because the class is excluded.

Source: 14.1 Historical Basis of Modern Understanding · 12.2 Characteristics and Traits · 12.3 Laws of Inheritance

Practice: apply the mechanism

Question. Two unaffected parents are carriers of a fully penetrant autosomal condition. What is the probability that their next two children include exactly one affected child? What is an unaffected child’s probability?

Show reasoning

Each conception has affected probability 1/4 and unaffected probability 3/4. Exactly one affected in two can occur in two orders: 2 × (1/4) × (3/4)=3/8. Among unaffected children, AA:Aa occur 1:2, so the probability is 2/3. Earlier births do not change the next conception’s probability under the stated assumptions.

Source: 14.1 Historical Basis of Modern Understanding · 12.2 Characteristics and Traits · 12.3 Laws of Inheritance

14.1 Historical Basis of Modern Understanding — figures and tables
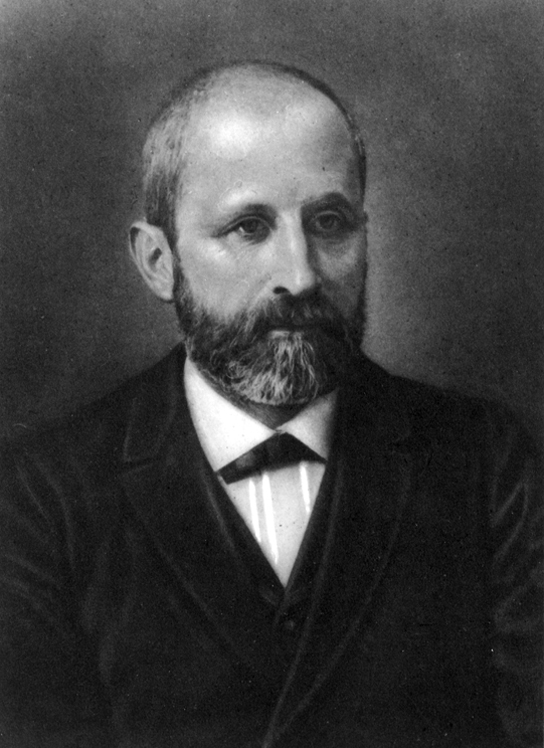
Photo of Friedrich Miescher.
Figure 14.2 — 14.1 Historical Basis of Modern Understanding

Figure 14.2 Friedrich Miescher (1844–1895) discovered nucleic acids.

Mary Ann Clark, Matthew Douglas, and Jung Choi, Biology 2E, OpenStax. · CC BY-NC-SA 4.0 · Original image ↗ · Access for free ↗
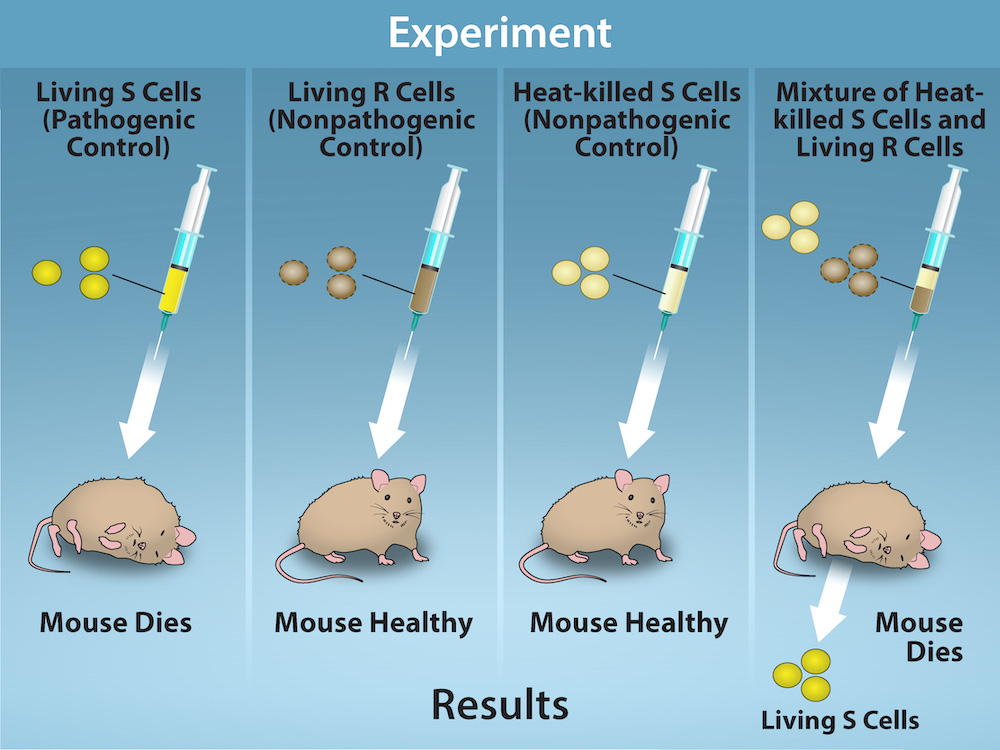
Four scenarios in an experiment are shown.  In the first, living S cells are injected, and the mouse dies. In the second, living R cells are injected, and the mouse is healthy. In the third, heat-killed S cells are injected, and the mouse is healthy. In the fourth, mixture of heat-killed S cells and Living R cells are injected, and the mouse dies and living S cells are recovered.
Figure 14.3 — 14.1 Historical Basis of Modern Understanding

Figure 14.3 Two strains of S. pneumoniae were used in Griffith’s transformation experiments. The R strain is non-pathogenic, whereas the S strain is pathogenic and causes death. When Griffith injected a mouse with the heat-killed S strain and a live R strain, the mouse died. The S strain was recovered from the dead mouse. Griffith concluded that something had passed from the heat-killed S strain to the R strain, transforming the R strain into the S strain in the process. Credit: Rao, A., Ryan, K. and Tag, A. Department of Biology, Texas A&M University.

Mary Ann Clark, Matthew Douglas, and Jung Choi, Biology 2E, OpenStax. · CC BY-NC-SA 4.0 · Original image ↗ · Access for free ↗
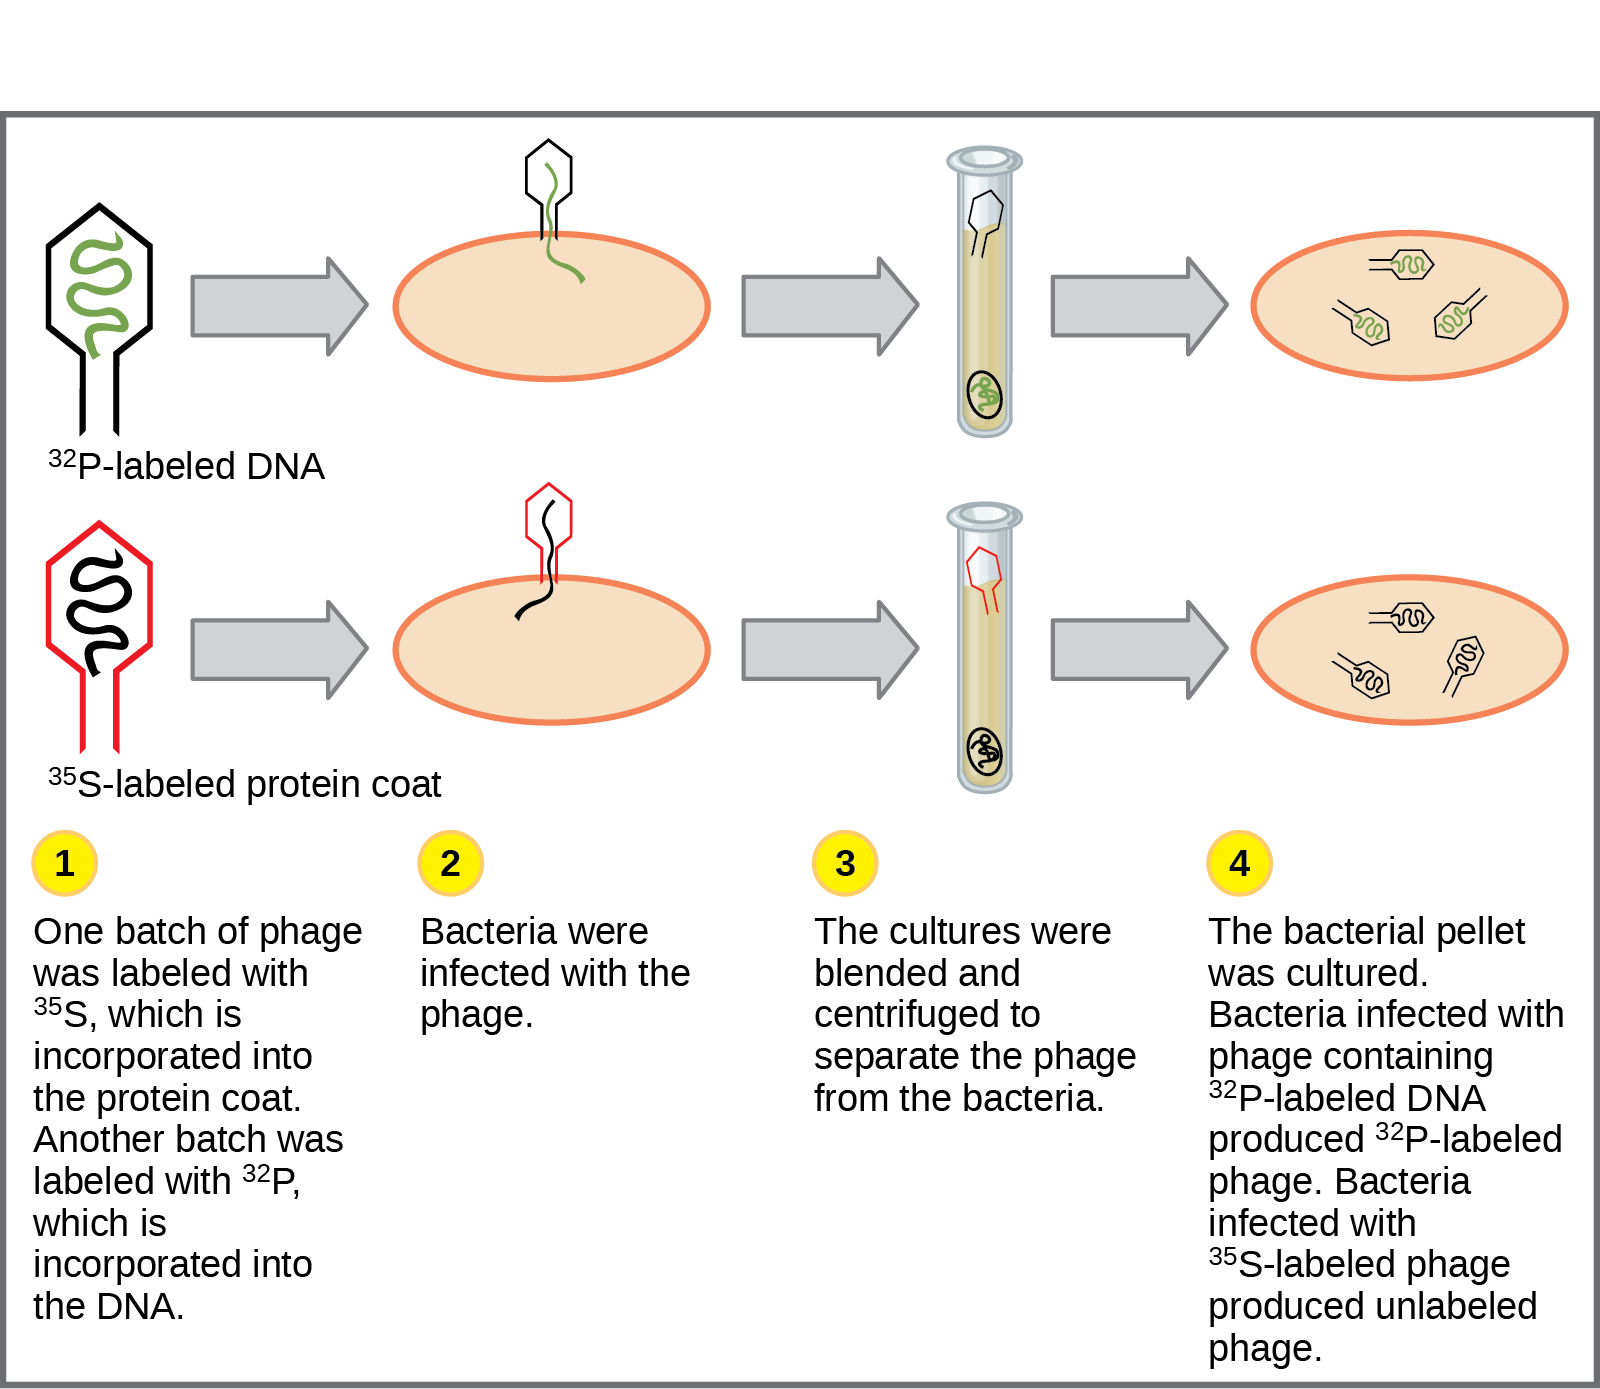
Illustration shows bacteria being infected by phage labeled with superscript 35 baseline upper case S, which is incorporated into the protein coat, or superscript 32 baseline upper case P, which is incorporated into the D N A. Infected bacteria were separated from phage by centrifugation and cultured. The bacteria that had been infected with phage containing superscript 32 baseline upper P labeled D N A made radioactive phage. The bacteria that had been infected with superscript 35 baseline upper S labeled phage produced unlabeled phage. The results support the hypothesis that D N A, and not protein, is the genetic material.
Figure 14.4 — 14.1 Historical Basis of Modern Understanding

Figure 14.4 In Hershey and Chase's experiments, bacteria were infected with phage radiolabeled with either 35 S, which labels protein, or 32 P, which labels DNA. Only 32 P entered the bacterial cells, indicating that DNA is the genetic material.

Mary Ann Clark, Matthew Douglas, and Jung Choi, Biology 2E, OpenStax. · CC BY-NC-SA 4.0 · Original image ↗ · Access for free ↗

Source: 14.1 Historical Basis of Modern Understanding

12.2 Characteristics and Traits — figures and tables
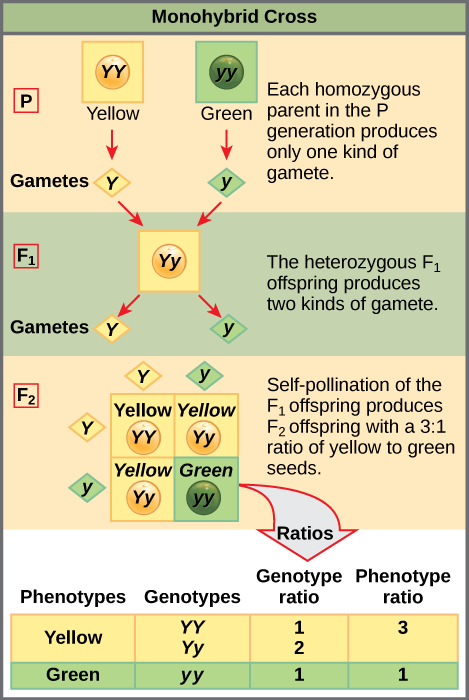
This illustration shows a monohybrid cross. In the upper P generation, one parent has a dominant yellow phenotype and the genotype upper Y upper Y, and the other parent has the recessive green phenotype and the genotype lower y lower y. Each parent produces one kind of gamete, resulting in an upper F subscript 1 baseline generation with a dominant yellow phenotype and the genotype upper Y lower y. Self-pollination of the upper F subscript 1 baseline generation results in an upper F subscript 2 baseline generation with a 3 to 1 ratio of yellow to green peas. One out of three of the yellow pea plants has a dominant genotype of upper Y upper Y, and 2 out of 3 have the heterozygous phenotype upper Y lower y. The homozygous recessive plant has the green phenotype and the genotype lower y lower y.
Figure 12.4 — 12.2 Characteristics and Traits

Figure 12.4 In the P generation, pea plants that are true-breeding for the dominant yellow phenotype are crossed with plants with the recessive green phenotype. This cross produces F 1 heterozygotes with a yellow phenotype. Punnett square analysis can be used to predict the genotypes of the F 2 generation.

Mary Ann Clark, Matthew Douglas, and Jung Choi, Biology 2E, OpenStax. · CC BY-NC-SA 4.0 · Original image ↗ · Access for free ↗
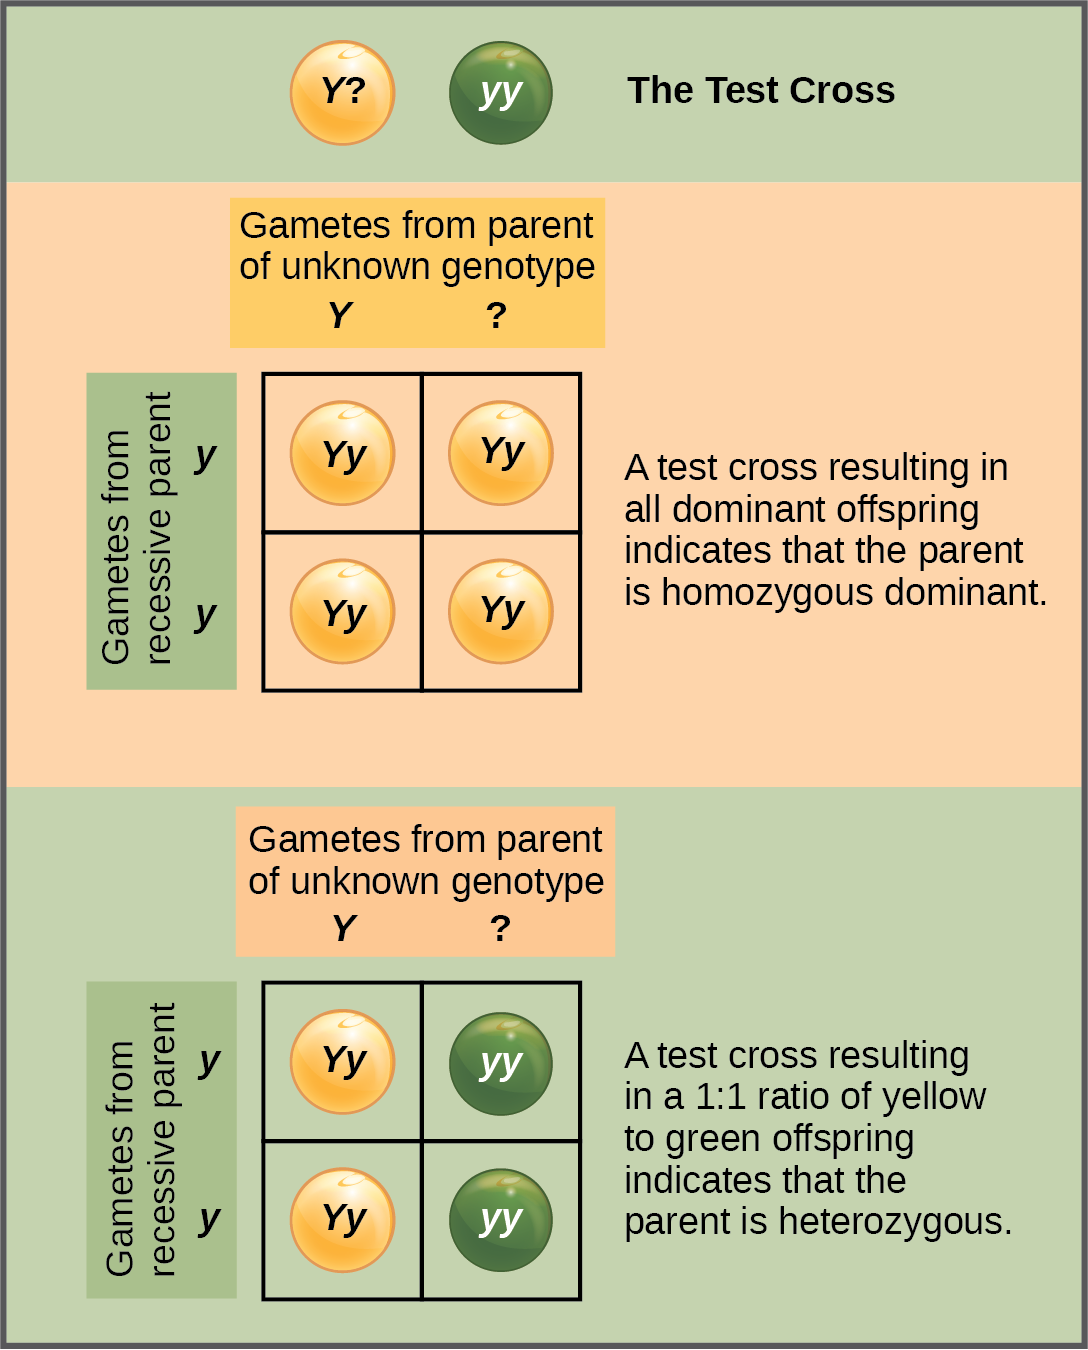
In a test cross, a parent with a dominant phenotype but unknown genotype is crossed with a recessive parent. If the parent with the unknown phenotype is homozygous dominant, all of the resulting offspring will have at least one dominant allele. If the parent with the unknown phenotype is heterozygous, fifty percent of the offspring will inherit a recessive allele from both parents and will have the recessive phenotype.
Figure 12.5 — 12.2 Characteristics and Traits

Figure 12.5 A test cross can be performed to determine whether an organism expressing a dominant trait is a homozygote or a heterozygote.

Mary Ann Clark, Matthew Douglas, and Jung Choi, Biology 2E, OpenStax. · CC BY-NC-SA 4.0 · Original image ↗ · Access for free ↗
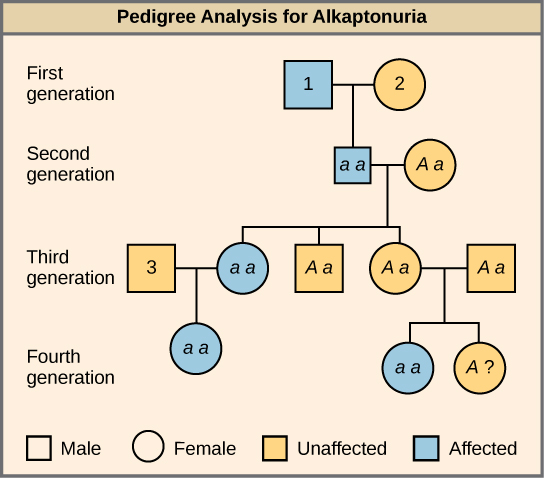
This is a pedigree of a family that carries the recessive disorder alkaptonuria. In the second generation, an unaffected mother and an affected father have three children. One child has the disorder, so the genotype of the mother must be upper case A lower case a, and the genotype of the father is lower case a lower case a. One unaffected child goes on to have two children, one affected and one unaffected. Because her husband was not affected, she and her husband must both be heterozygous. The genotype of their unaffected child is unknown, and is designated upper A question mark. In the third generation, the other unaffected child had no offspring. The affected third-generation child goes on to have one child with the disorder. Her husband is unaffected and is labeled 3. The first generation father is affected and is labeled 1; The first generation mother is unaffected and is labeled 2 The Visual Connection question asks the genotype of the three numbered individuals.
Figure 12.6 — 12.2 Characteristics and Traits

Figure 12.6 Alkaptonuria is a recessive genetic disorder in which two amino acids, phenylalanine and tyrosine, are not properly metabolized. Affected individuals may have darkened skin and brown urine, and may suffer joint damage and other complications. In this pedigree, individuals with the disorder are indicated in blue and have the genotype aa . Unaffected individuals are indicated in yellow and have the genotype AA or Aa . Note that it is often possible to determine a person’s genotype from the genotype of their offspring. For example, if neither parent has the disorder but their child does, they must be heterozygous. Two individuals on the pedigree have an unaffected phenotype but unknown genotype. Because they do not have the disorder, they must have at least one normal allele, so their genotype gets the “ A? ” designation.

Mary Ann Clark, Matthew Douglas, and Jung Choi, Biology 2E, OpenStax. · CC BY-NC-SA 4.0 · Original image ↗ · Access for free ↗
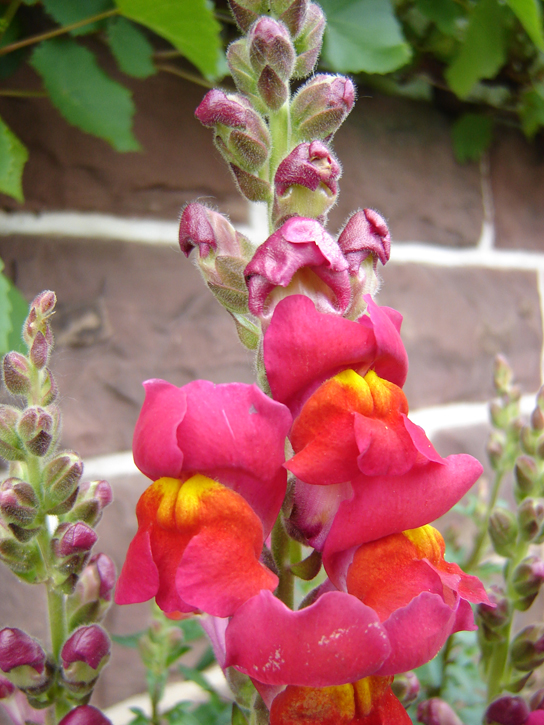
Photo is of a snapdragon with a pink flower.
Figure 12.7 — 12.2 Characteristics and Traits

Figure 12.7 These pink flowers of a heterozygote snapdragon result from incomplete dominance. (credit: “storebukkebruse”/Flickr)

Mary Ann Clark, Matthew Douglas, and Jung Choi, Biology 2E, OpenStax. (credit: “storebukkebruse”/Flickr) · CC BY-NC-SA 4.0 · Original image ↗ · Access for free ↗
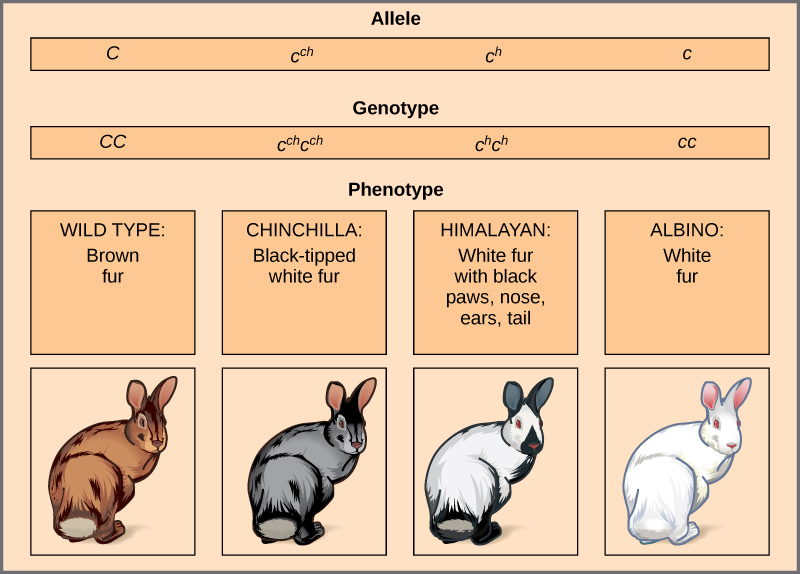
This illustration shows the four different variants for coat color in rabbits at the c allele. The genotype upper case C upper case C produces the wild type phenotype, which is brown. The genotype lower case c superscript c h baseline lower case c superscript c h baseline produces the chinchilla phenotype, which is black-tipped white fur. The genotype lower case c superscript h baseline, lower case c superscript h baseline, produces the Himalayan phenotype, which is white on the body and black on the extremities. The genotype lower case c lower case c produces the recessive phenotype, which is white.
Figure 12.8 — 12.2 Characteristics and Traits

Figure 12.8 Four different alleles exist for the rabbit coat color ( C ) gene.

Mary Ann Clark, Matthew Douglas, and Jung Choi, Biology 2E, OpenStax. · CC BY-NC-SA 4.0 · Original image ↗ · Access for free ↗
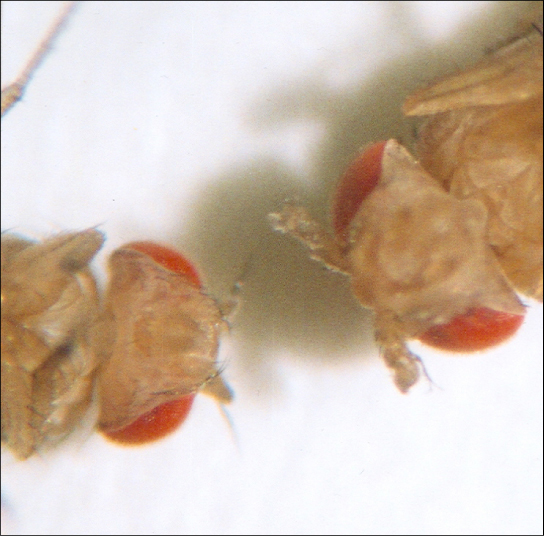
This photo shows Drosophila that has normal antennae on its head, and a mutant that has legs on its head.
Figure 12.9 — 12.2 Characteristics and Traits

Figure 12.9 As seen in comparing the wild-type Drosophila (left) and the Antennapedia mutant (right), the Antennapedia mutant has legs on its head in place of antennae.

Mary Ann Clark, Matthew Douglas, and Jung Choi, Biology 2E, OpenStax. · CC BY-NC-SA 4.0 · Original image ↗ · Access for free ↗
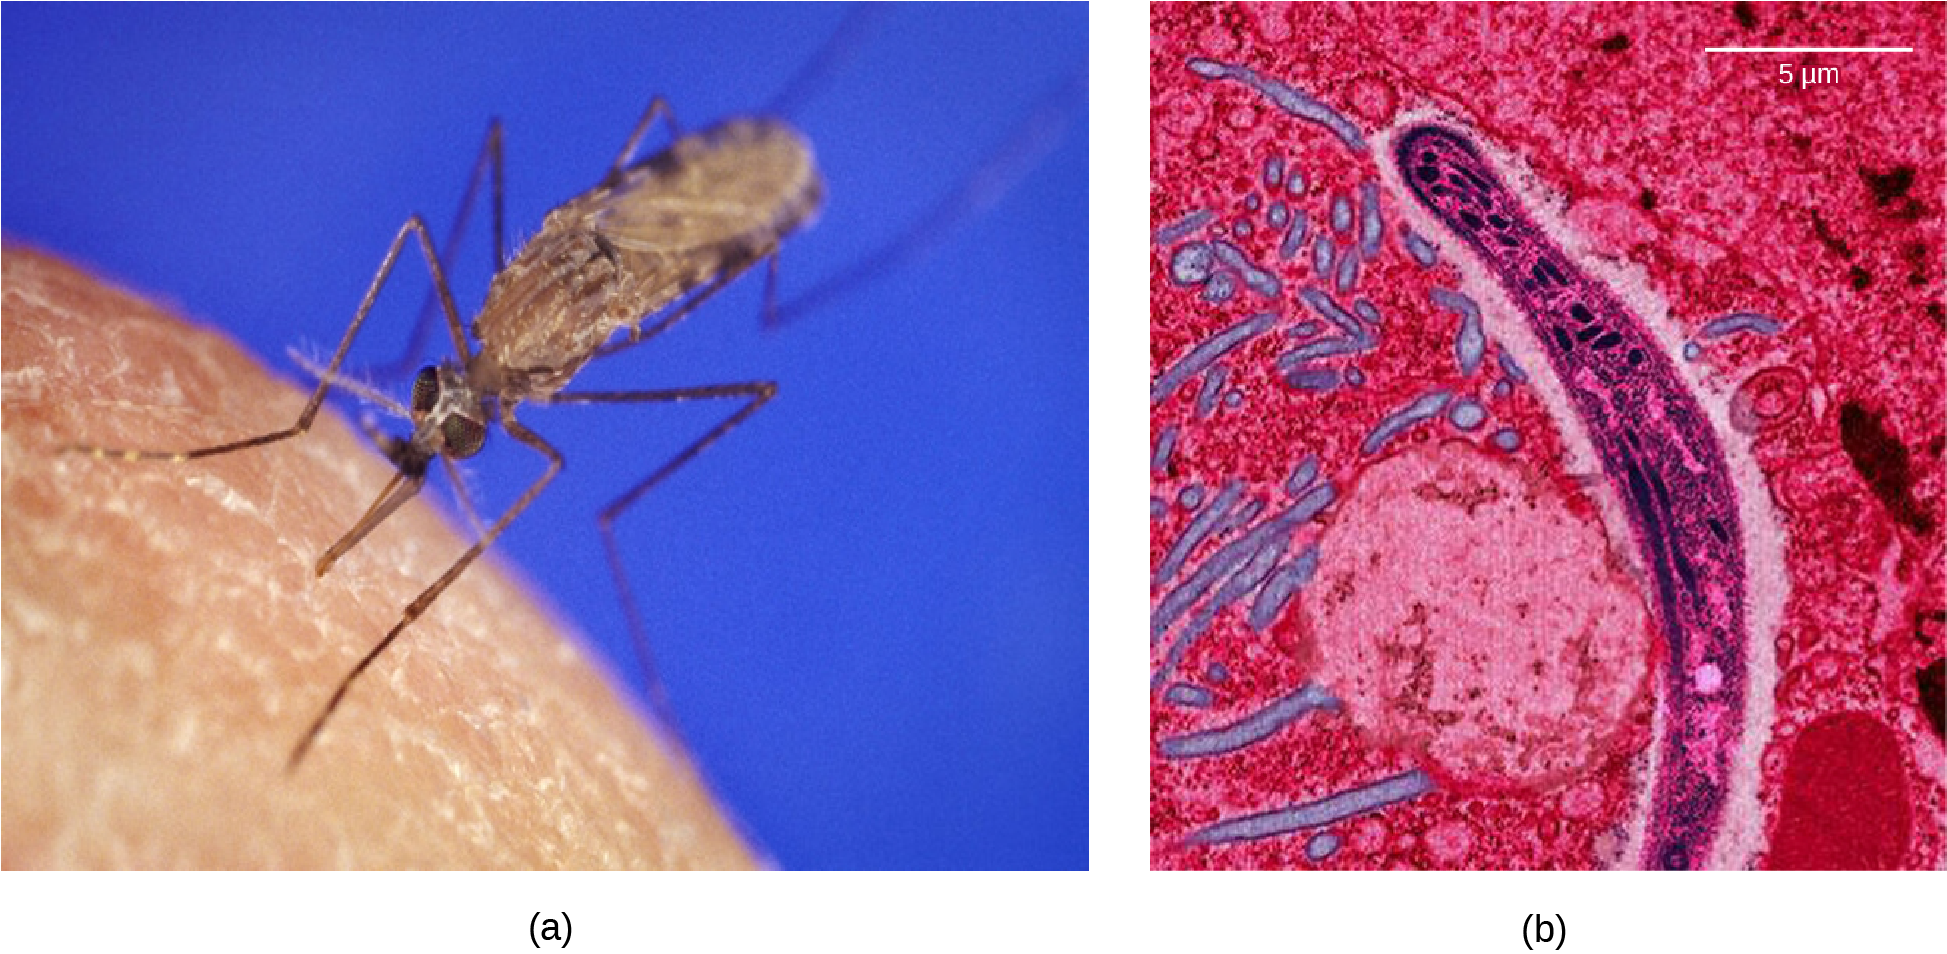
Photo A shows the Anopheles gambiae mosquito, which carries malaria. Photo b shows a micrograph of sickle-shaped Plasmodium falciparum, the parasite that causes malaria. The Plasmodium is about 0.75 microns across.
Figure 12.10 — 12.2 Characteristics and Traits

Figure 12.10 The (a) Anopheles gambiae , or African malaria mosquito, acts as a vector in the transmission to humans of the malaria-causing parasite (b) Plasmodium falciparum , here visualized using false-color transmission electron microscopy. (credit a: James D. Gathany; credit b: Ute Frevert; false color by Margaret Shear; scale-bar data from Matt Russell)

Mary Ann Clark, Matthew Douglas, and Jung Choi, Biology 2E, OpenStax. (credit a: James D. Gathany; credit b: Ute Frevert; false color by Margaret Shear; scale-bar data from Matt Russell) · CC BY-NC-SA 4.0 · Original image ↗ · Access for free ↗
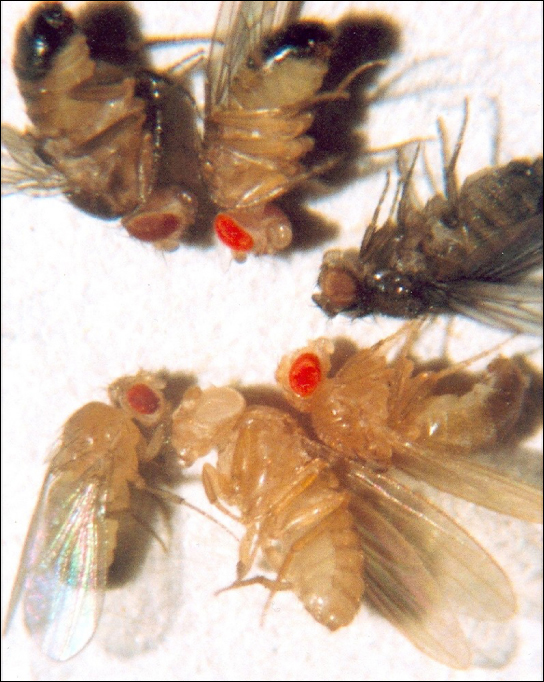
Photo shows six fruit flies, each with a different eye color.
Figure 12.11 — 12.2 Characteristics and Traits

Figure 12.11 In Drosophila , several genes determine eye color. The genes for white and vermilion eye colors are located on the X chromosome. Others are located on the autosomes. Clockwise from top left are brown, cinnabar, sepia, vermilion, white, and red. Red eye color is wild-type and is dominant to white eye color.

Mary Ann Clark, Matthew Douglas, and Jung Choi, Biology 2E, OpenStax. · CC BY-NC-SA 4.0 · Original image ↗ · Access for free ↗
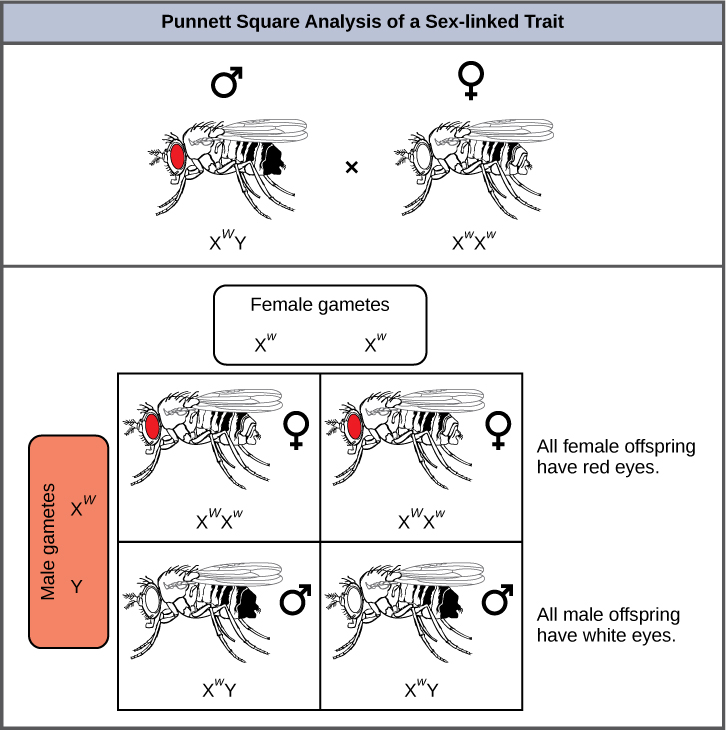
This illustration shows a Punnett square analysis of fruit fly eye color, which is a sex-linked trait. A red-eyed male fruit fly with the genotype X superscript upper case W baseline, Y, is crossed with a white-eyed female fruit fly with the genotype X superscript lower case w baseline, X superscript lower case w baseline. All of the female offspring acquire a dominant upper case W allele from the father and a recessive lower case w allele from the mother, and are therefore heterozygous dominant with red eye color. All of the male offspring acquire a recessive lower case w allele from the mother and a Y chromosome from the father and are therefore hemizygous recessive with white eye color.
Figure 12.12 — 12.2 Characteristics and Traits

Figure 12.12 Punnett square analysis is used to determine the ratio of offspring from a cross between a red-eyed male fruit fly and a white-eyed female fruit fly.

Mary Ann Clark, Matthew Douglas, and Jung Choi, Biology 2E, OpenStax. · CC BY-NC-SA 4.0 · Original image ↗ · Access for free ↗
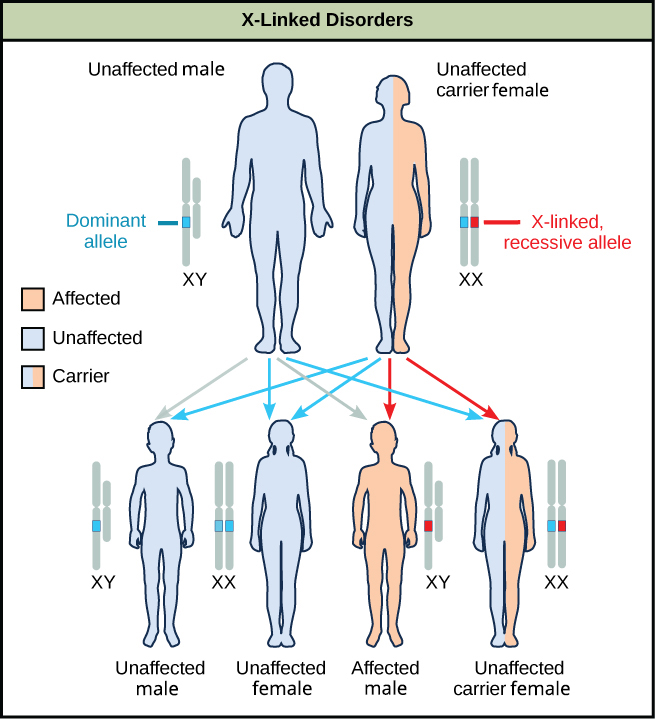
A diagram shows an unaffected male with a dominant allele and an unaffected carrier female with an x-linked recessive allele. Four figures of offspring are shown representing the various resulting genetic combinations: unaffected male offspring, unaffected female offspring, affected male offspring, and unaffected carrier female offspring.
Figure 12.13 — 12.2 Characteristics and Traits

Figure 12.13 The male offspring of a person who is a carrier of a recessive X-linked disorder will have a 50 percent chance of being affected. A female will not be affected, but she will have a 50 percent chance of being a carrier like the female parent.

Mary Ann Clark, Matthew Douglas, and Jung Choi, Biology 2E, OpenStax. · CC BY-NC-SA 4.0 · Original image ↗ · Access for free ↗
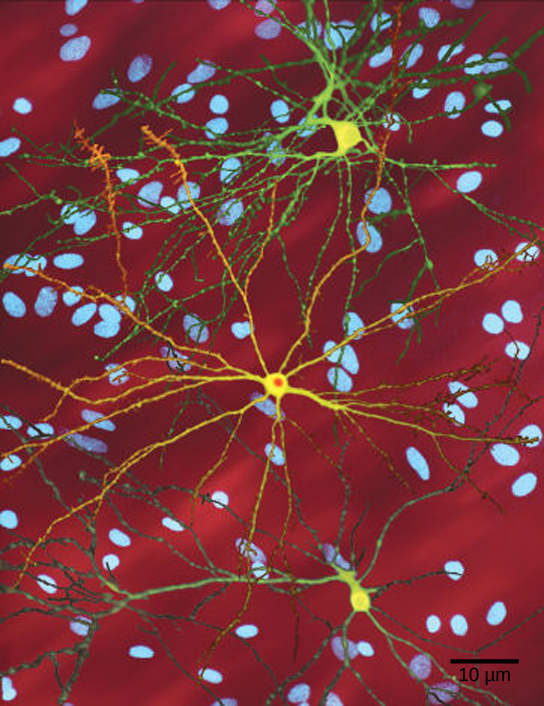
Micrograph shows a neuron with nuclear inclusions characteristic of Huntington's disease.
Figure 12.14 — 12.2 Characteristics and Traits

Figure 12.14 The neuron in the center of this micrograph (yellow) has nuclear inclusions characteristic of Huntington’s disease (orange area in the center of the neuron). Huntington’s disease occurs when an abnormal dominant allele for the Huntington gene is present. (credit: Dr. Steven Finkbeiner, Gladstone Institute of Neurological Disease, The Taube-Koret Center for Huntington's Disease Research, and the University of California San Francisco/Wikimedia)

Mary Ann Clark, Matthew Douglas, and Jung Choi, Biology 2E, OpenStax. (credit: Dr. Steven Finkbeiner, Gladstone Institute of Neurological Disease, The Taube-Koret Center for Huntington's Disease Research, and the University of California San Francisco/Wikimedia) · CC BY-NC-SA 4.0 · Original image ↗ · Access for free ↗
Traits Traits
Achondroplasia Albinism
Brachydactyly Cystic
Huntington’s disease Duchenne muscular dystrophy
Marfan syndrome Galactosemia
Neurofibromatosis Phenylketonuria
Widow’s
Wooly hair Tay-Sachs disease

Table 12.4. Mary Ann Clark, Matthew Douglas, and Jung Choi, Biology 2E, OpenStax.

Source: 12.2 Characteristics and Traits

12.3 Laws of Inheritance — figures and tables
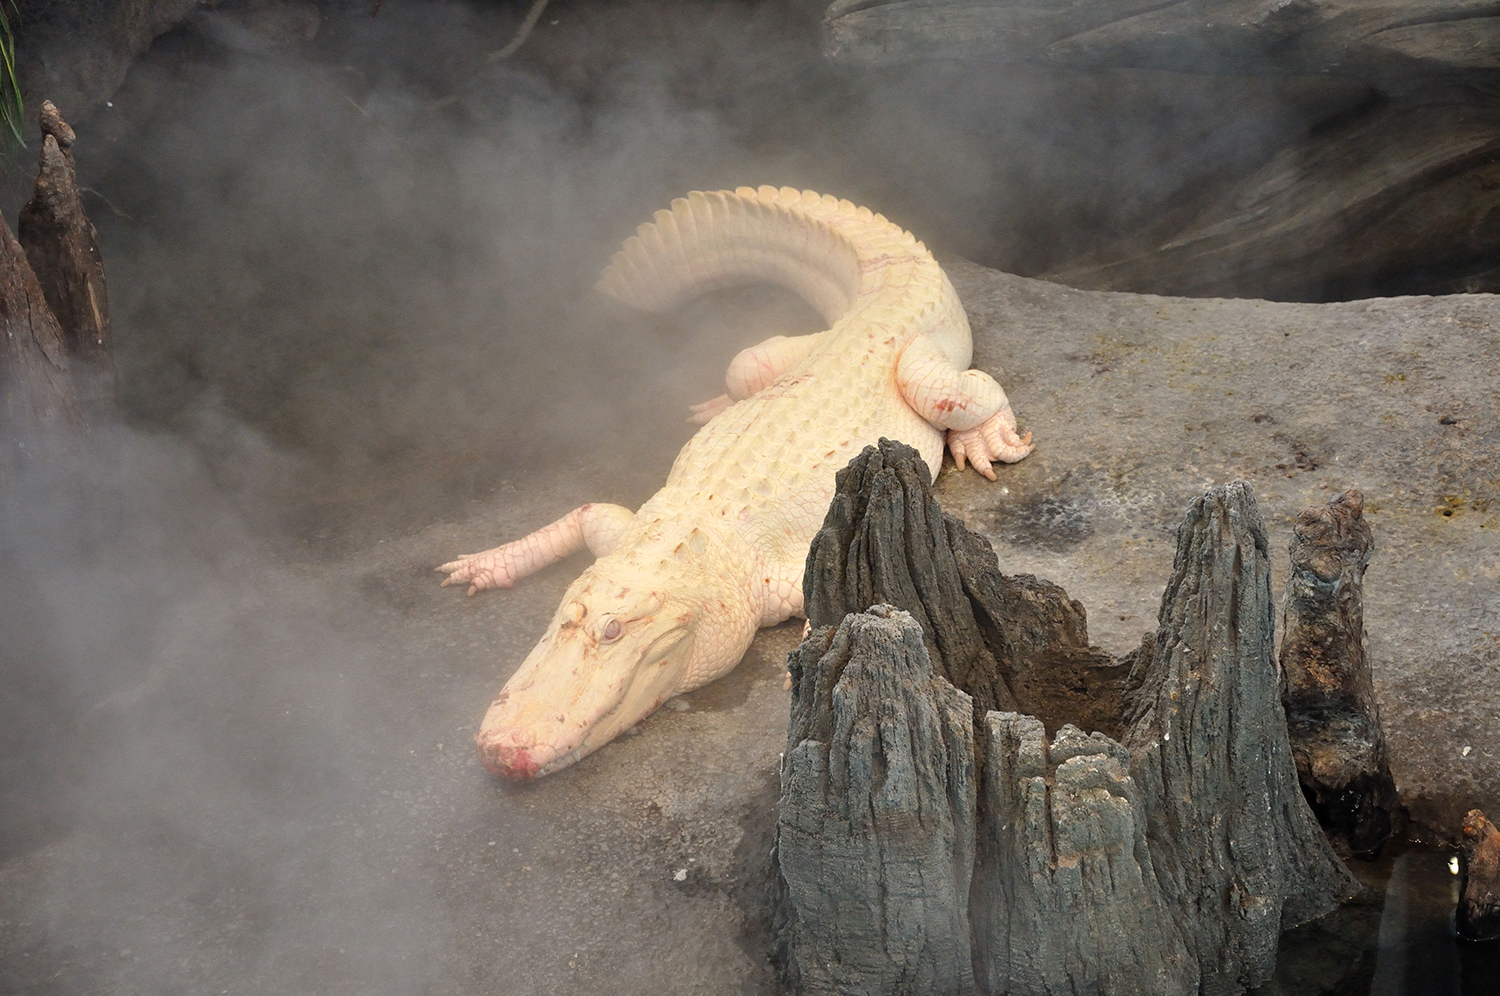
Photo shows an albino alligator in the Swamp at the California Academy of Sciences.
Figure 12.15 — 12.3 Laws of Inheritance

Figure 12.15 The alligator in the photo expresses albinism, a recessive trait.

Mary Ann Clark, Matthew Douglas, and Jung Choi, Biology 2E, OpenStax. · CC BY-NC-SA 4.0 · Original image ↗ · Access for free ↗
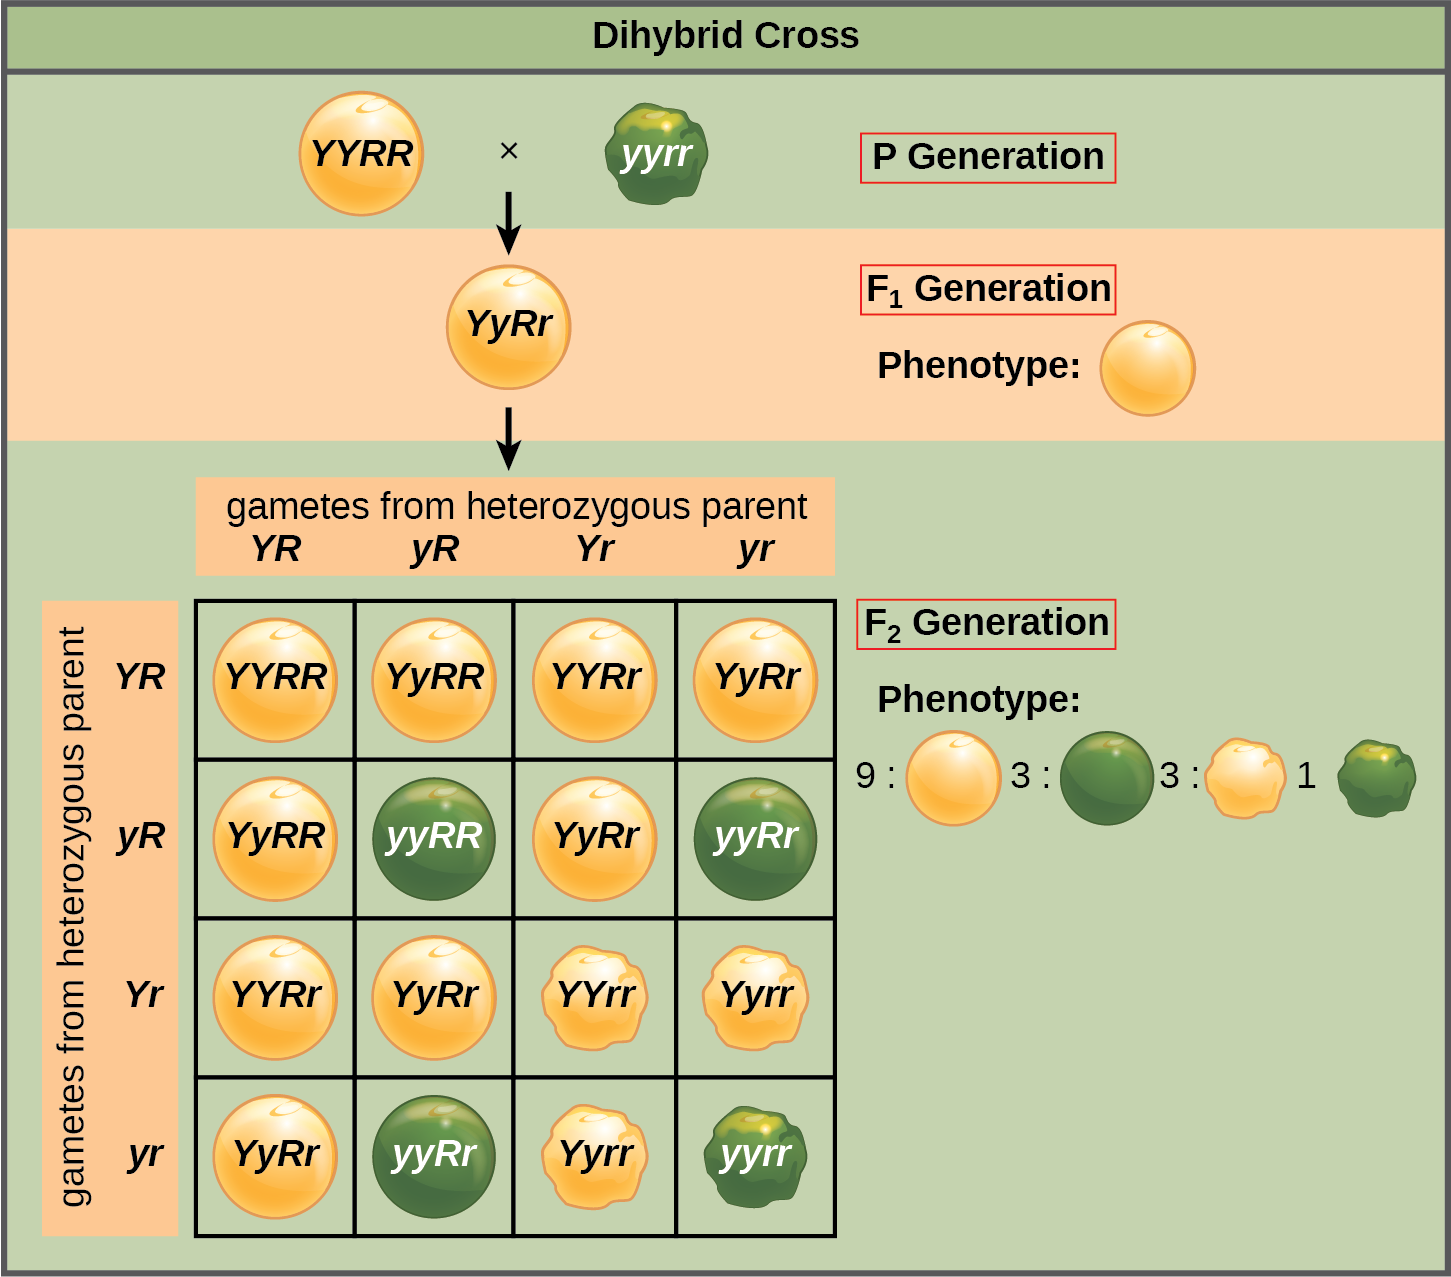
This illustration shows a dihybrid cross between pea plants. In the upper case P generation, a plant that has the homozygous dominant phenotype of round, yellow peas is crossed with a plant with the homozygous recessive phenotype of wrinkled, green peas. The resulting F subscript 1 baseline offspring have a heterozygous genotype and round, yellow peas. Self-pollination of the F subscript 1 baseline generation results in F subscript 2 baseline offspring with a phenotypic ratio of 9 colon 3 colon 3 colon 1 for yellow round, green round, yellow wrinkled and green wrinkled peas, respectively.
Figure 12.16 — 12.3 Laws of Inheritance

Figure 12.16 This dihybrid cross of pea plants involves the genes for seed color and texture.

Mary Ann Clark, Matthew Douglas, and Jung Choi, Biology 2E, OpenStax. · CC BY-NC-SA 4.0 · Original image ↗ · Access for free ↗
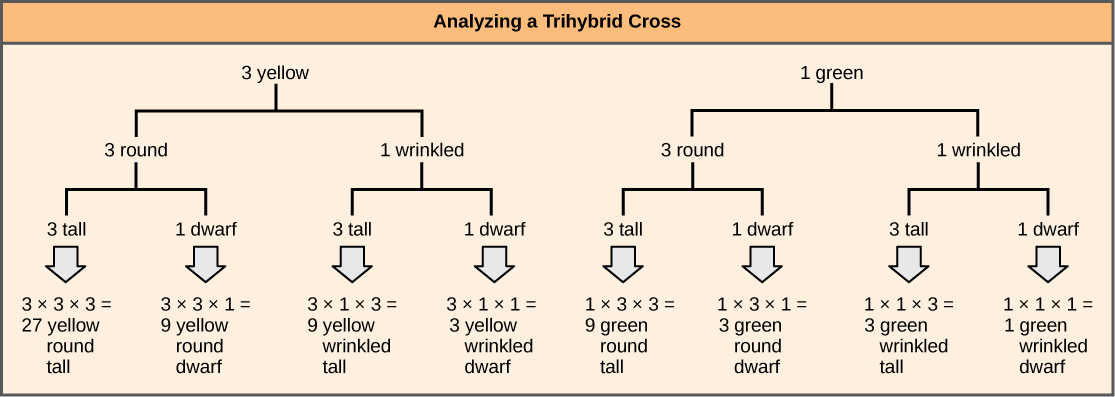
A forked-line diagram is shown for the F subscript 2 baseline generation of a trihybrid cross of pea plants with the dominant yellow, round, and tall phenotype with pea plants of the recessive green, wrinkled, dwarf phenotype. The top row shows that the color ratio is 3 yellow to 1 green in the F subscript 2 baseline generation. The second row shows that the probability that plants of either pea color having the round or wrinkled texture is 3 to 1. The third row shows that the probability of plants with either of the above textures having a round or wrinkled phenotype is 3 to 1. The probability of all three phenotypes occurring together is determined by multiplying each individual probability together. The probability ratio is 27 yellow slash round slash tall colon; 9 yellow slash round slash dwarf, colon, 9 yellow slash wrinked slash tall, colon, 3 yellow slash wrinkled slash dwarf, colon,  9 green slash round slash tall, colon, 3 green slash round slash dwarf, colon 3 green slash wrinkled slash tall, colon, 1 green slash wrinkled slash dwarf.
Figure 12.17 — 12.3 Laws of Inheritance

Figure 12.17 The forked-line method can be used to analyze a trihybrid cross. Here, the probability for color in the F 2 generation occupies the top row (3 yellow:1 green). The probability for shape occupies the second row (3 round: 1 wrinkled), and the probability for height occupies the third row (3 tall:1 dwarf). The probability for each possible combination of traits is calculated by multiplying the probability for each individual trait. Thus, the probability of F 2 offspring having yellow, round, and tall traits is 3 × 3 × 3, or 27.

Mary Ann Clark, Matthew Douglas, and Jung Choi, Biology 2E, OpenStax. · CC BY-NC-SA 4.0 · Original image ↗ · Access for free ↗
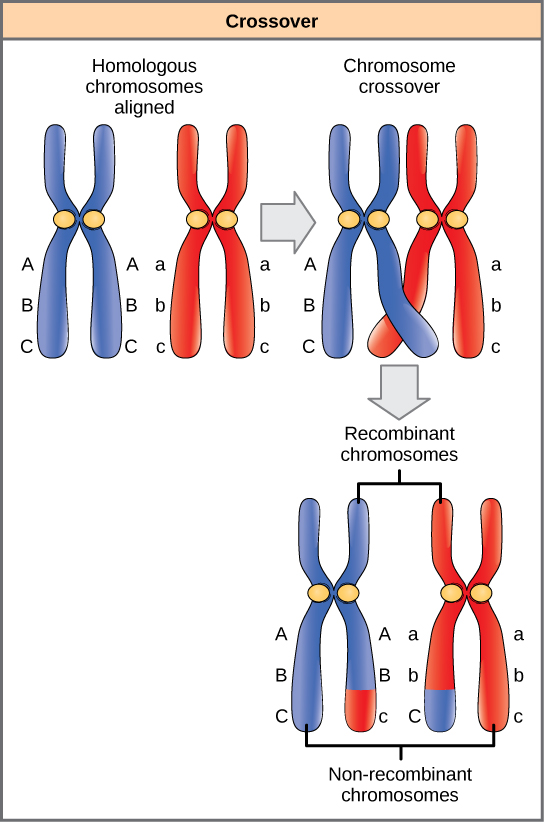
This illustration shows a pair of homologous chromosomes. One of the pair has the alleles upper case A upper case B upper case C, and the other has the alleles lower case a lower case b lower case c. During meiosis, crossover occurs between two of the chromosomes and genetic material is exchanged, resulting in one recombinant chromosome that has the alleles upper A upper B lower c and another that has the alleles lower a lower b upper C. The other two chromosomes are non-recombinant and have the same arrangement of genes as before meiosis.
Figure 12.18 — 12.3 Laws of Inheritance

Figure 12.18 The process of crossover, or recombination, occurs when two homologous chromosomes align during meiosis and exchange a segment of genetic material. Here, the alleles for gene C were exchanged. The result is two recombinant and two non-recombinant chromosomes (for clarity, only one recombination event between two of the four chromatids is represented).

Mary Ann Clark, Matthew Douglas, and Jung Choi, Biology 2E, OpenStax. · CC BY-NC-SA 4.0 · Original image ↗ · Access for free ↗
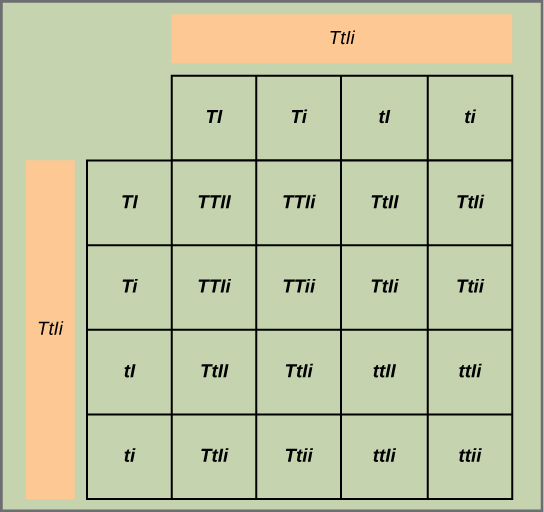
This figure shows all possible combinations of offspring resulting from a dihybrid cross of pea plants that are heterozygous for the tall slash dwarf and inflated slash constricted alleles.
Figure 12.19 — 12.3 Laws of Inheritance

Figure 12.19 This figure shows all possible combinations of offspring resulting from a dihybrid cross of pea plants that are heterozygous for the tall/dwarf and inflated/constricted alleles.

Mary Ann Clark, Matthew Douglas, and Jung Choi, Biology 2E, OpenStax. · CC BY-NC-SA 4.0 · Original image ↗ · Access for free ↗
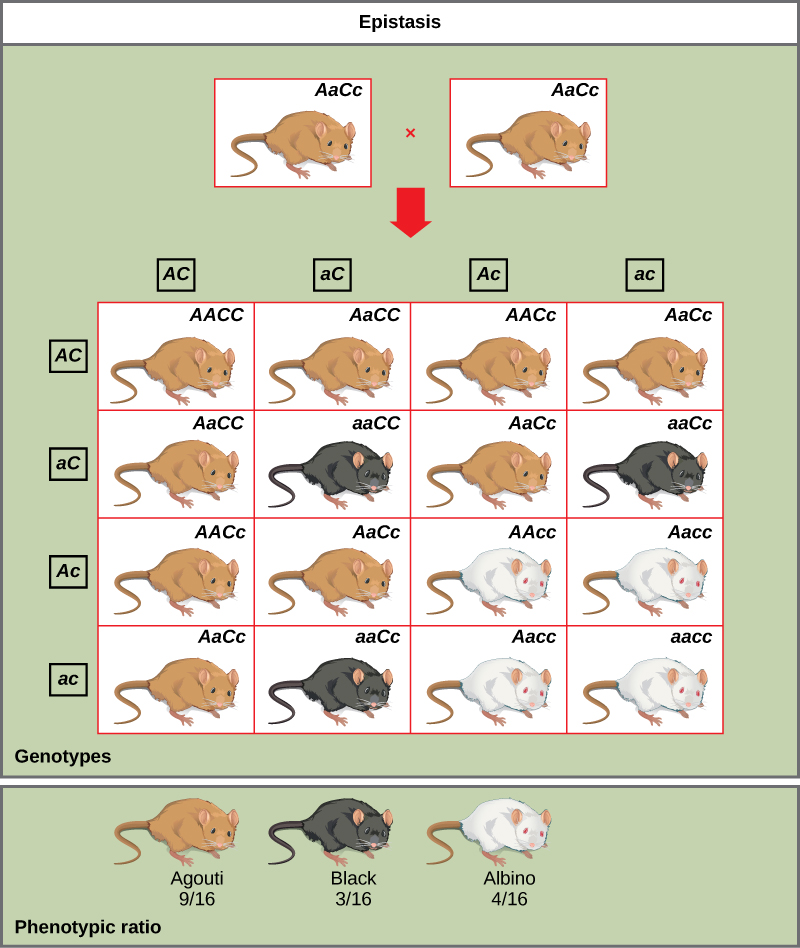
A cross between two agouti mice with the heterozygous genotype upper A lower a upper C lower c is shown. Each mouse produces four different kinds of gametes, which are upper A upper C, and lower a upper C, and upper A lower c, and lower a lower c. A 4 by 4 Punnett square is used to determine the genotypic ratio of the offspring. The phenotypic ratio is 9 slash 16 agouti, 3 slash 16 black, and 4 slash 16 white.
Figure 12.20 — 12.3 Laws of Inheritance

Figure 12.20 In mice, the mottled agouti coat color ( A ) is dominant to a solid coloration, such as black or gray. A gene at a separate locus ( C ) is responsible for pigment production. The recessive c allele does not produce pigment, and a mouse with the homozygous recessive cc genotype is albino regardless of the allele present at the A locus. Thus, the C gene is epistatic to the A gene.

Mary Ann Clark, Matthew Douglas, and Jung Choi, Biology 2E, OpenStax. · CC BY-NC-SA 4.0 · Original image ↗ · Access for free ↗
General Rule Number of Pairs
Number of different F1 2n
Number of different F2 3n
Given and inheritance, the number of different F2 2n

Table 12.5. Mary Ann Clark, Matthew Douglas, and Jung Choi, Biology 2E, OpenStax.

Source: 12.3 Laws of Inheritance

202 terms, alphabetically ordered

acceleration

Rate of change of , measured in m/s².

Read explanation · OpenStax ↗
Acid · ·

In the Brønsted–Lowry model, a substance that can donate a . Acidic have a higher activity than water.

Read explanation · OpenStax ↗
Activation energy ·

The energy barrier that must overcome to reach a and undergo .

Read explanation · OpenStax ↗
Adenine

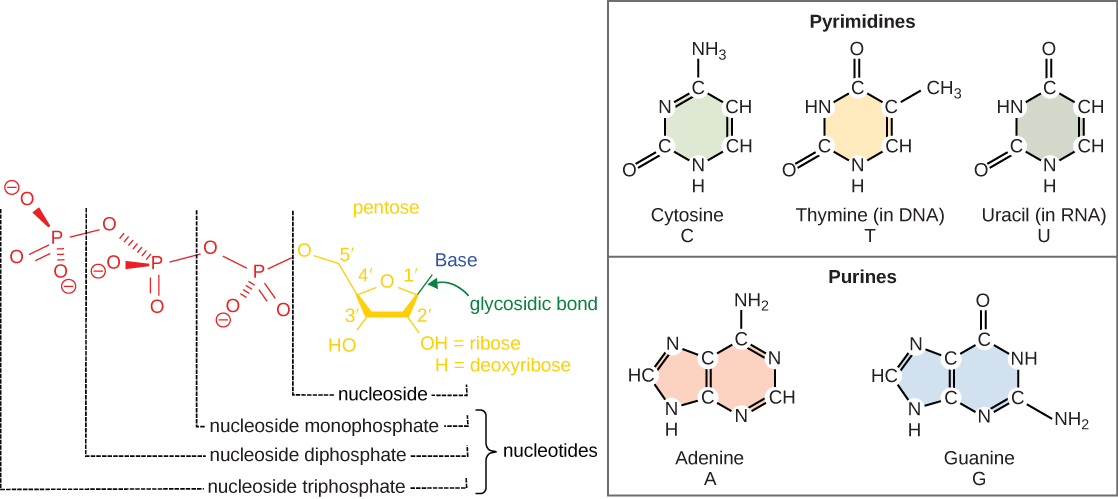
A that pairs with in and in .

Read explanation · OpenStax ↗
Adenosine triphosphate

An energy-carrying ; its powers many cellular processes, including cycles.

Read explanation · OpenStax ↗
Allele

One version or copy of a at a ; a typical cell carries two copies of an autosomal .

Read explanation · NCBI Bookshelf / Sinauer Associates ↗
Alpha carbon · ·

The central carbon next to the carboxyl carbon. In a standard it binds an , hydrogen, and .

Read explanation · OpenStax ↗
Alpha helix · · · · · ·

A helical stabilized by between a oxygen and an hydrogen four later.

Read explanation · OpenStax ↗
Amide · · ·

A group containing a carbon bonded to nitrogen. are amide linkages.

Read explanation · OpenStax ↗
Amino acid

A building block containing amino and and a characteristic .

Read explanation · OpenStax ↗
Amino acid residue · ·

The part of an incorporated into a chain. Residue can also describe another building block within a larger .

Read explanation · OpenStax ↗
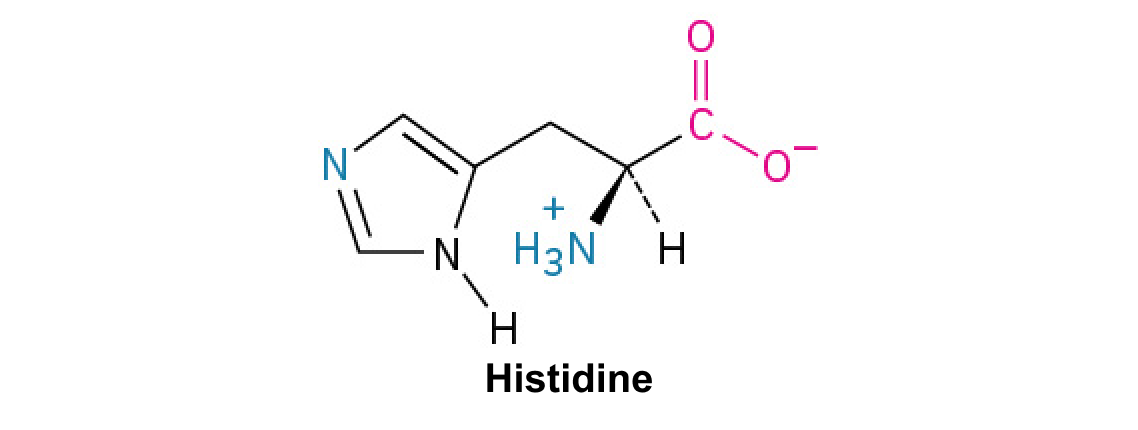
Amino group · · ·

A nitrogen-containing . A free ’s amino group is typically (NH₃⁺) near physiological ; ’s ring nitrogen is an exception to this formula.

Read explanation · OpenStax ↗
Amphipathic

Having both a region and a region, as in a or .

Read explanation · OpenStax ↗
anemia

Reduced blood oxygen-carrying capacity associated with low or red-cell mass for the relevant reference context.

Read explanation · OpenStax ↗
Antibody

An that recognizes a specific region () on an . Antibodies help immune defenses and are used as detection tools in .

Read explanation · OpenStax ↗
Antigen

A or molecular structure specifically recognized by an or other adaptive immune .

Read explanation · OpenStax ↗
Antiparallel

Running in opposite directions, as with two strands or neighboring strands in some .

Read explanation · OpenStax ↗
Aqueous solution ·

A in which water is the .

Read explanation · OpenStax ↗
Archaea ·

A of distinct from , with characteristic chemistry and -expression machinery.

Read explanation · OpenStax ↗
Aromatic

Containing a cyclic, with . , , and have aromatic .

Read explanation · OpenStax ↗
Assay

A procedure used to detect a substance or measure its amount, activity, or another property.

Read explanation · Thermo Fisher ↗
Atom

The smallest unit of an element that retains its chemical identity; it has a surrounded by .

Read explanation · OpenStax ↗
Bacteria ·

A of single-celled . Bacterial cells lack a -bound and are distinct from .

Read explanation · OpenStax ↗
Bacterial transformation

Uptake of extracellular by a cell; in genetics this differs from malignant transformation.

Read explanation · OpenStax ↗
bacteriophage · ·

A virus that infects .

Read explanation · OpenStax ↗
Benzene ring

A six-carbon ring with .

Read explanation · OpenStax ↗
Benzyl group

A attached through a –CH₂– group; part of ’s .

Read explanation · OpenStax ↗
Beta sheet · · · · · ·

A made of aligned segments connected by ; strands may be parallel or .

Read explanation · OpenStax ↗
Biomolecule

A made by or involved in living systems, including , , , and .

Read explanation · OpenStax ↗
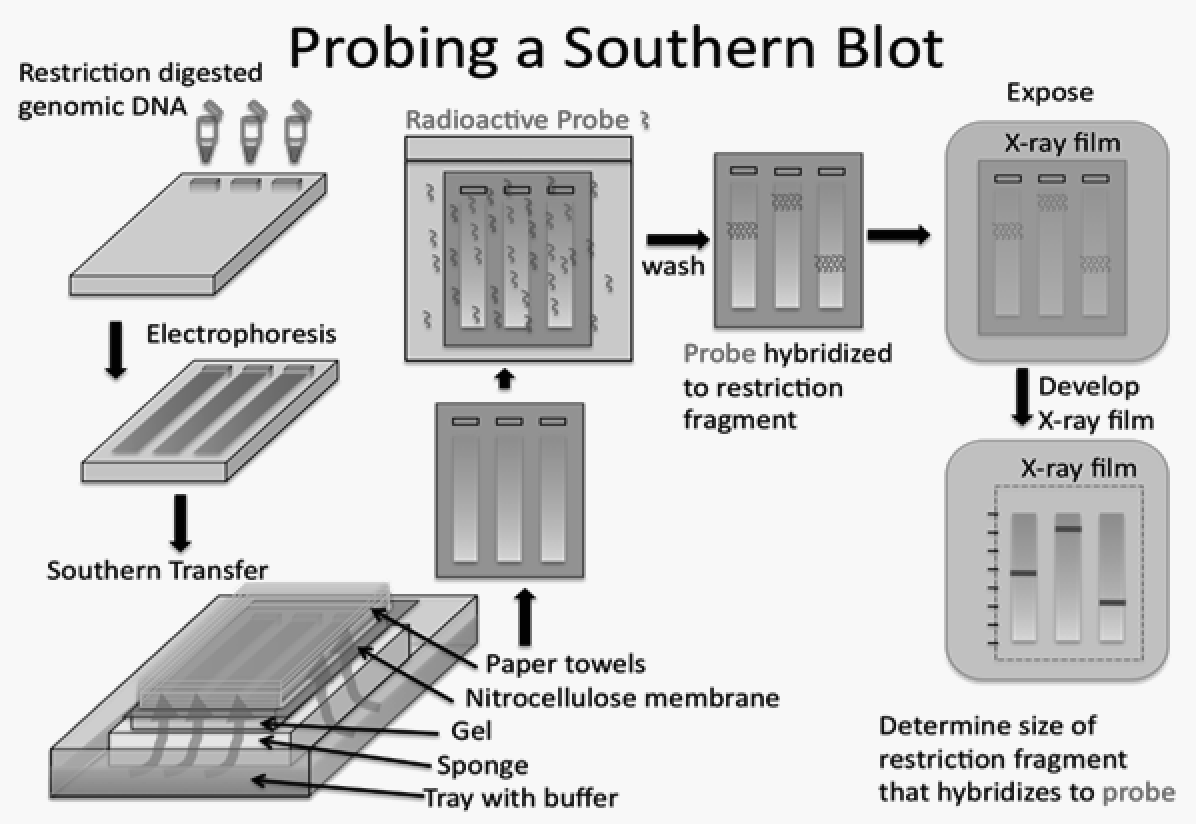
Blotting ·

Transfer of separated or to a so a specific target can be detected.

Read explanation · Thermo Fisher ↗
Brønsted–Lowry base · · · · · · · · · · ·

In the Brønsted–Lowry model, a substance that can accept a . Basic solutions have lower activity than water.

Read explanation · OpenStax ↗
capsid

The shell enclosing a viral .

Read explanation · OpenStax ↗
Carbohydrate

A class of including sugars and their , used for energy storage, structure, and recognition.

Read explanation · OpenStax ↗
Carbonyl group · ·

A carbon double-bonded to oxygen, C=O; present in and many other .

Read explanation · OpenStax ↗
Carboxyl group · ·

An , COOH. In free it is usually to COO⁻ near physiological .

Read explanation · OpenStax ↗
Catalyst · ·

A substance that speeds a by providing a pathway with lower and is regenerated rather than consumed overall.

Read explanation · OpenStax ↗
Centrifugation ·

Spinning a sample to accelerate separation of particles according to their behavior.

Read explanation · Beckman Coulter ↗
Chargaff’s rules

In double-stranded , the total amounts of and are equal, as are and . A single strand need not have those equalities.

Read explanation · OpenStax ↗
Chemical compound ·

A substance containing of two or more different chemically combined in a definite composition.

Read explanation · OpenStax ↗
Chemical element

A substance defined by having the same number of , such as carbon or oxygen.

Read explanation · OpenStax ↗
Chemical reaction ·

A process that rearranges and chemical bonds, converting into .

Read explanation · OpenStax ↗
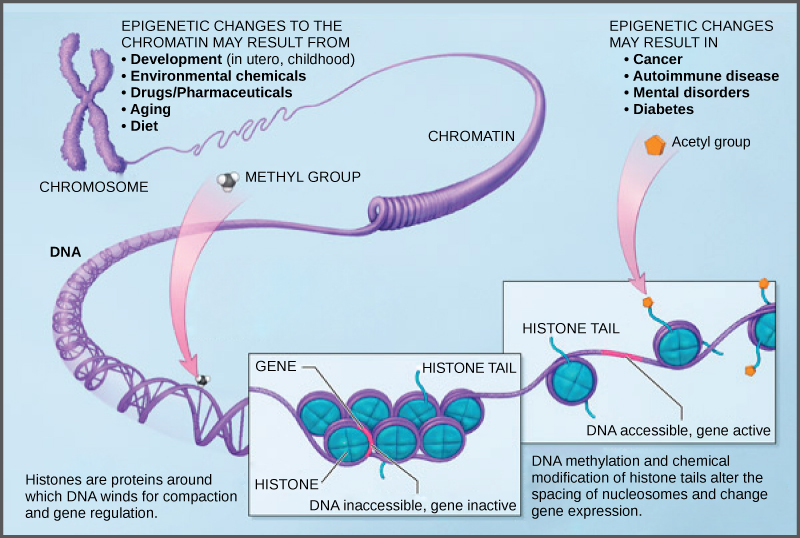
Chromatin

The complex of and associated , including , in .

Read explanation · OpenStax ↗
Chromatographic peak · ·

A rise and fall in detector signal as one or more components pass through the detector; a peak does not guarantee a single pure .

Read explanation · Agilent ↗
Chromatography

Separation of mixture components by their different interactions with a and a moving .

Read explanation · Waters ↗
Chromosome ·

An organized with associated that carries . A replicated chromosome has two .

Read explanation · OpenStax ↗
codominance

An inheritance relationship in which both are detectably expressed in a .

Read explanation · OpenStax ↗
Codon

A sequence of three that specifies an or a stop signal.

Read explanation · OpenStax ↗
competence

A cell’s capacity to take up extracellular in .

Read explanation · OpenStax ↗
complete dominance

An inheritance relationship in which the specified matches one .

Read explanation · OpenStax ↗
Concentration

The amount of a substance in a specified volume or mass of mixture.

Read explanation · OpenStax ↗
Conjugated system ·

Adjacent orbitals that allow to be distributed across several , often through alternating single and multiple bonds.

Read explanation · OpenStax ↗
Copy number ·

The number of copies of a segment in a defined sample or ; it is distinct from or abundance.

Read explanation · NHGRI / NIH ↗
Covalent bond · ·

A bond in which share pairs. and are covalent.

Read explanation · OpenStax ↗
Cysteine ·

An with a . Two cysteines can form a .

Read explanation · OpenStax ↗
Cytosine

A in and that pairs with . can convert it to .

Read explanation · OpenStax ↗
Deamination

Removal of an . Deamination of produces and can change genetic information if unrepaired.

Read explanation · Biology LibreTexts / Oregon State University ↗
Deoxyribonucleic acid

The that stores genetic information used to specify and sequences.

Read explanation · OpenStax ↗
Deprotonation

Removal of a from a or group; this changes its by minus one.

Read explanation · OpenStax ↗
Detergent

An substance that can associate with both water and material; detergents can disrupt or interactions.

Read explanation · Thermo Fisher ↗
Diploid

Having two sets; comparisons of must account for and sample composition.

Read explanation · NHGRI / NIH ↗
Dissociation · ·

Separation of a chemical species or molecular complex into smaller components; dissociation releases a .

Read explanation · OpenStax ↗
Disulfide bond · · ·

A covalent sulfur–sulfur bond formed by of two , which can stabilize structure.

Read explanation · NCBI Bookshelf ↗
DNA replication

Copying so genetic information can be passed to daughter cells. Each guides a complementary new strand.

Read explanation · OpenStax ↗
dominant

Describing an whose specified is expressed in a ; dominance does not imply greater frequency or .

Read explanation · OpenStax ↗
Double helix · · ·

Two strands wound around a common axis. normally has complementary, strands.

Read explanation · OpenStax ↗
Electric charge · · ·

An electrical property that can be positive or negative. Opposite charges attract and like charges repel; net charge is the sum of all charges on a particle.

Read explanation · OpenStax ↗
Electron

A negatively subatomic particle. Electron sharing and transfer determine much of chemical bonding.

Read explanation · OpenStax ↗
Electron delocalization ·

Distribution of across several rather than confinement to one or bond.

Read explanation · OpenStax ↗
Electronegativity ·

An ’s tendency to attract shared in a chemical bond. Unequal attraction can make a bond .

Read explanation · OpenStax ↗
Enzyme

A biological that speeds a without being consumed. Most enzymes are .

Read explanation · OpenStax ↗
Epitope

The particular part of an recognized by an or immune .

Read explanation · OpenStax ↗
Eukaryote ·

An organism whose cells have a -enclosed ; animals, plants, fungi, and protists are eukaryotes.

Read explanation · OpenStax ↗
Experimental control ·

A comparison sample or condition used to distinguish the effect being tested from other influences.

Read explanation · Thermo Fisher ↗
expressivity

The degree or pattern of a among individuals expressing it.

Read explanation · www.ncbi.nlm.nih.gov ↗
F1

The first filial generation, produced by crossing the parental generation.

Read explanation · OpenStax ↗
F2

The second filial generation, typically produced by crossing or selfing individuals.

Read explanation · OpenStax ↗
FACT complex ·

A -associated complex that helps machinery traverse and supports reorganization.

Read explanation · OpenStax ↗
fibrosis

Excess deposition of connective-tissue , often forming scar after injury.

Read explanation · OpenStax ↗
fitness

Relative reproductive contribution of a or organism in a particular environment.

Read explanation · OpenStax ↗
Fraction · ·

A portion of a sample collected during a separation, such as the fluid leaving a column during a time interval.

Read explanation · Waters ↗
Functional group

A group of whose chemical behavior gives a characteristic and properties.

Read explanation · OpenStax ↗
gamete

A reproductive cell that contributes a during fertilization.

Read explanation · OpenStax ↗
Gene

A sequence that contributes to a functional or , together with the information needed to express it.

Read explanation · OpenStax ↗
Gene dosage ·

The number of copies of a or segment; changing dosage can affect expression without altering each copy’s sequence.

Read explanation · NHGRI / NIH ↗
Gene expression

Production of a functional from a , including and, for -coding , .

Read explanation · NCBI Bookshelf ↗
Gene silencing ·

A or loss of , which can occur through , transcriptional, or -mediated mechanisms.

Read explanation · OpenStax ↗
Genome

The complete genetic material of an organism or cell.

Read explanation · OpenStax ↗
genotype

The allelic composition of an organism at one or more specified .

Read explanation · OpenStax ↗
Guanine

A that pairs with through three .

Read explanation · OpenStax ↗
Haploid

Having one set of , as in a human .

Read explanation · OpenStax ↗
hemizygous

Having only one copy of a in an otherwise organism, as for many X-linked in an XY individual.

Read explanation · OpenStax ↗
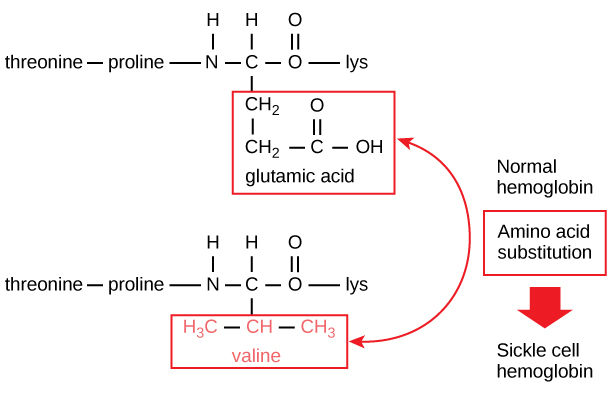
Hemoglobin

The oxygen-carrying in , composed of four with heme groups.

Read explanation · OpenStax ↗
heterozygote ·

An individual with two different at a specified .

Read explanation · OpenStax ↗
Histidine ·

A with an . Mostly uncharged near physiological , it can accept or donate .

Read explanation · OpenStax ↗
Histone

A -associated rich in . Core histones form the around which nucleosomal wraps.

Read explanation · OpenStax ↗
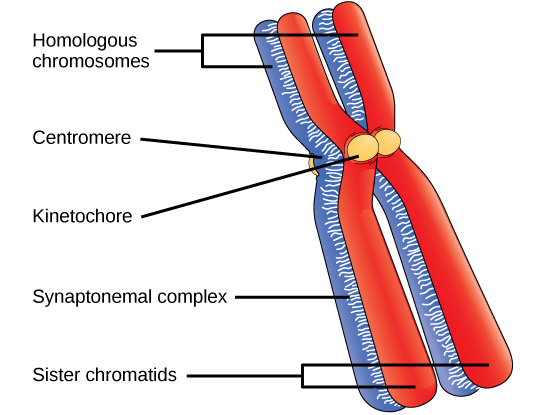
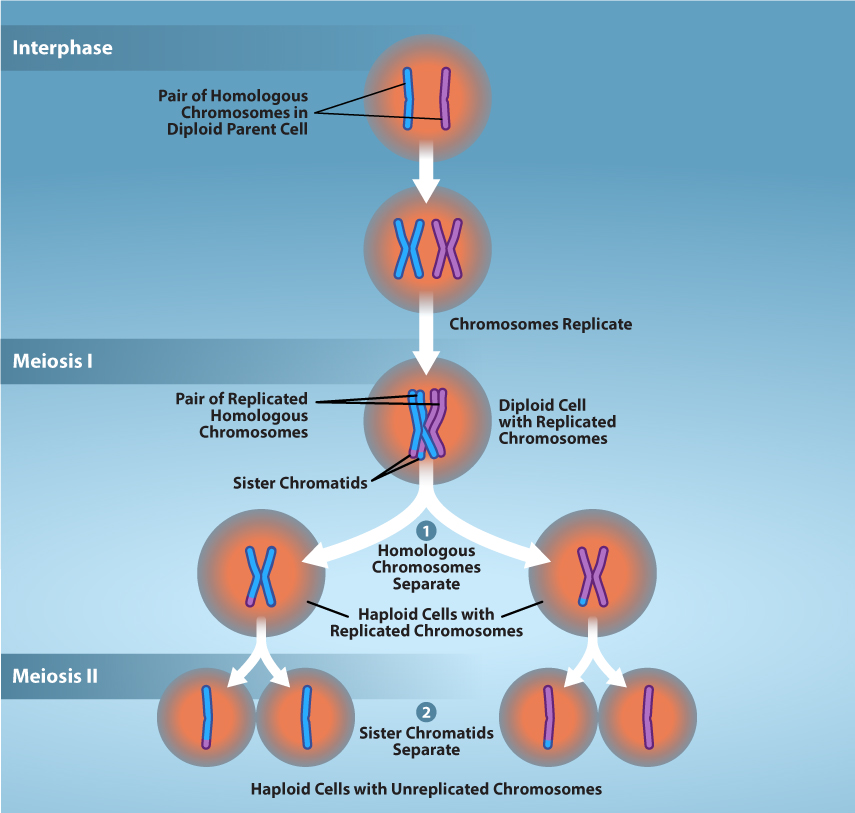
homologous chromosomes

A pair with corresponding , one usually inherited from each parent.

Read explanation · OpenStax ↗
homozygote ·

An individual with two identical at a specified .

Read explanation · OpenStax ↗
Hybridization

Pairing of complementary strands, used for sequence-specific detection.

Read explanation · NHGRI ↗
Hydrogen bond ·

An attraction between a hydrogen bonded to an and another . hydrogen bonds stabilize .

Read explanation · OpenStax ↗
Hydrogen ion · ·

A positively hydrogen species. H⁺ denotes a , which is hydrated in water; its activity determines .

Read explanation · OpenStax ↗
Hydrolysis

Breaking a chemical bond by adding water. hydrolysis separates .

Read explanation · OpenStax ↗
Hydrophilic

Interacting favorably with water, typically because a group is or .

Read explanation · OpenStax ↗
Hydrophobic

Interacting poorly with water. often gather in a ’s interior.

Read explanation · OpenStax ↗
Hydroxide ion ·

The negatively OH⁻. Basic contain a higher hydroxide ion activity than water at the same temperature.

Read explanation · OpenStax ↗
Hydroxyl group ·

An oxygen bonded to hydrogen, –OH. Hydroxyl groups can and often increase .

Read explanation · OpenStax ↗
Imidazole

A five-membered ring containing two nitrogens; ’s contains this ring.

Read explanation · OpenStax ↗
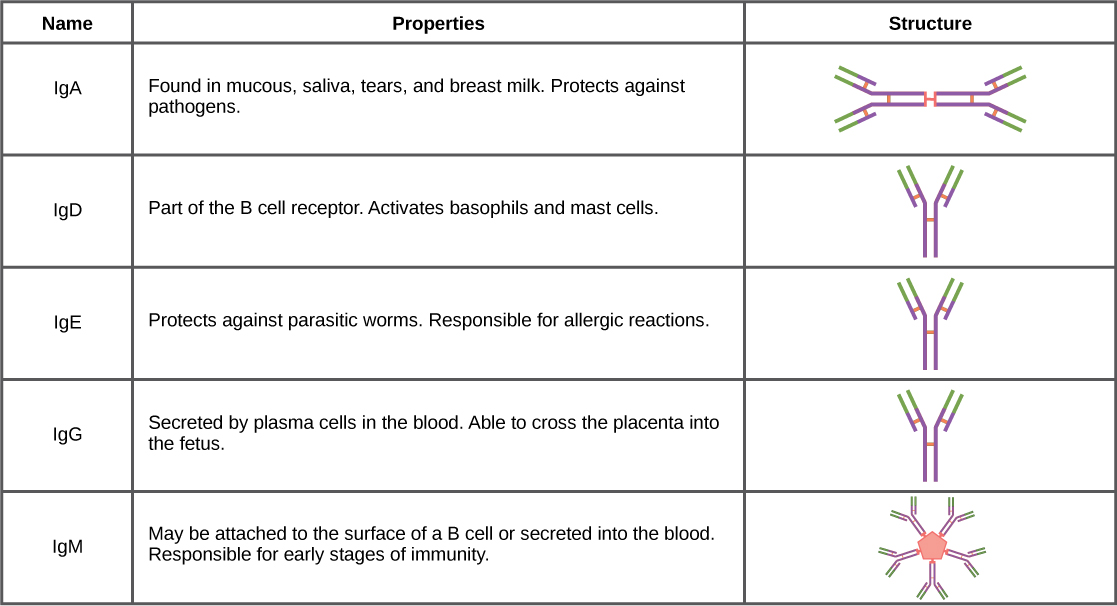
Immunoglobulin

An or the -bound form of the same type of -binding .

Read explanation · OpenStax ↗
incomplete dominance

An inheritance relationship in which the lies between the two .

Read explanation · OpenStax ↗
independent assortment

Independent orientation and of different homologous pairs during .

Read explanation · OpenStax ↗
Indole

A fused six-membered and five-membered ring system containing nitrogen; found in .

Read explanation · OpenStax ↗
Ion · ·

An or with a net because its numbers of and do not balance.

Read explanation · OpenStax ↗
Isotope ·

One of several forms of an element with the same number of but different numbers of neutrons.

Read explanation · OpenStax ↗
leukocyte

A white blood cell involved in defense and immune functions.

Read explanation · OpenStax ↗
linkage

A tendency of nearby on the same to be inherited together.

Read explanation · OpenStax ↗
Lipid

A broad class of largely or , including fats, , and steroids.

Read explanation · OpenStax ↗
locus

The specific position of a or other feature.

Read explanation · OpenStax ↗
Logarithm · · ·

The exponent needed to obtain a number from a chosen fixed number. For decimal logarithms, log₁₀(100) = 2 because 10² = 100; uses the negative decimal logarithm of activity.

Read explanation · OpenStax ↗
Matrix

A supporting material, such as a gel or the solid support in a column. Its properties influence movement and binding of sample .

Read explanation · Thermo Fisher ↗
meiosis

Two successive divisions after one that usually produce cells from a precursor.

Read explanation · OpenStax ↗
Membrane · · · ·

A thin boundary or sheet. Cell membranes are bilayers containing ; membranes are synthetic supports that hold or for detection.

Read explanation · OpenStax ↗
Messenger RNA ·

An that carries coding information used by to synthesize a .

Read explanation · OpenStax ↗
Metaphase

The division stage in which condensed align before separation.

Read explanation · OpenStax ↗
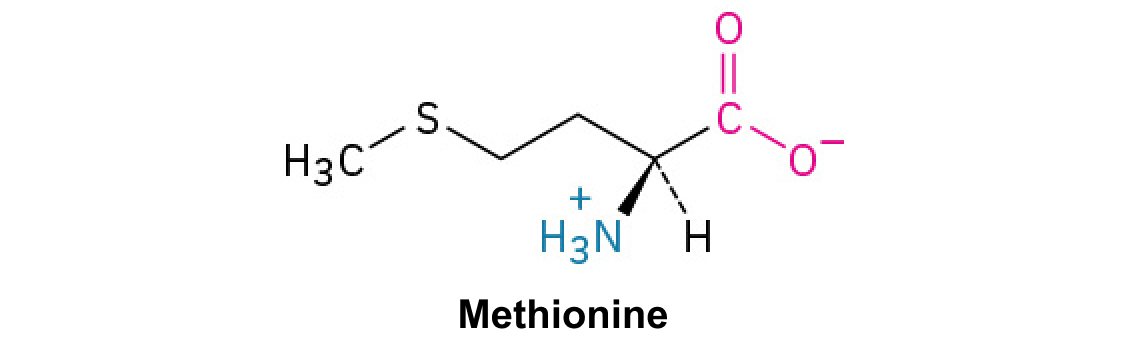
Methionine ·

A with sulfur in a . Unlike , it does not form .

Read explanation · OpenStax ↗
Mobile phase

The moving fluid that carries a sample through a system.

Read explanation · Waters ↗
Molecular chaperone · ·

A that assists other in folding or prevents , without specifying their sequence.

Read explanation · NCBI Bookshelf ↗
Molecule

Two or more joined by . A molecule may be electrically or carry a .

Read explanation · OpenStax ↗
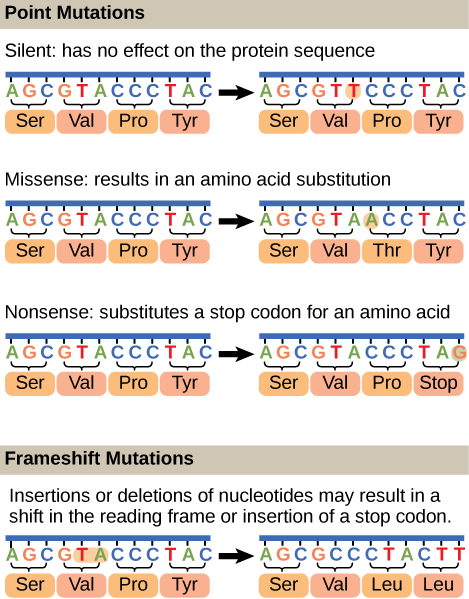
Mutation

A change in a sequence; some mutations alter a ’s sequence.

Read explanation · OpenStax ↗
Neutral

Having no net . For a , neutral instead means equal and activities; its is about 7 at 25 °C.

Read explanation · OpenStax ↗
Nitrogenous base · · ·

A nitrogen-containing ring component of ; its pairing interactions help specify sequences.

Read explanation · OpenStax ↗
Nonpolar ·

Lacking a substantial separation of . Nonpolar groups generally interact poorly with water.

Read explanation · OpenStax ↗
Nucleic acid

A of , such as or , used in information storage, expression, and other cellular functions.

Read explanation · OpenStax ↗
Nucleosome

The basic unit of : wrapped around a .

Read explanation · OpenStax ↗
Nucleotide

A joined to a sugar and one or more .

Read explanation · OpenStax ↗
Nucleus ·

A -enclosed compartment containing most of a cell’s .

Read explanation · OpenStax ↗
Octamer

A complex made of eight . A core contains eight .

Read explanation · OpenStax ↗
Oxidation ·

Loss of or an increase in oxidation state. Oxidizing two can form a .

Read explanation · OpenStax ↗
Pathogen

An infectious agent capable of causing disease in a host.

Read explanation · OpenStax ↗
Pellet

Material accumulated at the bottom or outer end of a tube after .

Read explanation · Beckman Coulter ↗
penetrance

The proportion of individuals with a who exhibit the associated .

Read explanation · www.ncbi.nlm.nih.gov ↗
Peptide

A chain of joined by ; the term commonly describes chains shorter than a typical .

Read explanation · OpenStax ↗
Peptide bond ·

A covalent between the carboxyl carbon of one and the amino nitrogen of the next.

Read explanation · OpenStax ↗
pH

A measure of , defined as the negative of activity. Lower pH means greater ; pH influences .

Read explanation · OpenStax ↗
phenotype

A measurable trait produced by interacting with development and environment.

Read explanation · OpenStax ↗
Phenylalanine ·

A with an .

Read explanation · OpenStax ↗
Phosphate group ·

A phosphorus-containing group bonded to oxygens; phosphate groups occur in , , and modified .

Read explanation · OpenStax ↗
Phospholipid

An with a -containing region and tails; a major component of cellular .

Read explanation · OpenStax ↗
Phosphorus-32 ·

A used to label .

Read explanation · OpenStax ↗
ploidy

The number of complete sets in a cell.

Read explanation · OpenStax ↗
Polar

Having an uneven distribution of . Polar groups often interact favorably with water.

Read explanation · OpenStax ↗
Polymer

A large made from many linked molecular building blocks.

Read explanation · OpenStax ↗
Polypeptide

A chain of connected by . A functional can contain one or several such chains.

Read explanation · OpenStax ↗
Porous material · · · ·

A material containing small spaces that can admit of suitable size.

Read explanation · Cytiva ↗
Probe

A used to detect a target by binding to it. In , a labeled or probe binds a complementary sequence; arrays can use or other binding .

Read explanation · NHGRI ↗
Prokaryote ·

An organism whose cells lack a -bound ; and are prokaryotes.

Read explanation · OpenStax ↗
Proline ·

An whose loops back to the nitrogen, restricting rotation and often creating bends.

Read explanation · OpenStax ↗
Protease · ·

An that hydrolyzes in or .

Read explanation · OpenStax ↗
Protein

One or more folded chains that perform biological roles such as , transport, signaling, or structural support.

Read explanation · OpenStax ↗
Protein aggregation · ·

Association of into larger clusters, often when exposed surfaces of unfolded stick together.

Read explanation · NCBI Bookshelf ↗
Protein backbone ·

The repeating nitrogen–alpha-carbon– chain of a , excluding its variable .

Read explanation · OpenStax ↗
Protein domain · ·

A region of a that forms a recognizable structural or functional unit.

Read explanation · OpenStax ↗
Proton

A positively subatomic particle. In – chemistry, donating a proton means transferring a .

Read explanation · OpenStax ↗
Protonation

Addition of a to an , , or ; this changes its by plus one.

Read explanation · OpenStax ↗
Purine · ·

A with two fused rings. and are purines.

Read explanation · OpenStax ↗
Pyrimidine · ·

A with one six-membered ring. , , and are pyrimidines.

Read explanation · OpenStax ↗
R group · ·

The variable side chain attached to an ’s . It determines identity, , , and chemical behavior.

Read explanation · OpenStax ↗
Radioisotope · ·

An with an unstable that releases radiation as it decays.

Read explanation · OpenStax ↗
Reactant

A starting substance transformed during a .

Read explanation · OpenStax ↗
Reaction intermediate · ·

A species formed in one step and consumed in another. It occupies a local energy minimum between .

Read explanation · OpenStax ↗
Reaction product ·

A substance formed by a .

Read explanation · OpenStax ↗
Receptor

A that recognizes a particular signal and helps produce a cellular response.

Read explanation · OpenStax ↗
recessive

Describing an whose specified is masked by another in a .

Read explanation · OpenStax ↗
Red blood cell · ·

A blood cell that transports oxygen using ; mature human red blood cells lack a .

Read explanation · OpenStax ↗
Reduction

Gain of or a decrease in state. Reducing a restores two .

Read explanation · OpenStax ↗
Ribonucleic acid ·

A with roles in , regulation, and ; carries -coding information.

Read explanation · OpenStax ↗
Ribosome ·

A complex of and that translates into a .

Read explanation · OpenStax ↗
Secondary structure

Local folding, such as and , stabilized mainly by .

Read explanation · OpenStax ↗
Sedimentation ·

Movement of particles through a fluid under gravity or centrifugal .

Read explanation · Beckman Coulter ↗
segregation

Separation of paired into different through segregation.

Read explanation · OpenStax ↗
Sickle-cell disease · · ·

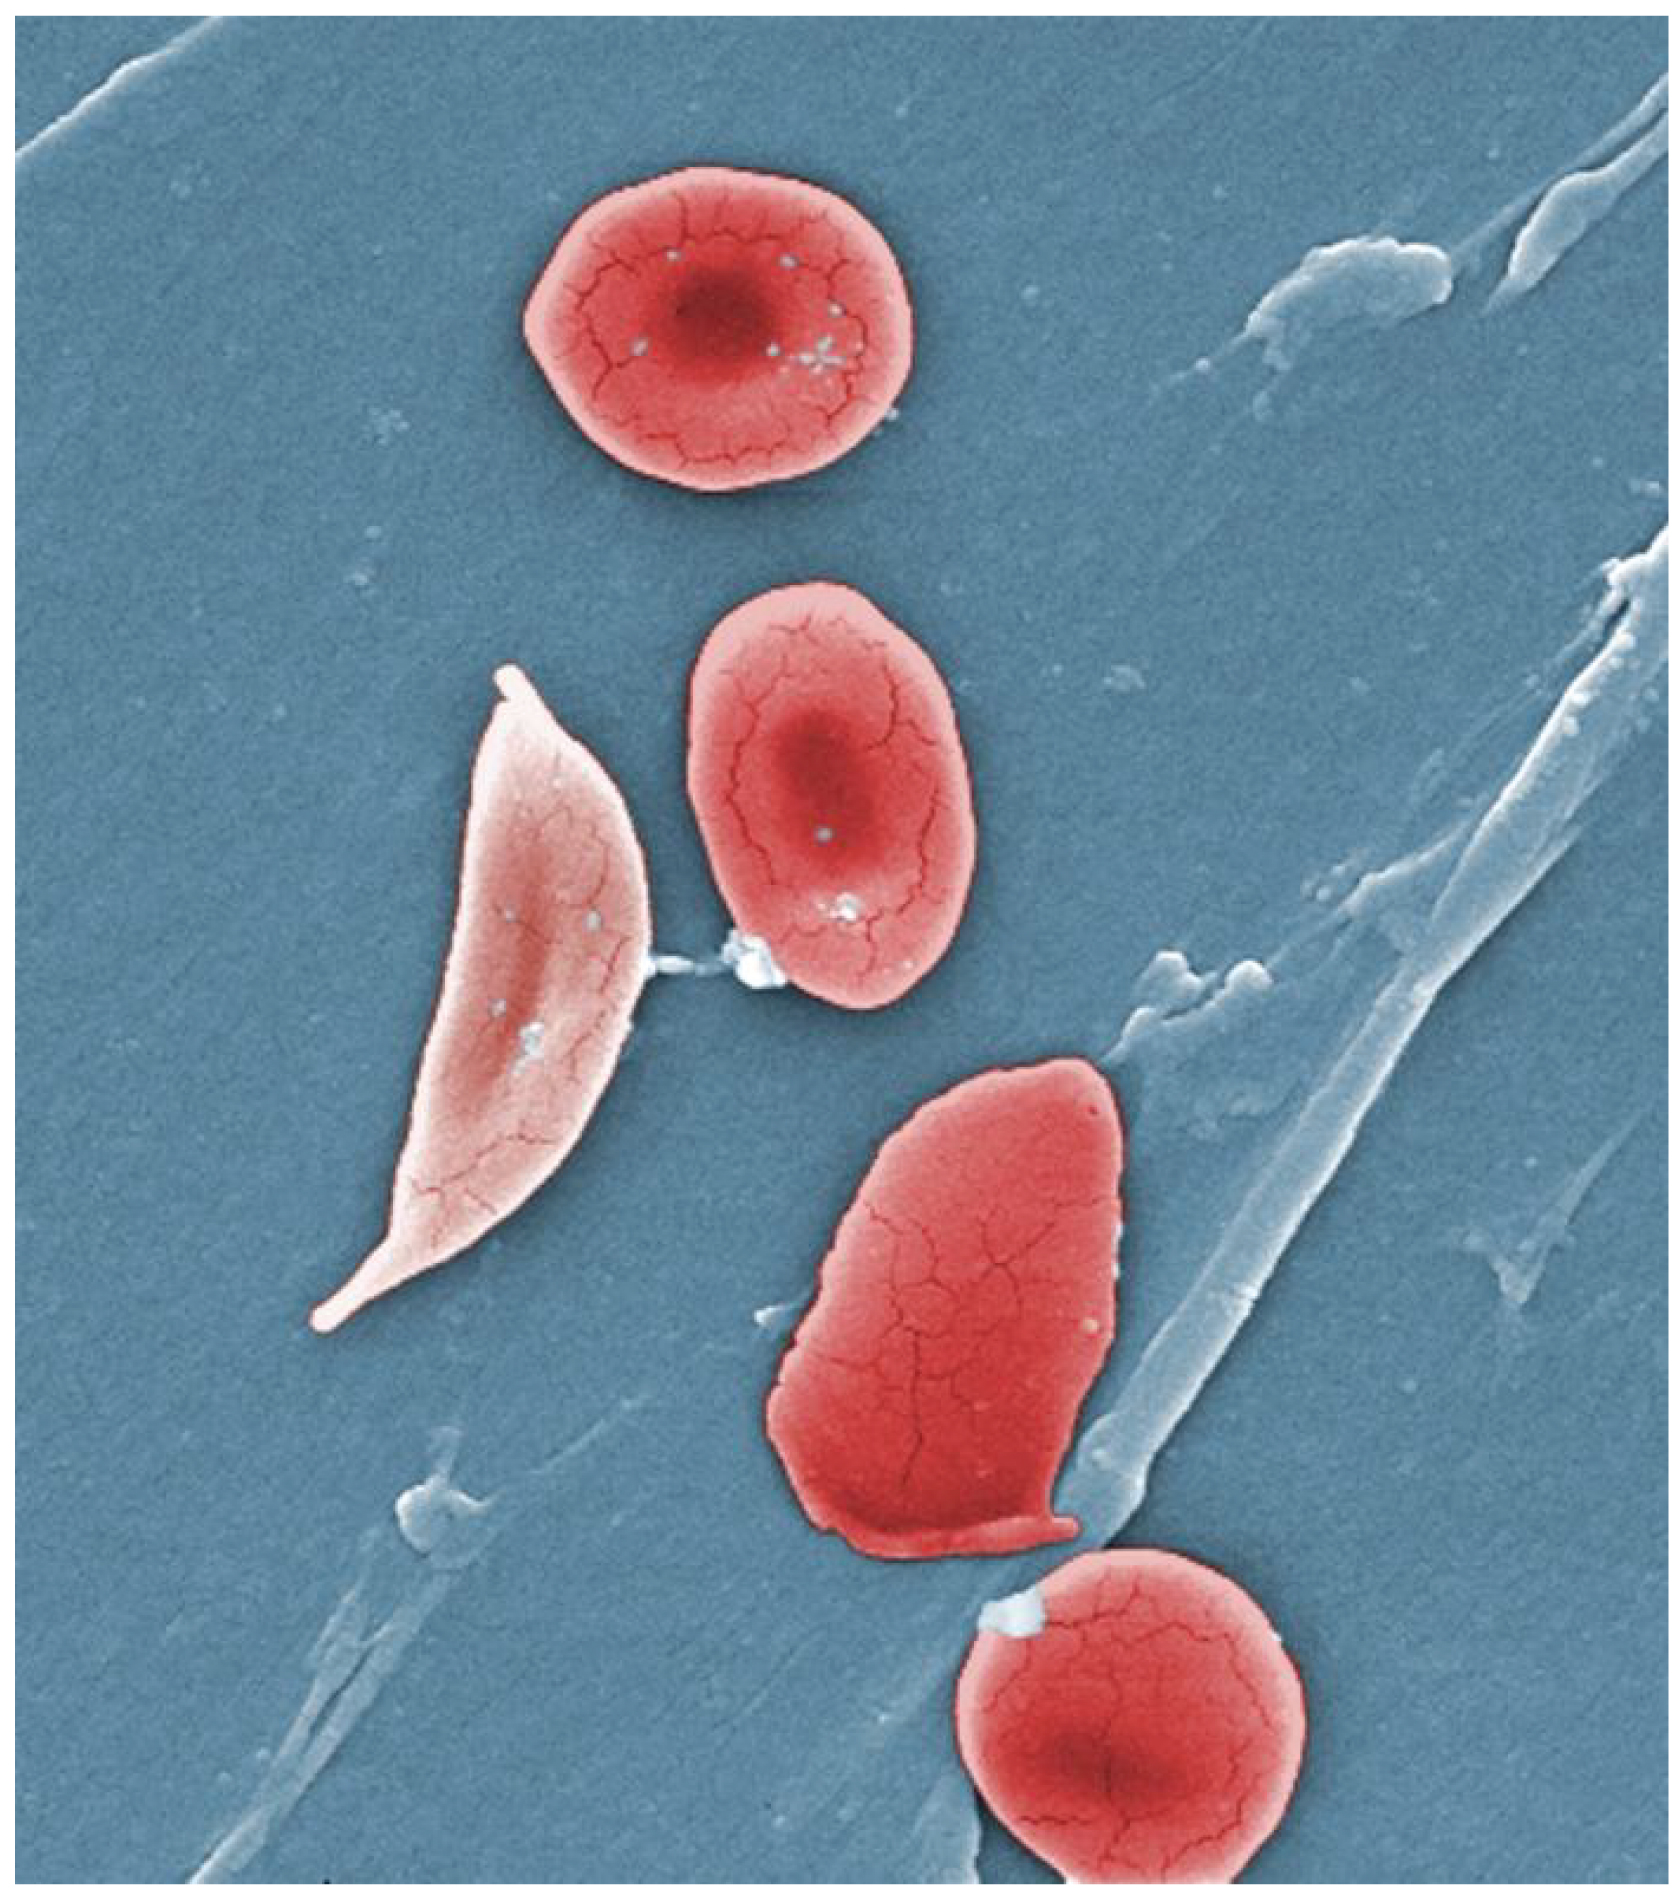
An inherited disorder in which deoxygenated can polymerize and distort .

Read explanation · OpenStax ↗
Sister chromatid

One of the two copies of a produced by . An intact sister chromatid can supply a template for accurate repair.

Read explanation · Biology LibreTexts / Oregon State University ↗
Solubility ·

The amount of a substance that can dissolve in a under specified conditions. Soluble means able to dissolve; insoluble means only very slightly soluble in that .

Read explanation · OpenStax ↗
Solute

A dissolved component of a .

Read explanation · OpenStax ↗
Solution

A homogeneous mixture in which are dissolved in a .

Read explanation · OpenStax ↗
Solvent

The component of a that dissolves other substances, usually the component present in the greatest amount.

Read explanation · OpenStax ↗
Stationary phase

The material that remains fixed in a system.

Read explanation · Waters ↗
Subunit ·

An individual chain within a containing multiple chains.

Read explanation · OpenStax ↗
synapse

A specialized connection through which a cell communicates with another electrically or chemically.

Read explanation · OpenStax ↗
Template strand · · ·

A preexisting strand whose sequence guides complementary nucleic- synthesis.

Read explanation · OpenStax ↗
testcross

A cross with a tester used to infer an unknown or reveal -parent .

Read explanation · OpenStax ↗
tetrad

A paired set of homologous duplicated containing four chromatids.

Read explanation · OpenStax ↗
Thioether

A sulfur bonded to two carbon groups, as in ’s . It has no hydrogen.

Read explanation · OpenStax ↗
Thiol group · · · ·

A sulfur bonded to hydrogen, –SH. thiols can form through .

Read explanation · OpenStax ↗
Thymine

A normally used in ; it pairs with through two .

Read explanation · OpenStax ↗
Transcription

Synthesis of using a template.

Read explanation · OpenStax ↗
Transition state

A fleeting, high-energy arrangement at a barrier. It is an energy maximum along the path, rather than a stable .

Read explanation · OpenStax ↗
Translation ·

Synthesis of a on a using the sequence of in .

Read explanation · OpenStax ↗
Tryptophan ·

An with a bulky ; commonly grouped as .

Read explanation · OpenStax ↗
Tyrosine ·

An with a phenolic . Usually uncharged near physiological .

Read explanation · OpenStax ↗
Uracil

A normally used in in place of . Uracil produced by in is a repair target.

Read explanation · OpenStax ↗
velocity

Rate of change of position, including direction.

Read explanation · OpenStax ↗
wild type

A commonly observed or reference form of a or ; it is not necessarily or optimal.

Read explanation · OpenStax ↗
zygote

The single cell formed by fusion and union of parental genetic contributions.

Read explanation · OpenStax ↗

14.1 Historical Basis of Modern Understanding

OpenStax · 14.1 Historical Basis of Modern Understanding ↗
Instructional page including learning objectives, examples, figures, source tables and questions. Site navigation and embedded media players are omitted; source media links remain available.

Learning Objectives

By the end of this section, you will be able to do the following:

Our current understanding of began with the discovery of followed by the development of the model. In the 1860s, Friedrich Miescher (Figure 14.2), a physician by profession, isolated -rich chemicals from white blood cells (). He named these chemicals (which would eventually be known as ) nuclein because they were isolated from the of the cells.

Photo of Friedrich Miescher.
Figure 14.2 — 14.1 Historical Basis of Modern Understanding

Figure 14.2 Friedrich Miescher (1844–1895) discovered nucleic acids.

Mary Ann Clark, Matthew Douglas, and Jung Choi, Biology 2E, OpenStax. · CC BY-NC-SA 4.0 · Original image ↗ · Access for free ↗

Link to Learning

To see Miescher conduct experiment that led to discovery of and associated in the , click through this review.

A half century later, in 1928, British bacteriologist Frederick Griffith reported the first demonstration of —a process in which external is taken up by a cell, thereby changing its morphology and physiology. Griffith conducted experiments with Streptococcus pneumoniae, a that causes pneumonia. Griffith worked with two strains of this called rough (R) and smooth (S). (The two cell types were called “rough” and “smooth” after the appearance of their colonies grown on a nutrient agar plate.)

The R strain is non-pathogenic (does not cause disease). The S strain is pathogenic (disease-causing), and has a capsule outside its cell wall. The capsule allows the cell to escape the immune responses of the host mouse.

When Griffith injected the living S strain into mice, they died from pneumonia. In contrast, when Griffith injected the live R strain into mice, they survived. In another experiment, when he injected mice with the heat-killed S strain, they also survived. This experiment showed that the capsule alone was not the cause of death. In a third set of experiments, a mixture of live R strain and heat-killed S strain were injected into mice, and—to surprise—the mice died. Upon isolating the live from the dead mouse, only the S strain of was recovered. When this isolated S strain was injected into fresh mice, the mice died. Griffith concluded that something had passed from the heat-killed S strain into the live R strain and transformed it into the pathogenic S strain. He called this the transforming principle (Figure 14.3). These experiments are now known as Griffith's experiments.

Four scenarios in an experiment are shown.  In the first, living S cells are injected, and the mouse dies. In the second, living R cells are injected, and the mouse is healthy. In the third, heat-killed S cells are injected, and the mouse is healthy. In the fourth, mixture of heat-killed S cells and Living R cells are injected, and the mouse dies and living S cells are recovered.
Figure 14.3 — 14.1 Historical Basis of Modern Understanding

Figure 14.3 Two strains of S. pneumoniae were used in Griffith’s transformation experiments. The R strain is non-pathogenic, whereas the S strain is pathogenic and causes death. When Griffith injected a mouse with the heat-killed S strain and a live R strain, the mouse died. The S strain was recovered from the dead mouse. Griffith concluded that something had passed from the heat-killed S strain to the R strain, transforming the R strain into the S strain in the process. Credit: Rao, A., Ryan, K. and Tag, A. Department of Biology, Texas A&M University.

Mary Ann Clark, Matthew Douglas, and Jung Choi, Biology 2E, OpenStax. · CC BY-NC-SA 4.0 · Original image ↗ · Access for free ↗

Scientists Oswald Avery, Colin MacLeod, and Maclyn McCarty (1944) were interested in exploring this transforming principle further. They isolated the S strain from the dead mice and isolated the and ( and ) as these were possible candidates for the of heredity. They used that specifically degraded each component and then used each mixture separately to transform the R strain. They found that when was degraded, the resulting mixture was no longer able to transform the , whereas all of the other combinations were able to transform the . This led them to conclude that was the transforming principle.

Career Connection

Forensic Scientist

Forensic Scientists used analysis evidence for the first time to solve an immigration case. The story started with a teenage boy returning to London from Ghana to be with mother. Immigration authorities at the airport were suspicious of him, thinking that he was traveling on a forged passport. After much persuasion, he was allowed to go live with mother, but the immigration authorities did not drop the case against him. All types of evidence, including photographs, were provided to the authorities, but deportation proceedings were started nevertheless. Around the same time, Dr. Alec Jeffreys of Leicester University in the United Kingdom had invented a technique known as fingerprinting. The immigration authorities approached Dr. Jeffreys for help. He took samples from the mother and three of her children, as well as an unrelated mother, and compared the samples with the boy’s . Because the biological father was not in the picture, from the three children was compared with the boy’s . He found a match in the boy’s for both the mother and three siblings. He concluded that the boy was indeed the mother’s son.

Forensic scientists analyze many items, including documents, handwriting, firearms, and biological samples. They analyze the content of hair, semen, saliva, and blood, and compare it with a database of profiles of known criminals. Analysis includes isolation, sequencing, and sequence analysis. Forensic scientists are expected to appear at court hearings to present their findings. They are usually employed in crime labs of city and state government agencies. Geneticists experimenting with techniques also work for scientific and research organizations, pharmaceutical industries, and college and university labs. Students wishing to pursue a career as a forensic scientist should have at least a bachelor's degree in chemistry, biology, or physics, and preferably some experience working in a laboratory.

Although the experiments of Avery, McCarty and McLeod had demonstrated that was the informational component transferred during , was still considered to be too simple a to carry biological information. , with their 20 different , were regarded as more likely candidates. The decisive experiment, conducted by Martha Chase and Alfred Hershey in 1952, provided confirmatory evidence that was indeed the genetic material and not . Chase and Hershey were studying a —a virus that infects . Viruses typically have a simple structure: a coat, called the , and a core that contains the genetic material (either or ). The infects the host cell by attaching to its surface, and then it injects its inside the cell. The makes multiple copies of itself using the host machinery, and eventually the host cell bursts, releasing a large number of . Hershey and Chase selected that would specifically distinguish the from the in infected cells. They labeled one batch of with sulfur, 35S, to label the coat. Another batch of were labeled with phosphorus, 32P. Because phosphorous is found in , but not , the and not the would be tagged with phosphorus. Likewise, sulfur is absent from , but present in several such as and .

Each batch of was allowed to infect the cells separately. After infection, the suspension was put in a blender, which caused the coat to detach from the host cell. Cells exposed long enough for infection to occur were then examined to see which of the two had entered the cell. The and suspension was spun down in a . The heavier cells settled down and formed a , whereas the lighter particles stayed in the supernatant. In the tube that contained labeled with 35S, the supernatant contained the radioactively labeled , whereas no radioactivity was detected in the . In the tube that contained the labeled with 32P, the radioactivity was detected in the that contained the heavier cells, and no radioactivity was detected in the supernatant. Hershey and Chase concluded that it was the that was injected into the cell and carried information to produce more particles, thus providing evidence that was the genetic material and not (Figure 14.4).

Illustration shows bacteria being infected by phage labeled with superscript 35 baseline upper case S, which is incorporated into the protein coat, or superscript 32 baseline upper case P, which is incorporated into the D N A. Infected bacteria were separated from phage by centrifugation and cultured. The bacteria that had been infected with phage containing superscript 32 baseline upper P labeled D N A made radioactive phage. The bacteria that had been infected with superscript 35 baseline upper S labeled phage produced unlabeled phage. The results support the hypothesis that D N A, and not protein, is the genetic material.
Figure 14.4 — 14.1 Historical Basis of Modern Understanding

Figure 14.4 In Hershey and Chase's experiments, bacteria were infected with phage radiolabeled with either 35 S, which labels protein, or 32 P, which labels DNA. Only 32 P entered the bacterial cells, indicating that DNA is the genetic material.

Mary Ann Clark, Matthew Douglas, and Jung Choi, Biology 2E, OpenStax. · CC BY-NC-SA 4.0 · Original image ↗ · Access for free ↗

Around this same time, Austrian biochemist Erwin Chargaff examined the content of in different species and found that the amounts of , , , and were not found in equal quantities, and that relative of the four varied from species to species, but not within tissues of the same individual or between individuals of the same species. He also discovered something unexpected: That the amount of equaled the amount of , and the amount of equaled the amount of (that is, A = T and G = C). Different species had equal amounts of (A+G) and (T + C), but different ratios of A+T to G+C. These observations became known as . Chargaff's findings proved immensely useful when Watson and Crick were getting ready to propose their model! You can see after reading the past few pages how science builds upon previous discoveries, sometimes in a slow and laborious process.

12.2 Characteristics and Traits

OpenStax · 12.2 Characteristics and Traits ↗
Instructional page including learning objectives, examples, figures, source tables and questions. Site navigation and embedded media players are omitted; source media links remain available.

Learning Objectives

By the end of this section, you will be able to do the following:

Physical characteristics are expressed through carried on . The genetic makeup of peas consists of two similar, or homologous, copies of each , one from each parent. Each pair of has the same linear order of . In other words, peas are organisms in that they have two copies of each . The same is true for many other plants and for virtually all animals. organisms produce , which contain one copy of each homologous that unite at fertilization to create a .

For cases in which a single a single characteristic, a organism has two genetic copies that may or may not encode the same version of that characteristic. variants that arise by and exist at the same relative locations on are called . Mendel examined the inheritance of with just two forms, but it is common to encounter more than two for any given in a natural population.

and

Two for a given in a organism are expressed and interact to produce physical characteristics. The observable traits expressed by an organism are referred to as its . An organism’s underlying genetic makeup, consisting of both physically visible and non-expressed , is called its . Mendel’s experiments demonstrate the difference between and . When true-breeding plants in which one parent had yellow pods and one had green pods were cross-fertilized, all of the F1 hybrid offspring had yellow pods. That is, the hybrid offspring were phenotypically identical to the true-breeding parent with yellow pods. However, we know that the donated by the parent with green pods was not simply lost because it reappeared in some of the F2 offspring. Therefore, the F1 plants must have been genotypically different from the parent with yellow pods.

The P1 plants that Mendel used in experiments were each for the trait he was studying. organisms that are at a given , or , have two identical for that on their . Mendel’s parental pea plants always bred true because both of the produced carried the same trait. When P1 plants with contrasting traits were cross-fertilized, all of the offspring were for the contrasting trait, meaning that their reflected that they had different for the being examined.

and

Our discussion of and organisms brings us to why the F1 offspring were identical to one of the parents, rather than expressing both . In all seven pea-plant characteristics, one of the two contrasting was , and the other was . Mendel called the the expressed unit factor; the was referred to as the latent unit factor. We now know that these so-called unit factors are actually on homologous pairs. For a that is expressed in a and pattern, and organisms will look identical (that is, they will have different but the same ). The traits of the will only be observed in individuals (Table 12.4).

Human Inheritance in and Patterns
Traits Traits
Achondroplasia Albinism
Brachydactyly Cystic
Huntington’s disease Duchenne muscular dystrophy
Marfan syndrome Galactosemia
Neurofibromatosis Phenylketonuria
Widow’s
Wooly hair Tay-Sachs disease
Table 12.4

Several conventions exist for referring to and . For the purposes of this chapter, we will abbreviate using the first letter of the ’s corresponding trait. For example, violet is the trait for a pea plant’s flower color, so the flower-color would be abbreviated as V (note that it is customary to italicize designations). Furthermore, we will use uppercase and lowercase letters to represent and , respectively. Therefore, we would refer to the of a pea plant with violet flowers as VV, a pea plant with white flowers as vv, and a pea plant with violet flowers as Vv.

The Punnett Square Approach for a Monohybrid Cross

When fertilization occurs between two true-breeding parents that differ in only one characteristic, the process is called a monohybrid cross, and the resulting offspring are monohybrids. Mendel performed seven monohybrid crosses involving contrasting traits for each characteristic. On the basis of results in F1 and F2 generations, Mendel postulated that each parent in the monohybrid cross contributed one of two paired unit factors to each offspring, and every possible combination of unit factors was equally likely.

To demonstrate a monohybrid cross, consider the case of true-breeding pea plants with yellow versus green pea seeds. The seed color is yellow; therefore, the parental were YY for the plants with yellow seeds and yy for the plants with green seeds, respectively. A Punnett square, devised by the British geneticist Reginald Punnett, can be drawn that applies the rules of probability to predict the possible outcomes of a genetic cross or mating and their expected frequencies. To prepare a Punnett square, all possible combinations of the parental are listed along the top (for one parent) and side (for the other parent) of a grid, representing their meiotic into . Then the combinations of egg and sperm are made in the boxes in the table to show which are combining. Each box then represents the of a , or fertilized egg, that could result from this mating. Because each possibility is equally likely, genotypic ratios can be determined from a Punnett square. If the pattern of inheritance ( or ) is known, the phenotypic ratios can be inferred as well. For a monohybrid cross of two true-breeding parents, each parent contributes one type of . In this case, only one is possible. All offspring are Yy and have yellow seeds (Figure 12.4).

This illustration shows a monohybrid cross. In the upper P generation, one parent has a dominant yellow phenotype and the genotype upper Y upper Y, and the other parent has the recessive green phenotype and the genotype lower y lower y. Each parent produces one kind of gamete, resulting in an upper F subscript 1 baseline generation with a dominant yellow phenotype and the genotype upper Y lower y. Self-pollination of the upper F subscript 1 baseline generation results in an upper F subscript 2 baseline generation with a 3 to 1 ratio of yellow to green peas. One out of three of the yellow pea plants has a dominant genotype of upper Y upper Y, and 2 out of 3 have the heterozygous phenotype upper Y lower y. The homozygous recessive plant has the green phenotype and the genotype lower y lower y.
Figure 12.4 — 12.2 Characteristics and Traits

Figure 12.4 In the P generation, pea plants that are true-breeding for the dominant yellow phenotype are crossed with plants with the recessive green phenotype. This cross produces F 1 heterozygotes with a yellow phenotype. Punnett square analysis can be used to predict the genotypes of the F 2 generation.

Mary Ann Clark, Matthew Douglas, and Jung Choi, Biology 2E, OpenStax. · CC BY-NC-SA 4.0 · Original image ↗ · Access for free ↗

A self-cross of one of the Yy offspring can be represented in a 2 × 2 Punnett square because each parent can donate one of two different . Therefore, the offspring can potentially have one of four combinations: YY, Yy, yY, or yy (Figure 12.4). Notice that there are two ways to obtain the Yy : a Y from the egg and a y from the sperm, or a y from the egg and a Y from the sperm. Both of these possibilities must be counted. Recall that Mendel’s pea-plant characteristics behaved in the same way in reciprocal crosses. Therefore, the two possible combinations produce offspring that are genotypically and phenotypically identical despite their and deriving from different parents. They are grouped together. Because fertilization is a random event, we expect each combination to be equally likely and for the offspring to exhibit a ratio of YY:Yy:yy of 1:2:1 (Figure 12.4). Furthermore, because the YY and Yy offspring have yellow seeds and are phenotypically identical, applying the sum rule of probability, we expect the offspring to exhibit a phenotypic ratio of 3 yellow:1 green. Indeed, working with large sample sizes, Mendel observed approximately this ratio in every F2 generation resulting from crosses for individual traits.

Mendel validated these results by performing an F3 cross in which he self-crossed the - and -expressing F2 plants. When he self-crossed the plants expressing green seeds, all of the offspring had green seeds, confirming that all green seeds had of yy. When he self-crossed the F2 plants expressing yellow seeds, he found that one-third of the plants bred true, and two-thirds of the plants segregated at a 3:1 ratio of yellow:green seeds. In this case, the true-breeding plants had (YY) , whereas the segregating plants corresponded to the (Yy) . When these plants self-fertilized, the outcome was just like the F1 self-fertilizing cross.

The Test Cross Distinguishes the

Beyond predicting the offspring of a cross between known or parents, Mendel also developed a way to determine whether an organism that expressed a trait was a or a . Called the test cross, this technique is still used by plant and animal breeders. In a test cross, the -expressing organism is crossed with an organism that is for the same characteristic. If the -expressing organism is a , then all F1 offspring will be heterozygotes expressing the trait (Figure 12.5). Alternatively, if the expressing organism is a , the F1 offspring will exhibit a 1:1 ratio of heterozygotes and homozygotes (Figure 12.5). The test cross further validates Mendel’s postulate that pairs of unit factors segregate equally.

Visual Connection

In a test cross, a parent with a dominant phenotype but unknown genotype is crossed with a recessive parent. If the parent with the unknown phenotype is homozygous dominant, all of the resulting offspring will have at least one dominant allele. If the parent with the unknown phenotype is heterozygous, fifty percent of the offspring will inherit a recessive allele from both parents and will have the recessive phenotype.
Figure 12.5 — 12.2 Characteristics and Traits

Figure 12.5 A test cross can be performed to determine whether an organism expressing a dominant trait is a homozygote or a heterozygote.

Mary Ann Clark, Matthew Douglas, and Jung Choi, Biology 2E, OpenStax. · CC BY-NC-SA 4.0 · Original image ↗ · Access for free ↗

In pea plants, round peas (R) are to wrinkled peas (r). You do a test cross between a pea plant with wrinkled peas ( rr) and a plant of unknown that has round peas. You end up with three plants, all which have round peas. From this data, can you tell if the round pea parent plant is or ? If the round pea parent plant is , what is the probability that a random sample of 3 progeny peas will all be round?

Many human diseases are genetically inherited. A healthy person in a family in which some members suffer from a genetic disorder may want to know if they have the disease-causing and what risk exists of passing the disorder on to their offspring. Of course, doing a test cross in humans is unethical and impractical. Instead, geneticists use pedigree analysis to study the inheritance pattern of human genetic diseases (Figure 12.6).

Visual Connection

This is a pedigree of a family that carries the recessive disorder alkaptonuria. In the second generation, an unaffected mother and an affected father have three children. One child has the disorder, so the genotype of the mother must be upper case A lower case a, and the genotype of the father is lower case a lower case a. One unaffected child goes on to have two children, one affected and one unaffected. Because her husband was not affected, she and her husband must both be heterozygous. The genotype of their unaffected child is unknown, and is designated upper A question mark. In the third generation, the other unaffected child had no offspring. The affected third-generation child goes on to have one child with the disorder. Her husband is unaffected and is labeled 3. The first generation father is affected and is labeled 1; The first generation mother is unaffected and is labeled 2 The Visual Connection question asks the genotype of the three numbered individuals.
Figure 12.6 — 12.2 Characteristics and Traits

Figure 12.6 Alkaptonuria is a recessive genetic disorder in which two amino acids, phenylalanine and tyrosine, are not properly metabolized. Affected individuals may have darkened skin and brown urine, and may suffer joint damage and other complications. In this pedigree, individuals with the disorder are indicated in blue and have the genotype aa . Unaffected individuals are indicated in yellow and have the genotype AA or Aa . Note that it is often possible to determine a person’s genotype from the genotype of their offspring. For example, if neither parent has the disorder but their child does, they must be heterozygous. Two individuals on the pedigree have an unaffected phenotype but unknown genotype. Because they do not have the disorder, they must have at least one normal allele, so their genotype gets the “ A? ” designation.

Mary Ann Clark, Matthew Douglas, and Jung Choi, Biology 2E, OpenStax. · CC BY-NC-SA 4.0 · Original image ↗ · Access for free ↗

What are the of the individuals labeled 1, 2, and 3?

Alternatives to Dominance and Recessiveness

Mendel’s experiments with pea plants suggested that: (1) two “units” or exist for every ; (2) maintain their integrity in each generation (no blending); and (3) in the presence of the , the is hidden and makes no contribution to the . Therefore, can be “carried” and not expressed by individuals. Such individuals are sometimes referred to as “carriers.” Further genetic studies in other plants and animals have shown that much more complexity exists, but that the fundamental principles of Mendelian genetics still hold true. In the sections to follow, we consider some of the extensions of Mendelism. If Mendel had chosen an experimental system that exhibited these genetic complexities, it’s possible that he would not have understood what results meant.

Mendel’s results, that traits are inherited as and pairs, contradicted the view at that time that offspring exhibited a blend of their parents’ traits. However, the occasionally does appear to be intermediate between the two parents. For example, in the snapdragon, Antirrhinum majus (Figure 12.7), a cross between a parent with white flowers (CWCW) and a parent with red flowers (CRCR) will produce offspring with pink flowers (CRCW). (Note that different genotypic abbreviations are used for Mendelian extensions to distinguish these patterns from simple dominance and recessiveness.) This pattern of inheritance is described as , denoting the expression of two contrasting such that the individual displays an intermediate . This is a form of interaction where neither is completely over the other. However, the results of a self-cross can still be predicted, just as with Mendelian and crosses. In this case, the genotypic ratio would be 1 CRCR:2 CRCW:1 CWCW, and the phenotypic ratio would be 1:2:1 for red:pink:white.

Photo is of a snapdragon with a pink flower.
Figure 12.7 — 12.2 Characteristics and Traits

Figure 12.7 These pink flowers of a heterozygote snapdragon result from incomplete dominance. (credit: “storebukkebruse”/Flickr)

Mary Ann Clark, Matthew Douglas, and Jung Choi, Biology 2E, OpenStax. (credit: “storebukkebruse”/Flickr) · CC BY-NC-SA 4.0 · Original image ↗ · Access for free ↗

A variation on is , in which both for the same characteristic are simultaneously expressed in the . An example of is the MN blood groups of humans. The M and N are expressed in the form of an M or N present on the surface of . Homozygotes (LMLM and LNLN) express either the M or the N , and heterozygotes (LMLN) express both equally. In a self-cross between heterozygotes expressing a codominant trait, the three possible offspring are phenotypically distinct. However, the 1:2:1 genotypic ratio characteristic of a Mendelian monohybrid cross still applies.

Multiple

Mendel implied that only two , one and one , could exist for a given . We now know that this is an oversimplification. Although individual humans (and all organisms) can only have two for a given , multiple may exist at the population level such that many combinations of two are observed. Note that when many exist for the same , the convention is to denote the most common or among wild animals as the (often abbreviated “+”); this is considered the standard or norm. All other or are considered variants of this standard, meaning that they deviate from the . The variant may be or to the wild-type .

An example of multiple is coat color in rabbits (Figure 12.8). Here, four exist for the c . The wild-type version, C+C+, is expressed as brown fur. The chinchilla , cchcch, is expressed as black-tipped white fur. The Himalayan , chch, has black fur on the extremities and white fur elsewhere. Finally, the albino, or “colorless” , cc, is expressed as white fur. In cases of multiple , dominance hierarchies can exist. In this case, the wild-type is over all the others, chinchilla is incompletely over Himalayan and albino, and Himalayan is over albino. This hierarchy, or allelic series, was revealed by observing the of each possible offspring.

This illustration shows the four different variants for coat color in rabbits at the c allele. The genotype upper case C upper case C produces the wild type phenotype, which is brown. The genotype lower case c superscript c h baseline lower case c superscript c h baseline produces the chinchilla phenotype, which is black-tipped white fur. The genotype lower case c superscript h baseline, lower case c superscript h baseline, produces the Himalayan phenotype, which is white on the body and black on the extremities. The genotype lower case c lower case c produces the recessive phenotype, which is white.
Figure 12.8 — 12.2 Characteristics and Traits

Figure 12.8 Four different alleles exist for the rabbit coat color ( C ) gene.

Mary Ann Clark, Matthew Douglas, and Jung Choi, Biology 2E, OpenStax. · CC BY-NC-SA 4.0 · Original image ↗ · Access for free ↗

The of a wild-type over all other mutants often occurs as an effect of “” of a specific , such that the wild-type supplies the correct amount of whereas the mutant cannot. For the allelic series in rabbits, the wild-type may supply a given of fur pigment, whereas the mutants supply a lesser or none at all. Interestingly, the Himalayan is the result of an that produces a temperature-sensitive that only produces pigment in the cooler extremities of the rabbit’s body.

Alternatively, one mutant can be over all other , including the . This may occur when the mutant somehow interferes with the genetic message so that even a with one wild-type copy expresses the mutant . One way in which the mutant can interfere is by enhancing the function of the wild-type or changing its distribution in the body. One example of this is the Antennapedia in Drosophila (Figure 12.9). In this case, the mutant expands the distribution of the , and as a result, the Antennapedia develops legs on its head where its antennae should be.

This photo shows Drosophila that has normal antennae on its head, and a mutant that has legs on its head.
Figure 12.9 — 12.2 Characteristics and Traits

Figure 12.9 As seen in comparing the wild-type Drosophila (left) and the Antennapedia mutant (right), the Antennapedia mutant has legs on its head in place of antennae.

Mary Ann Clark, Matthew Douglas, and Jung Choi, Biology 2E, OpenStax. · CC BY-NC-SA 4.0 · Original image ↗ · Access for free ↗

Evolution Connection

Multiple Confer Drug Resistance in the Malaria Parasite

Malaria is a parasitic disease in humans that is transmitted by infected female mosquitoes, including Anopheles gambiae (Figure 12.10a), and is characterized by cyclic high fevers, chills, flu-like symptoms, and severe . Plasmodium falciparum and P. vivax are the most common causative agents of malaria, and P. falciparum is the most deadly (Figure 12.10b). When promptly and correctly treated, P. falciparum malaria has a mortality rate of 0.1 percent. However, in some parts of the world, the parasite has evolved resistance to commonly used malaria treatments, so the most effective malarial treatments can vary by geographic region.

Photo A shows the Anopheles gambiae mosquito, which carries malaria. Photo b shows a micrograph of sickle-shaped Plasmodium falciparum, the parasite that causes malaria. The Plasmodium is about 0.75 microns across.
Figure 12.10 — 12.2 Characteristics and Traits

Figure 12.10 The (a) Anopheles gambiae , or African malaria mosquito, acts as a vector in the transmission to humans of the malaria-causing parasite (b) Plasmodium falciparum , here visualized using false-color transmission electron microscopy. (credit a: James D. Gathany; credit b: Ute Frevert; false color by Margaret Shear; scale-bar data from Matt Russell)

Mary Ann Clark, Matthew Douglas, and Jung Choi, Biology 2E, OpenStax. (credit a: James D. Gathany; credit b: Ute Frevert; false color by Margaret Shear; scale-bar data from Matt Russell) · CC BY-NC-SA 4.0 · Original image ↗ · Access for free ↗

In Southeast Asia, Africa, and South America, P. falciparum has developed resistance to the anti-malarial drugs chloroquine, mefloquine, and sulfadoxine-pyrimethamine. P. falciparum, which is during the life stage in which it is infectious to humans, has evolved multiple drug-resistant mutant of the dhps . Varying degrees of sulfadoxine resistance are associated with each of these . Being , P. falciparum needs only one drug-resistant to express this trait.

In Southeast Asia, different sulfadoxine-resistant of the dhps are localized to different geographic regions. This is a common evolutionary phenomenon that occurs because drug-resistant mutants arise in a population and interbreed with other P. falciparum isolates in close proximity. Sulfadoxine-resistant parasites cause considerable human hardship in regions where this drug is widely used as an over-the-counter malaria remedy. As is common with that multiply to large numbers within an infection cycle, P. falciparum evolves relatively rapidly (over a decade or so) in response to the selective pressure of commonly used anti-malarial drugs. For this reason, scientists must constantly work to develop new drugs or drug combinations to combat the worldwide malaria burden.2

X-Linked Traits

In humans, as well as in many other animals and some plants, the sex of the individual is determined by sex . The sex are one pair of non-. Until now, we have only considered inheritance patterns among non-sex , or autosomes. In addition to 22 homologous pairs of autosomes, human females have a homologous pair of X , whereas human males have an XY pair. Although the Y contains a small region of similarity to the X so that they can pair during , the Y is much shorter and contains many fewer . In , when Nettie Stevens discovered that the X and Y were the determinants of sex, she differentiated them only by size. (Note that in this case and in the description below, the terms X and Y were not used at the time.) When a being examined is present on the X , but not on the Y , it is said to be X-linked.

Eye color in Drosophila was one of the first X-linked traits to be identified. Thomas Hunt Morgan mapped this trait to what became known as the X in 1910. Like humans, Drosophila males have an XY pair, and females are XX. In flies, the wild-type eye color is red (XW) and it is to white eye color (Xw) (Figure 12.11). Because of the location of the eye-color , reciprocal crosses do not produce the same offspring ratios. Males are said to be , because they have only one for any X-linked characteristic. Hemizygosity makes the descriptions of dominance and recessiveness irrelevant for XY males. Drosophila males lack a second copy on the Y ; that is, their can only be XWY or XwY. In contrast, females have two copies of this and can be XWXW, XWXw, or XwXw.

Photo shows six fruit flies, each with a different eye color.
Figure 12.11 — 12.2 Characteristics and Traits

Figure 12.11 In Drosophila , several genes determine eye color. The genes for white and vermilion eye colors are located on the X chromosome. Others are located on the autosomes. Clockwise from top left are brown, cinnabar, sepia, vermilion, white, and red. Red eye color is wild-type and is dominant to white eye color.

Mary Ann Clark, Matthew Douglas, and Jung Choi, Biology 2E, OpenStax. · CC BY-NC-SA 4.0 · Original image ↗ · Access for free ↗

In an X-linked cross, the of F1 and F2 offspring depend on whether the trait was expressed by the male or the female in the P1 generation. With regard to Drosophila eye color, when the P1 male expresses the white-eye and the female is red-eyed, all members of the F1 generation exhibit red eyes (Figure 12.12). The F1 females are (XWXw), and the males are all XWY, having received their X from the P1 female and their Y from the P1 male. A subsequent cross between the XWXw female and the XWY male would produce only red-eyed females (with XWXW or XWXw ) and both red- and white-eyed males (with XWY or XwY ). Now, consider a cross between a white-eyed female and a male with red eyes. The F1 generation would exhibit only red-eyed females (XWXw) and only white-eyed males (XwY). Half of the F2 females would be red-eyed (XWXw) and half would be white-eyed (XwXw). Similarly, half of the F2 males would be red-eyed (XWY) and half would be white-eyed (XwY).

Visual Connection

This illustration shows a Punnett square analysis of fruit fly eye color, which is a sex-linked trait. A red-eyed male fruit fly with the genotype X superscript upper case W baseline, Y, is crossed with a white-eyed female fruit fly with the genotype X superscript lower case w baseline, X superscript lower case w baseline. All of the female offspring acquire a dominant upper case W allele from the father and a recessive lower case w allele from the mother, and are therefore heterozygous dominant with red eye color. All of the male offspring acquire a recessive lower case w allele from the mother and a Y chromosome from the father and are therefore hemizygous recessive with white eye color.
Figure 12.12 — 12.2 Characteristics and Traits

Figure 12.12 Punnett square analysis is used to determine the ratio of offspring from a cross between a red-eyed male fruit fly and a white-eyed female fruit fly.

Mary Ann Clark, Matthew Douglas, and Jung Choi, Biology 2E, OpenStax. · CC BY-NC-SA 4.0 · Original image ↗ · Access for free ↗

What ratio of offspring would result from a cross between a white-eyed male and a female that is for red eye color?

Discoveries in fruit fly genetics can be applied to human genetics. When a female parent is for a X-linked trait, she will pass the trait on to 100 percent of her offspring. Her male offspring are, therefore, destined to express the trait, as they will inherit their father's Y . In humans, the for certain conditions (some forms of color blindness, hemophilia, and muscular dystrophy) are X-linked. Females who are for these diseases are said to be carriers and may not exhibit any phenotypic effects. These females will pass the disease to half of their sons and will pass status to half of their daughters; therefore, X-linked traits appear more frequently in males than females.

In some groups of organisms with sex , the sex with the non-homologous sex is the female rather than the male. This is the case for all birds. In this case, sex-linked traits will be more likely to appear in the female, in which they are .

Human Sex-linked Disorders

Sex- studies in Morgan’s laboratory provided the fundamentals for understanding X-linked disorders in humans, which include red-green color blindness, and Types A and B hemophilia. Because human males need to inherit only one mutant X to be affected, X-linked disorders are disproportionately observed in males. Females must inherit X-linked from both of their parents in order to express the trait. When they inherit one X-linked mutant and one X-linked wild-type , they are carriers of the trait and are typically unaffected. females can manifest mild forms of the trait due to the inactivation of the located on one of the X . However, female carriers can contribute the trait to their male children, resulting in the male exhibiting the trait, or they can contribute the to their female children, resulting in the children being carriers of the trait (Figure 12.13). Although some Y-linked disorders exist, typically they are associated with infertility in males and are therefore not transmitted to subsequent generations.

A diagram shows an unaffected male with a dominant allele and an unaffected carrier female with an x-linked recessive allele. Four figures of offspring are shown representing the various resulting genetic combinations: unaffected male offspring, unaffected female offspring, affected male offspring, and unaffected carrier female offspring.
Figure 12.13 — 12.2 Characteristics and Traits

Figure 12.13 The male offspring of a person who is a carrier of a recessive X-linked disorder will have a 50 percent chance of being affected. A female will not be affected, but she will have a 50 percent chance of being a carrier like the female parent.

Mary Ann Clark, Matthew Douglas, and Jung Choi, Biology 2E, OpenStax. · CC BY-NC-SA 4.0 · Original image ↗ · Access for free ↗

Link to Learning

Watch this video to learn more about sex-linked traits.

Lethality

A large proportion of in an individual’s are essential for survival. Occasionally, a nonfunctional for an essential can arise by and be transmitted in a population as long as individuals with this also have a wild-type, functional copy. The wild-type functions at a capacity sufficient to sustain life and is therefore considered to be over the nonfunctional . However, consider two parents that have a of wild-type/nonfunctional mutant for a hypothetical essential . In one quarter of their offspring, we would expect to observe individuals that are for the nonfunctional . Because the is essential, these individuals might fail to develop past fertilization, die in utero, or die later in life, depending on what life stage requires this . An inheritance pattern in which an is only lethal in the form and in which the may be normal or have some altered nonlethal is referred to as lethal.

For crosses between individuals with a lethal that causes death before birth when , only wild-type homozygotes and heterozygotes would be observed. The genotypic ratio would therefore be 2:1. In other instances, the lethal might also exhibit a (but not lethal) in the . For instance, the lethal Curly in Drosophila affects wing shape in the form but is lethal in the .

A single copy of the wild-type is not always sufficient for normal functioning or even survival. The lethal inheritance pattern is one in which an is lethal both in the and the ; this can only be transmitted if the lethality occurs after reproductive age. Individuals with that result in lethal fail to survive even in the form. lethal are very rare because, as you might expect, the only lasts one generation and is not transmitted. However, just as the lethal might not immediately manifest the of death, lethal also might not be expressed until adulthood. Once the individual reaches reproductive age, the may be unknowingly passed on, resulting in a delayed death in both generations. An example of this in humans is Huntington’s disease, in which the nervous system gradually wastes away (Figure 12.14). People who are for the Huntington (Hh) will inevitably develop the fatal disease. However, the onset of Huntington’s disease may not occur until age 40, at which point the afflicted persons may have already passed the to 50 percent of their offspring.

Micrograph shows a neuron with nuclear inclusions characteristic of Huntington's disease.
Figure 12.14 — 12.2 Characteristics and Traits

Figure 12.14 The neuron in the center of this micrograph (yellow) has nuclear inclusions characteristic of Huntington’s disease (orange area in the center of the neuron). Huntington’s disease occurs when an abnormal dominant allele for the Huntington gene is present. (credit: Dr. Steven Finkbeiner, Gladstone Institute of Neurological Disease, The Taube-Koret Center for Huntington's Disease Research, and the University of California San Francisco/Wikimedia)

Mary Ann Clark, Matthew Douglas, and Jung Choi, Biology 2E, OpenStax. (credit: Dr. Steven Finkbeiner, Gladstone Institute of Neurological Disease, The Taube-Koret Center for Huntington's Disease Research, and the University of California San Francisco/Wikimedia) · CC BY-NC-SA 4.0 · Original image ↗ · Access for free ↗

12.3 Laws of Inheritance

OpenStax · 12.3 Laws of Inheritance ↗

Instructional page including learning objectives, examples, figures, source tables and questions. Site navigation and embedded media players are omitted; source media links remain available.

Learning Objectives

By the end of this section, you will be able to do the following:

Mendel generalized the results of pea-plant experiments into four postulates, some of which are sometimes called “laws,” that describe the basis of and inheritance in organisms. As you have learned, more complex extensions of Mendelism exist that do not exhibit the same F2 phenotypic ratios (3:1). Nevertheless, these laws summarize the basics of classical genetics.

Pairs of Unit Factors, or

Mendel proposed first that paired unit factors of heredity were transmitted faithfully from generation to generation by the and reassociation of paired factors during gametogenesis and fertilization, respectively. After he crossed peas with contrasting traits and found that the trait resurfaced in the F2 generation, Mendel deduced that hereditary factors must be inherited as discrete units. This finding contradicted the belief at that time that parental traits were blended in the offspring.

Can Be or

Mendel’s law of dominance states that in a , one trait will conceal the presence of another trait for the same characteristic. Rather than both contributing to a , the will be expressed exclusively. The will remain “latent” but will be transmitted to offspring by the same manner in which the is transmitted. The trait will only be expressed by offspring that have two copies of this (Figure 12.15), and these offspring will breed true when self-crossed.

Since Mendel’s experiments with pea plants, researchers have found that the law of dominance does not always hold true. Instead, several different patterns of inheritance have been found to exist.

Photo shows an albino alligator in the Swamp at the California Academy of Sciences.
Figure 12.15 — 12.3 Laws of Inheritance

Figure 12.15 The alligator in the photo expresses albinism, a recessive trait.

Mary Ann Clark, Matthew Douglas, and Jung Choi, Biology 2E, OpenStax. · CC BY-NC-SA 4.0 · Original image ↗ · Access for free ↗

Equal of

Observing that true-breeding pea plants with contrasting traits gave rise to F1 generations that all expressed the trait and F2 generations that expressed the and traits in a 3:1 ratio, Mendel proposed the law of . This law states that paired unit factors () must segregate equally into such that offspring have an equal likelihood of inheriting either factor. For the F2 generation of a monohybrid cross, the following three possible combinations of could result: , , or . Because heterozygotes could arise from two different pathways (receiving one and one from either parent), and because heterozygotes and individuals are phenotypically identical, the law supports Mendel’s observed 3:1 phenotypic ratio. The equal of is the reason we can apply the Punnett square to accurately predict the offspring of parents with known . The physical basis of Mendel’s law of is the first division of , in which the with their different versions of each are segregated into daughter . The role of the meiotic of in sexual reproduction was not understood by the scientific community during Mendel’s lifetime.

Mendel’s law of states that do not influence each other with regard to the sorting of into , and every possible combination of for every is equally likely to occur. The of can be illustrated by the dihybrid cross, a cross between two true-breeding parents that express different traits for two characteristics. Consider the characteristics of seed color and seed texture for two pea plants, one that has green, wrinkled seeds (yyrr) and another that has yellow, round seeds (YYRR). Because each parent is , the law of indicates that the for the green/wrinkled plant all are yr, and the for the yellow/round plant are all YR. Therefore, the F1 generation of offspring all are YyRr (Figure 12.16).

Visual Connection

This illustration shows a dihybrid cross between pea plants. In the upper case P generation, a plant that has the homozygous dominant phenotype of round, yellow peas is crossed with a plant with the homozygous recessive phenotype of wrinkled, green peas. The resulting F subscript 1 baseline offspring have a heterozygous genotype and round, yellow peas. Self-pollination of the F subscript 1 baseline generation results in F subscript 2 baseline offspring with a phenotypic ratio of 9 colon 3 colon 3 colon 1 for yellow round, green round, yellow wrinkled and green wrinkled peas, respectively.
Figure 12.16 — 12.3 Laws of Inheritance

Figure 12.16 This dihybrid cross of pea plants involves the genes for seed color and texture.

Mary Ann Clark, Matthew Douglas, and Jung Choi, Biology 2E, OpenStax. · CC BY-NC-SA 4.0 · Original image ↗ · Access for free ↗

In pea plants, round seed shape (R) is to wrinkled seed shape (r) and yellow peas (Y) are to green peas (y). What are the possible and for a cross between RrYY and rrYy pea plants? How many squares do you need to do a Punnett square analysis of this cross?

For the generation, the law of requires that each receive either an R or an r along with either a Y or a y . The law of states that a into which an r sorted would be equally likely to contain either a Y or a y . Thus, there are four equally likely that can be formed when the YyRr is self-crossed, as follows: YR, Yr, yR, and yr. Arranging these along the top and left of a 4 × 4 Punnett square (Figure 12.16) gives us 16 equally likely genotypic combinations. From these , we infer a phenotypic ratio of 9 round/yellow:3 round/green:3 wrinkled/yellow:1 wrinkled/green (Figure 12.16). These are the offspring ratios we would expect, assuming we performed the crosses with a large enough sample size.

Because of and dominance, the 9:3:3:1 dihybrid phenotypic ratio can be collapsed into two 3:1 ratios, characteristic of any monohybrid cross that follows a and pattern. Ignoring seed color and considering only seed texture in the above dihybrid cross, we would expect that three quarters of the F2 generation offspring would be round, and one quarter would be wrinkled. Similarly, isolating only seed color, we would assume that three quarters of the F2 offspring would be yellow and one quarter would be green. The sorting of for texture and color are independent events, so we can apply the rule. Therefore, the proportion of round and yellow F2 offspring is expected to be (3/4) × (3/4) = 9/16, and the proportion of wrinkled and green offspring is expected to be (1/4) × (1/4) = 1/16. These proportions are identical to those obtained using a Punnett square. Round, green and wrinkled, yellow offspring can also be calculated using the rule, as each of these includes one and one . Therefore, the proportion of each is calculated as (3/4) × (1/4) = 3/16.

The law of also indicates that a cross between yellow, wrinkled (YYrr) and green, round (yyRR) parents would yield the same F1 and F2 offspring as in the YYRR x yyrr cross.

The physical basis for the law of also lies in I, in which the different homologous pairs line up in random orientations. Each can contain any combination of paternal and maternal (and therefore the on them) because the orientation of on the plane is random.

Forked-Line Method

When more than two are being considered, the Punnett-square method becomes unwieldy. For instance, examining a cross involving four would require a 16 × 16 grid containing 256 boxes. It would be extremely cumbersome to manually enter each . For more complex crosses, the forked-line and probability methods are preferred.

To prepare a forked-line diagram for a cross between F1 heterozygotes resulting from a cross between AABBCC and aabbcc parents, we first create rows equal to the number of being considered, and then segregate the in each row on forked lines according to the probabilities for individual monohybrid crosses (Figure 12.17). We then multiply the values along each forked path to obtain the F2 offspring probabilities. Note that this process is a diagrammatic version of the rule. The values along each forked pathway can be multiplied because each assorts independently. For a trihybrid cross, the F2 phenotypic ratio is 27:9:9:9:3:3:3:1.

A forked-line diagram is shown for the F subscript 2 baseline generation of a trihybrid cross of pea plants with the dominant yellow, round, and tall phenotype with pea plants of the recessive green, wrinkled, dwarf phenotype. The top row shows that the color ratio is 3 yellow to 1 green in the F subscript 2 baseline generation. The second row shows that the probability that plants of either pea color having the round or wrinkled texture is 3 to 1. The third row shows that the probability of plants with either of the above textures having a round or wrinkled phenotype is 3 to 1. The probability of all three phenotypes occurring together is determined by multiplying each individual probability together. The probability ratio is 27 yellow slash round slash tall colon; 9 yellow slash round slash dwarf, colon, 9 yellow slash wrinked slash tall, colon, 3 yellow slash wrinkled slash dwarf, colon,  9 green slash round slash tall, colon, 3 green slash round slash dwarf, colon 3 green slash wrinkled slash tall, colon, 1 green slash wrinkled slash dwarf.
Figure 12.17 — 12.3 Laws of Inheritance
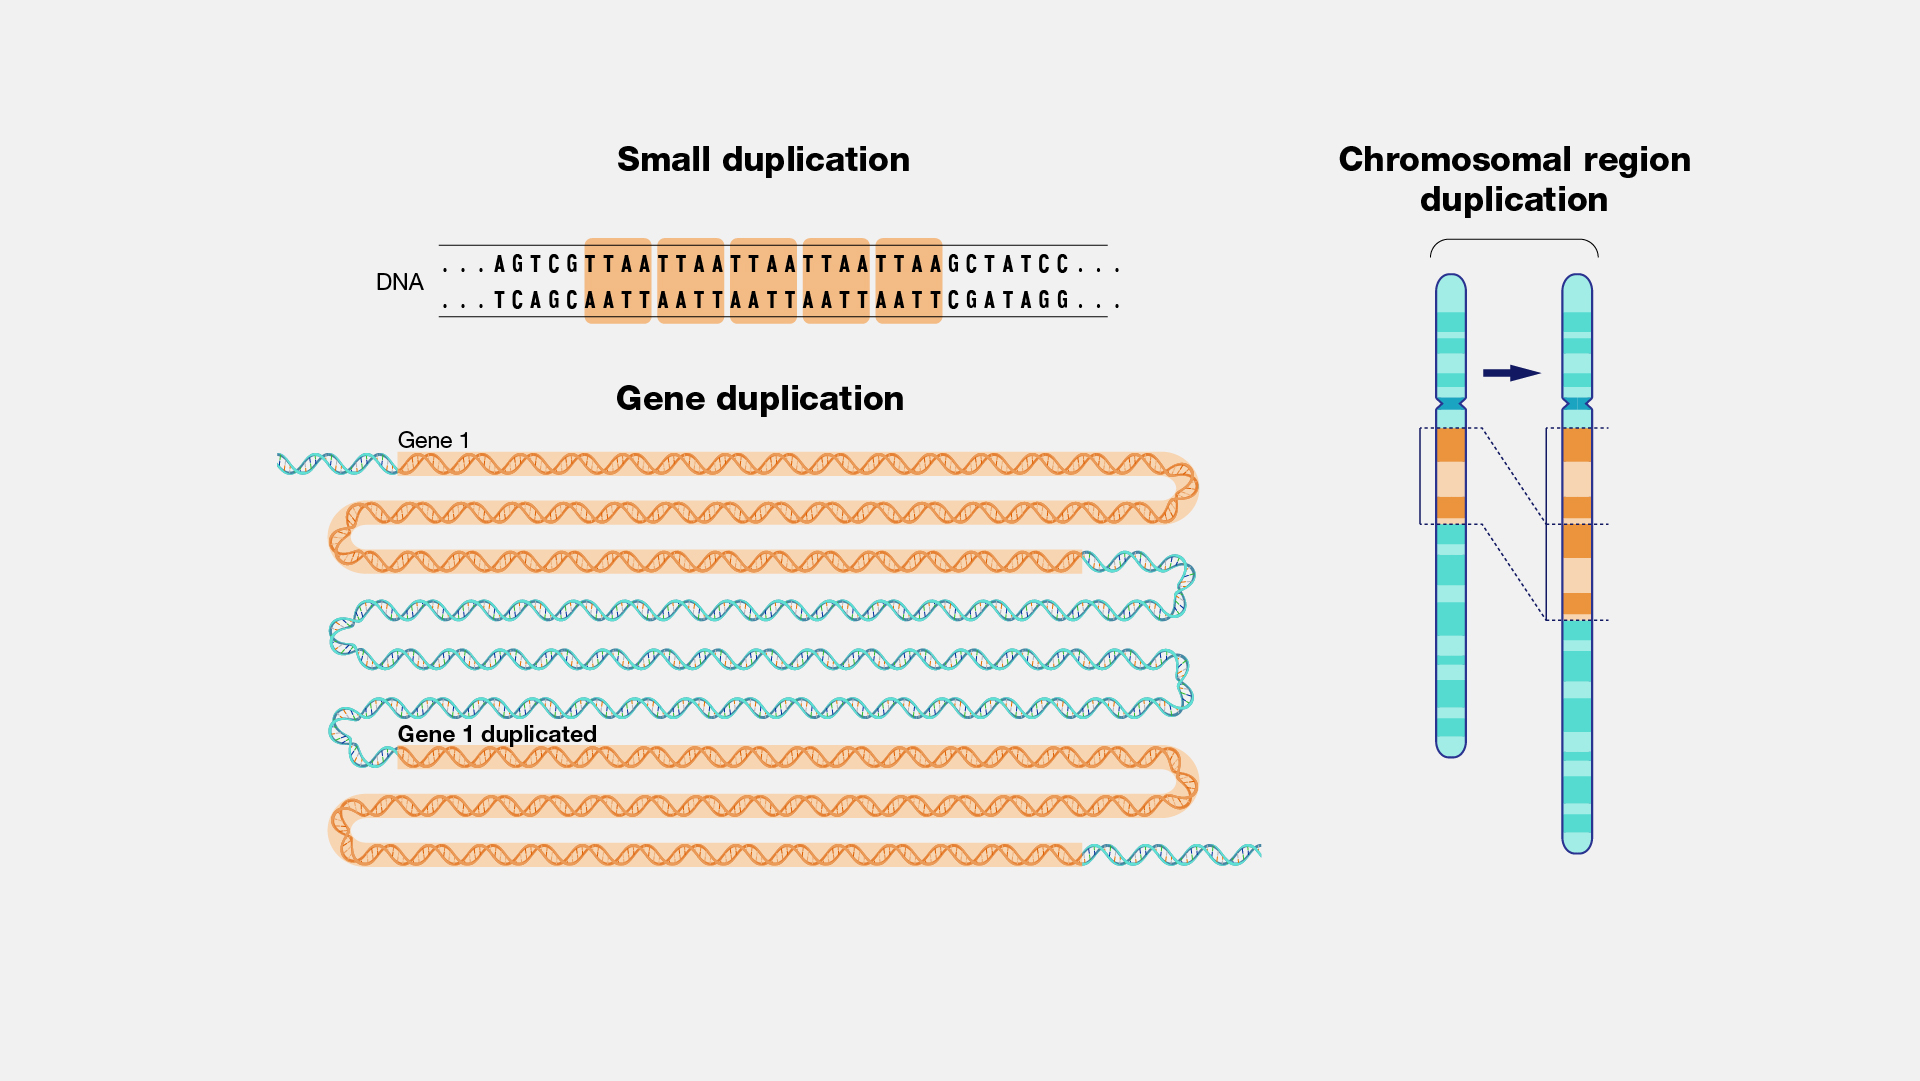
Figure 12.17 The forked-line method can be used to analyze a trihybrid cross. Here, the probability for color in the F 2 generation occupies the top row (3 yellow:1 green). The probability for shape occupies the second row (3 round: 1 wrinkled), and the probability for height occupies the third row (3 tall:1 dwarf). The probability for each possible combination of traits is calculated by multiplying the probability for each individual trait. Thus, the probability of F 2 offspring having yellow, round, and tall traits is 3 × 3 × 3, or 27.

Mary Ann Clark, Matthew Douglas, and Jung Choi, Biology 2E, OpenStax. · CC BY-NC-SA 4.0 · Original image ↗ · Access for free ↗

Probability Method

While the forked-line method is a diagrammatic approach to keeping track of probabilities in a cross, the probability method gives the proportions of offspring expected to exhibit each (or ) without the added visual assistance. Both methods make use of the rule and consider the for each separately. Earlier, we examined the phenotypic proportions for a trihybrid cross using the forked-line method; now we will use the probability method to examine the genotypic proportions for a cross with even more .

For a trihybrid cross, writing out the forked-line method is tedious, albeit not as tedious as using the Punnett-square method. To fully demonstrate the power of the probability method, however, we can consider specific genetic calculations. For instance, for a tetrahybrid cross between individuals that are heterozygotes for all four , and in which all four are sorting independently and in a and pattern, what proportion of the offspring will be expected to be for all four ? Rather than writing out every possible , we can use the probability method. We know that for each , the of offspring will be 1/4. Therefore, multiplying this for each of the four , (1/4) × (1/4) × (1/4) × (1/4), we determine that 1/256 of the offspring will be quadruply .

For the same tetrahybrid cross, what is the expected proportion of offspring that have the at all four ? We can answer this question using phenotypic proportions, but let’s do it the hard way—using genotypic proportions. The question asks for the proportion of offspring that are 1) at A or at A, and 2) at B or at B, and so on. Noting the “or” and “and” in each circumstance makes clear where to apply the sum and rules. The probability of a at A is 1/4 and the probability of a at A is 1/2. The probability of the or the is 1/4 + 1/2 = 3/4 using the sum rule. The same probability can be obtained in the same way for each of the other , so that the probability of a at A and B and C and D is, using the rule, equal to 3/4 × 3/4 × 3/4 × 3/4, or 81/256. If you are ever unsure about how to combine probabilities, returning to the forked-line method should make it clear.

Rules for Multihybrid Fertilization

Predicting the and of offspring from given crosses is the best way to test your knowledge of Mendelian genetics. Given a multihybrid cross that obeys and follows a and pattern, several generalized rules exist; you can use these rules to check your results as you work through genetics calculations (Table 12.5). To apply these rules, first you must determine n, the number of pairs (the number of segregating two each). For example, a cross between AaBb and AaBb heterozygotes has an n of 2. In contrast, a cross between AABb and AABb has an n of 1 because A is not .

General Rules for Multihybrid Crosses
General Rule Number of Pairs
Number of different F1 2n
Number of different F2 3n
Given and inheritance, the number of different F2 2n
Table 12.5

Violate the Law of

Although all of Mendel’s pea characteristics behaved according to the law of , we now know that some combinations are not inherited independently of each other. that are located on separate non- will always sort independently. However, each contains hundreds or thousands of , organized linearly on like beads on a string. The of into can be influenced by , in which that are located physically close to each other on the same are more likely to be inherited as a pair. However, because of the process of recombination, or “crossover,” it is possible for two on the same to behave independently, or as if they are not linked. To understand this, let’s consider the biological basis of and recombination.

possess the same in the same linear order. The may differ on homologous pairs, but the to which they correspond do not. In preparation for the first division of , replicate and . Like on the align with each other. At this stage, segments of exchange linear segments of genetic material (Figure 12.18). This process is called recombination, or crossover, and it is a common genetic process. Because the are aligned during recombination, the order is not altered. Instead, the result of recombination is that maternal and paternal are combined onto the same . Across a given , several recombination events may occur, causing extensive shuffling of .

This illustration shows a pair of homologous chromosomes. One of the pair has the alleles upper case A upper case B upper case C, and the other has the alleles lower case a lower case b lower case c. During meiosis, crossover occurs between two of the chromosomes and genetic material is exchanged, resulting in one recombinant chromosome that has the alleles upper A upper B lower c and another that has the alleles lower a lower b upper C. The other two chromosomes are non-recombinant and have the same arrangement of genes as before meiosis.
Figure 12.18 — 12.3 Laws of Inheritance

Figure 12.18 The process of crossover, or recombination, occurs when two homologous chromosomes align during meiosis and exchange a segment of genetic material. Here, the alleles for gene C were exchanged. The result is two recombinant and two non-recombinant chromosomes (for clarity, only one recombination event between two of the four chromatids is represented).

Mary Ann Clark, Matthew Douglas, and Jung Choi, Biology 2E, OpenStax. · CC BY-NC-SA 4.0 · Original image ↗ · Access for free ↗

When two are located in close proximity on the same , they are considered linked, and their tend to be transmitted through together. To exemplify this, imagine a dihybrid cross involving flower color and plant height in which the are next to each other on the . If one homologous has for tall plants and red flowers, and the other has for short plants and yellow flowers, then when the are formed, the tall and red will go together into a and the short and yellow will go into other . These are called the parental because they have been inherited intact from the parents of the individual producing . But unlike if the were on different , there will be no with tall and yellow and no with short and red . If you create the Punnett square with these , you will see that the classical Mendelian prediction of a 9:3:3:1 outcome of a dihybrid cross would not apply. As the distance between two increases, the probability of one or more crossovers between them increases, and the behave more like they are on separate . Geneticists have used the proportion of recombinant (the ones not like the parents) as a measure of how far apart are on a . Using this information, they have constructed elaborate maps of on for well-studied organisms, including humans.

Mendel’s seminal publication makes no mention of , and many researchers have questioned whether he encountered but chose not to publish those crosses out of concern that they would invalidate postulate. The garden pea has seven pairs of , and some have suggested that choice of seven characteristics was not a coincidence. However, even if the he examined were not located on separate , it is possible that he simply did not observe because of the extensive shuffling effects of recombination.

Scientific Method Connection

Testing the Hypothesis of

To better appreciate the amount of labor and ingenuity that went into Mendel’s experiments, proceed through one of Mendel’s dihybrid crosses.

Question: What will be the offspring of a dihybrid cross?

Background: Consider that pea plants mature in one growing season, and you have access to a large garden in which you can cultivate thousands of pea plants. There are several true-breeding plants with the following pairs of traits: tall plants with inflated pods, and dwarf plants with constricted pods. Before the plants have matured, you remove the pollen-producing organs from the tall/inflated plants in your crosses to prevent self-fertilization. Upon plant maturation, the plants are manually crossed by transferring pollen from the dwarf/constricted plants to the stigmata of the tall/inflated plants.

Hypothesis: Both trait pairs will sort independently according to Mendelian laws. When the true-breeding parents are crossed, all of the F1 offspring are tall and have inflated pods, which indicates that the tall and inflated traits are over the dwarf and constricted traits, respectively. A self-cross of the F1 heterozygotes results in 2,000 F2 progeny.

Test the hypothesis: Because each trait pair sorts independently, the ratios of tall:dwarf and inflated:constricted are each expected to be 3:1. The tall/dwarf trait pair is called T/t, and the inflated/constricted trait pair is designated I/i. Each member of the F1 generation therefore has a of TtIi. Construct a grid analogous to Figure 12.16, in which you cross two TtIi individuals. Each individual can donate four combinations of two traits: TI, Ti, tI, or ti, meaning that there are 16 possibilities of offspring . Because the T and I are , any individual having one or two of those will express the tall or inflated , respectively, regardless if they also have a t or i . Only individuals that are tt or ii will express the dwarf and constricted , respectively. As shown in Figure 12.19, you predict that you will observe the following offspring proportions: tall/inflated:tall/constricted:dwarf/inflated:dwarf/constricted in a 9:3:3:1 ratio. Notice from the grid that when considering the tall/dwarf and inflated/constricted trait pairs in isolation, they are each inherited in 3:1 ratios.

This figure shows all possible combinations of offspring resulting from a dihybrid cross of pea plants that are heterozygous for the tall slash dwarf and inflated slash constricted alleles.
Figure 12.19 — 12.3 Laws of Inheritance
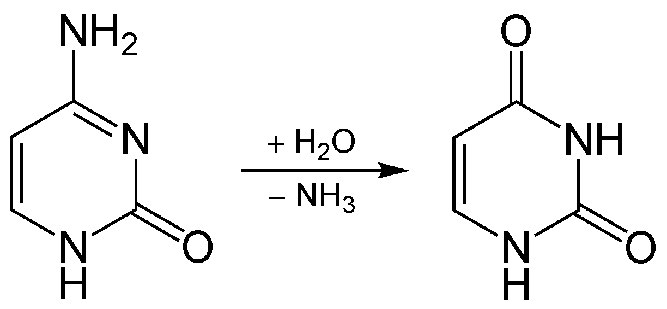
Figure 12.19 This figure shows all possible combinations of offspring resulting from a dihybrid cross of pea plants that are heterozygous for the tall/dwarf and inflated/constricted alleles.

Mary Ann Clark, Matthew Douglas, and Jung Choi, Biology 2E, OpenStax. · CC BY-NC-SA 4.0 · Original image ↗ · Access for free ↗

Test the hypothesis: You cross the dwarf and tall plants and then self-cross the offspring. For best results, this is repeated with hundreds or even thousands of pea plants. What special precautions should be taken in the crosses and in growing the plants?

Analyze your data: You observe the following plant in the F2 generation: 2706 tall/inflated, 930 tall/constricted, 888 dwarf/inflated, and 300 dwarf/constricted. Reduce these findings to a ratio and determine if they are consistent with Mendelian laws.

Form a conclusion: Were the results close to the expected 9:3:3:1 phenotypic ratio? Do the results support the prediction? What might be observed if far fewer plants were used, given that segregate randomly into ? Try to imagine growing that many pea plants, and consider the potential for experimental error. For instance, what would happen if it was extremely windy one day?

Epistasis

Mendel’s studies in pea plants implied that the sum of an individual’s was controlled by (or as he called them, unit factors), such that every characteristic was distinctly and completely controlled by a single . In , single observable characteristics are almost always under the influence of multiple (each with two or more ) acting in unison. For example, at least eight contribute to eye color in humans.

Link to Learning

Eye color in humans is determined by multiple . Use the Eye Color Calculator to predict the eye color of children from parental eye color.

In some cases, several can contribute to aspects of a common without their ever directly interacting. In the case of organ development, for instance, may be expressed sequentially, with each adding to the complexity and specificity of the organ. may function in complementary or synergistic fashions, such that two or more need to be expressed simultaneously to affect a . may also oppose each other, with one modifying the expression of another.

In epistasis, the interaction between is antagonistic, such that one masks or interferes with the expression of another. “Epistasis” is a word composed of Greek roots that mean “standing upon.” The that are being masked or are said to be hypostatic to the epistatic that are doing the masking. Often the biochemical basis of epistasis is a pathway in which the expression of one is dependent on the function of a that precedes or follows it in the pathway.

An example of epistasis is pigmentation in mice. The wild-type coat color, agouti (AA), is to solid-colored fur (aa). However, a separate (C) is necessary for pigment production. A mouse with a c at this is unable to produce pigment and is albino regardless of the present at A (Figure 12.20). Therefore, the AAcc, Aacc, and aacc all produce the same albino . A cross between heterozygotes for both (AaCc x AaCc) would generate offspring with a phenotypic ratio of 9 agouti:3 solid color:4 albino (Figure 12.20). In this case, the C is epistatic to the A .

A cross between two agouti mice with the heterozygous genotype upper A lower a upper C lower c is shown. Each mouse produces four different kinds of gametes, which are upper A upper C, and lower a upper C, and upper A lower c, and lower a lower c. A 4 by 4 Punnett square is used to determine the genotypic ratio of the offspring. The phenotypic ratio is 9 slash 16 agouti, 3 slash 16 black, and 4 slash 16 white.
Figure 12.20 — 12.3 Laws of Inheritance

Figure 12.20 In mice, the mottled agouti coat color ( A ) is dominant to a solid coloration, such as black or gray. A gene at a separate locus ( C ) is responsible for pigment production. The recessive c allele does not produce pigment, and a mouse with the homozygous recessive cc genotype is albino regardless of the allele present at the A locus. Thus, the C gene is epistatic to the A gene.

Mary Ann Clark, Matthew Douglas, and Jung Choi, Biology 2E, OpenStax. · CC BY-NC-SA 4.0 · Original image ↗ · Access for free ↗

Epistasis can also occur when a masks expression at a separate . Fruit color in summer squash is expressed in this way. expression of the W (ww) coupled with or expression of the Y (YY or Yy) generates yellow fruit, and the wwyy produces green fruit. However, if a copy of the W is present in the or form, the summer squash will produce white fruit regardless of the Y . A cross between white heterozygotes for both (WwYy × WwYy) would produce offspring with a phenotypic ratio of 12 white:3 yellow:1 green.

Finally, epistasis can be reciprocal such that either , when present in the (or ) form, expresses the same . In the shepherd’s purse plant (Capsella bursa-pastoris), the characteristic of seed shape is controlled by two in a epistatic relationship. When the A and B are both (aabb), the seeds are ovoid. If the for either of these is present, the result is triangular seeds. That is, every possible other than aabb results in triangular seeds, and a cross between heterozygotes for both (AaBb x AaBb) would yield offspring with a phenotypic ratio of 15 triangular:1 ovoid.

As you work through genetics problems, keep in mind that any single characteristic that results in a phenotypic ratio that totals 16 is typical of a two- interaction. Recall the phenotypic inheritance pattern for Mendel’s dihybrid cross, which considered two noninteracting —9:3:3:1. Similarly, we would expect interacting pairs to also exhibit ratios expressed as 16 parts. Note that we are assuming the interacting are not linked; they are still assorting independently into .