Meiosis separates homologs before sisters; recombination, chromosome location, and parental origin determine inheritance patterns.
Track chromosomes separately from DNA quantity
Let n denote chromosome sets and C the DNA in one unreplicated haploid genome. A diploid G1 cell is 2n,2C; after S phase it is 2n,4C because replication doubles chromatids without doubling centromere-defined chromosome number. Meiosis I separates homologous chromosomes, yielding n,2C cells. Meiosis II separates sister chromatids, yielding n,1C gametes. There is no intervening S phase.
Mitosis separates sisters in one division and ordinarily preserves ploidy, producing two 2n,2C daughters from a replicated diploid parent. Homolog pairing and crossing over characterize meiotic prophase I. Nondisjunction of homologs in meiosis I versus sisters in meiosis II generates different patterns of abnormal gametes.
Source: 11.1 The Process of Meiosis · 13.1 Chromosomal Theory and Genetic Linkage · 12.2 Characteristics and Traits
Segregation, synapsis, and crossing over
During prophase I, homologs pair by synapsis; the paired chromosomes form a tetrad containing four chromatids. Crossing over exchanges corresponding DNA between nonsister chromatids, producing chiasmata that help hold homologs together until segregation. At metaphase I, each homolog pair orients independently of other pairs. Random orientation produces 2^n possible combinations of parental chromosomes before considering crossing over.
Alleles at a locus segregate as homologs separate. Independent assortment applies directly to loci on different chromosomes; nearby loci on the same chromosome are linked. Crossing over can separate linked alleles, so inheritance depends on distance and phase, such as AB/ab versus Ab/aB.
Source: 11.1 The Process of Meiosis · 13.1 Chromosomal Theory and Genetic Linkage · 12.2 Characteristics and Traits
Use recombinant offspring to construct maps
In a testcross, the recessive tester reveals the gametes of the heterozygous parent. Recombination frequency equals recombinant offspring divided by total offspring × 100%; 1% corresponds approximately to 1 centimorgan for short intervals. Frequencies approach 50% for widely separated or unlinked loci and cannot distinguish those cases. Multiple crossovers can restore parental marker combinations and make two-point distances underestimate actual map length.
For three loci, identify the most common parental classes and the rarest double-crossover classes. The marker that changes position between these classes is in the middle. Add double crossovers to each adjacent interval; each double crossover counts once in each interval, hence twice in the total map distance.
Source: 11.1 The Process of Meiosis · 13.1 Chromosomal Theory and Genetic Linkage · 12.2 Characteristics and Traits
Sex chromosomes and extranuclear inheritance
In typical human XX/XY development, Y-linked SRY initiates testis differentiation; downstream genes and hormones produce sexual differentiation. An X-linked recessive allele is expressed in a person with only one X because no second allele masks it. Fathers pass an X to daughters and a Y to sons, so X-linked traits do not show father-to-son transmission. Y-linked variants pass through the paternal male line, subject to fertility and penetrance.
Mitochondrial inheritance is predominantly maternal in humans: an affected father ordinarily does not transmit mitochondrial DNA. Heteroplasmy and tissue thresholds can produce variable severity among maternal relatives. These patterns differ from genomic imprinting, which concerns parent-specific expression of nuclear alleles.
Source: 11.1 The Process of Meiosis · 13.1 Chromosomal Theory and Genetic Linkage · 12.2 Characteristics and Traits
Practice: apply the mechanism
Question. A three-point testcross has parental classes ABC and abc; its rarest classes are AbC and aBc. Of 1,000 offspring, 70 are single crossovers in A–B, 110 in B–C, and 20 are double crossovers. Find gene order and interval distances.
Show reasoning
Only B switches between parental and double-crossover classes, so B is the middle gene: A–B–C. A–B distance=(70+20)/1000 × 100=9 cM. B–C distance=(110+20)/1000 × 100=13 cM. The map spans 22 cM. The outer-marker recombinant fraction is (70+110)/1000=18% because the 20 double crossovers restore the outer parental combination.
Source: 11.1 The Process of Meiosis · 13.1 Chromosomal Theory and Genetic Linkage · 12.2 Characteristics and Traits
11.1 The Process of Meiosis — figures and tables
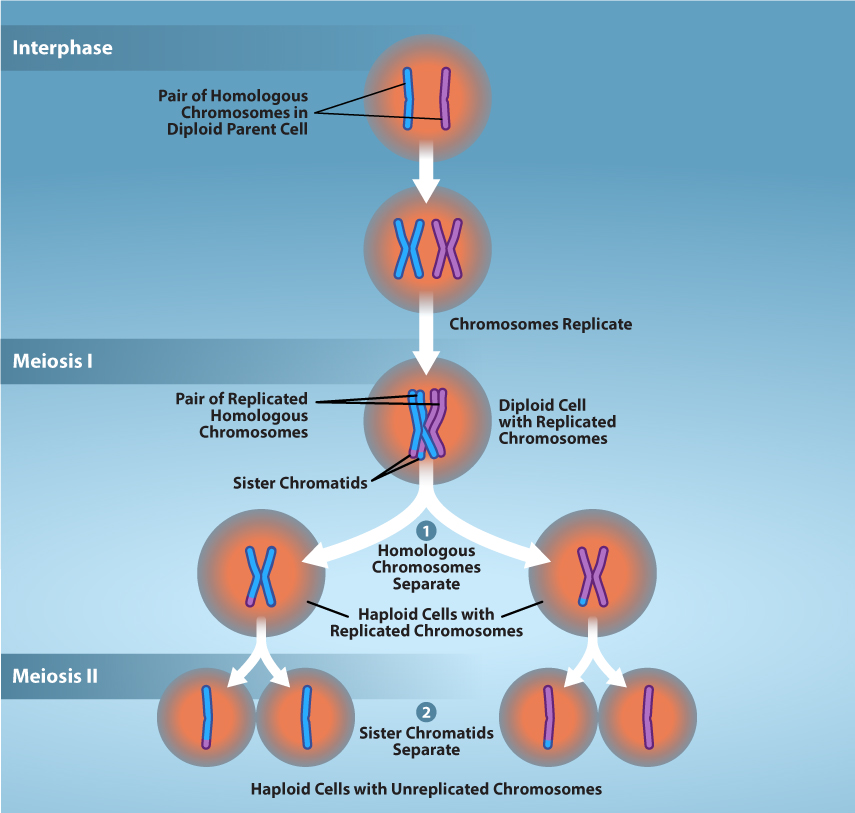
Figure 11.2 Overview of Meiosis. The production of gametes is a crucial process for sexually reproducing organisms. Meiosis is the mechanism used to reduce diploid cells to haploid gametes while introducing genetic diversity. Prior to meiosis, chromosomes are replicated in S-phase to ensure proper number of chromosomes in the resulting gametes. During meiosis, two successive rounds of division reduces the number of chromosomes (ploidy) of the cell by half. going from diploid cells to haploid gametes. Credit: Rao, A., Tag, A, Fletcher, S., and Ryan, K. Department of Biology, Texas A&M University.
Mary Ann Clark, Matthew Douglas, and Jung Choi, Biology 2E, OpenStax. · CC BY-NC-SA 4.0 · Original image ↗ · Access for free ↗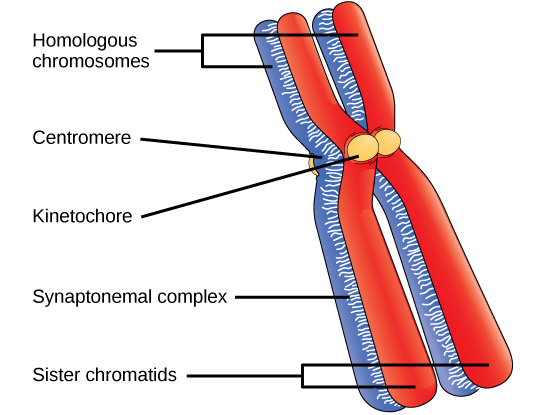
Figure 11.3 Early in prophase I, homologous chromosomes come together to form a synapse. The chromosomes are bound tightly together and in perfect alignment by a protein lattice called a synaptonemal complex and by cohesin proteins at the centromere.
Mary Ann Clark, Matthew Douglas, and Jung Choi, Biology 2E, OpenStax. · CC BY-NC-SA 4.0 · Original image ↗ · Access for free ↗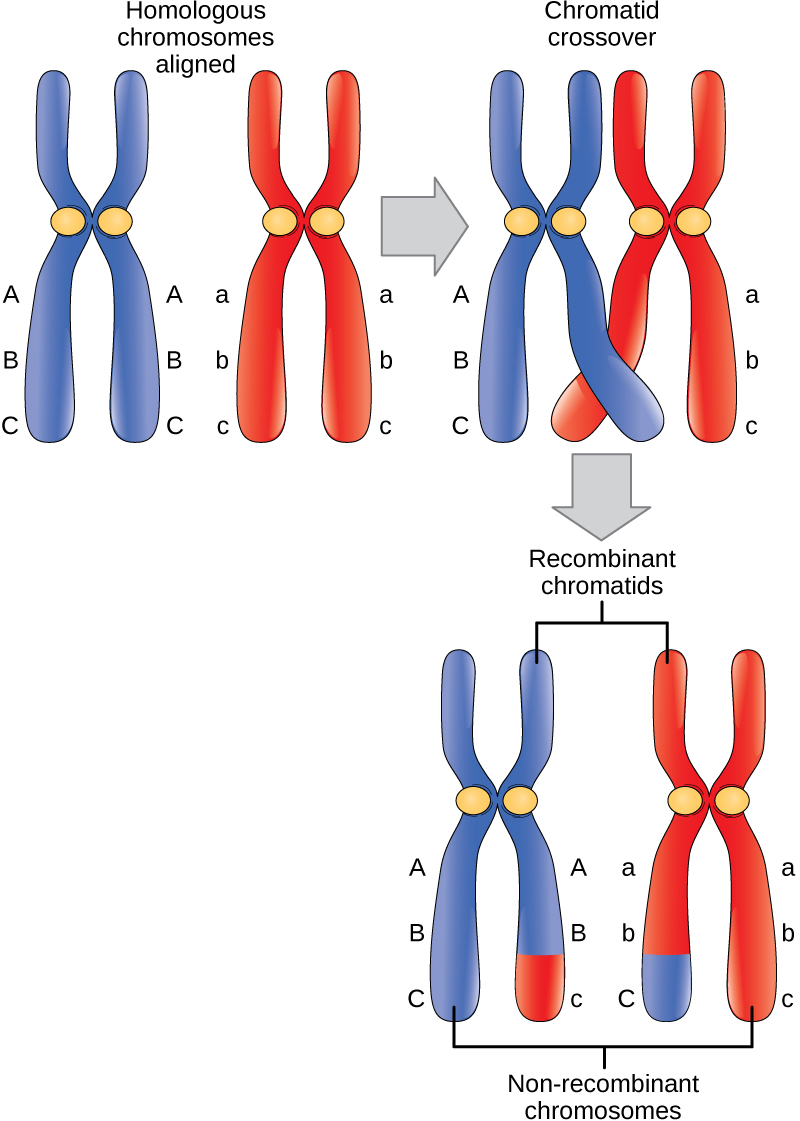
Figure 11.4 Crossover occurs between nonsister chromatids of homologous chromosomes. The result is an exchange of genetic material between homologous chromosomes (for clarity, only one recombination event between two of the four chromatids is represented).
Mary Ann Clark, Matthew Douglas, and Jung Choi, Biology 2E, OpenStax. · CC BY-NC-SA 4.0 · Original image ↗ · Access for free ↗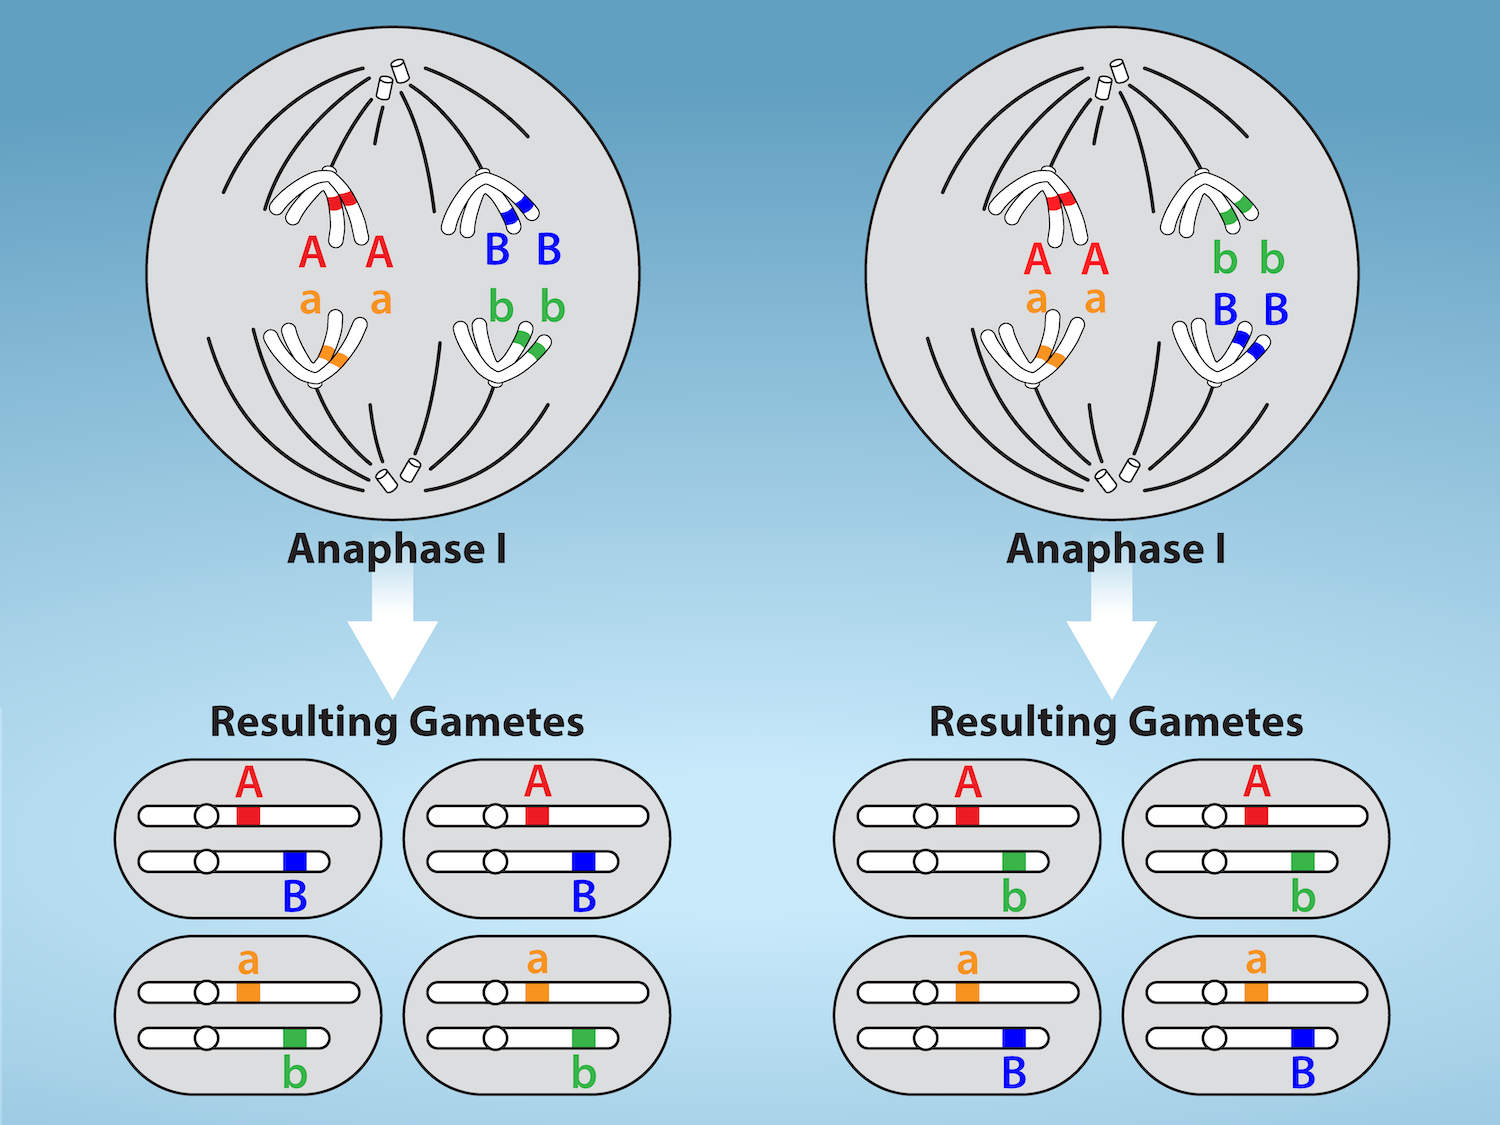
Figure 11.5 Random, independent assortment during metaphase I is demonstrated by considering a cell with a set of two chromosomes (n = 2). There are two possible homologous chromosome arrangements at the equatorial plane in metaphase I, that are then separated during anaphase I. The total possible number of different gametes is 2 n , where n equals the number of chromosomes in a set. In this example, there are four possible genetic combinations for the gametes. With n = 23 in human cells, there are over eight million possible combinations of paternal and maternal chromosomes. Credit: Rao, A.and Fletcher, S. Department of Biology, Texas A&M University.
Mary Ann Clark, Matthew Douglas, and Jung Choi, Biology 2E, OpenStax. · CC BY-NC-SA 4.0 · Original image ↗ · Access for free ↗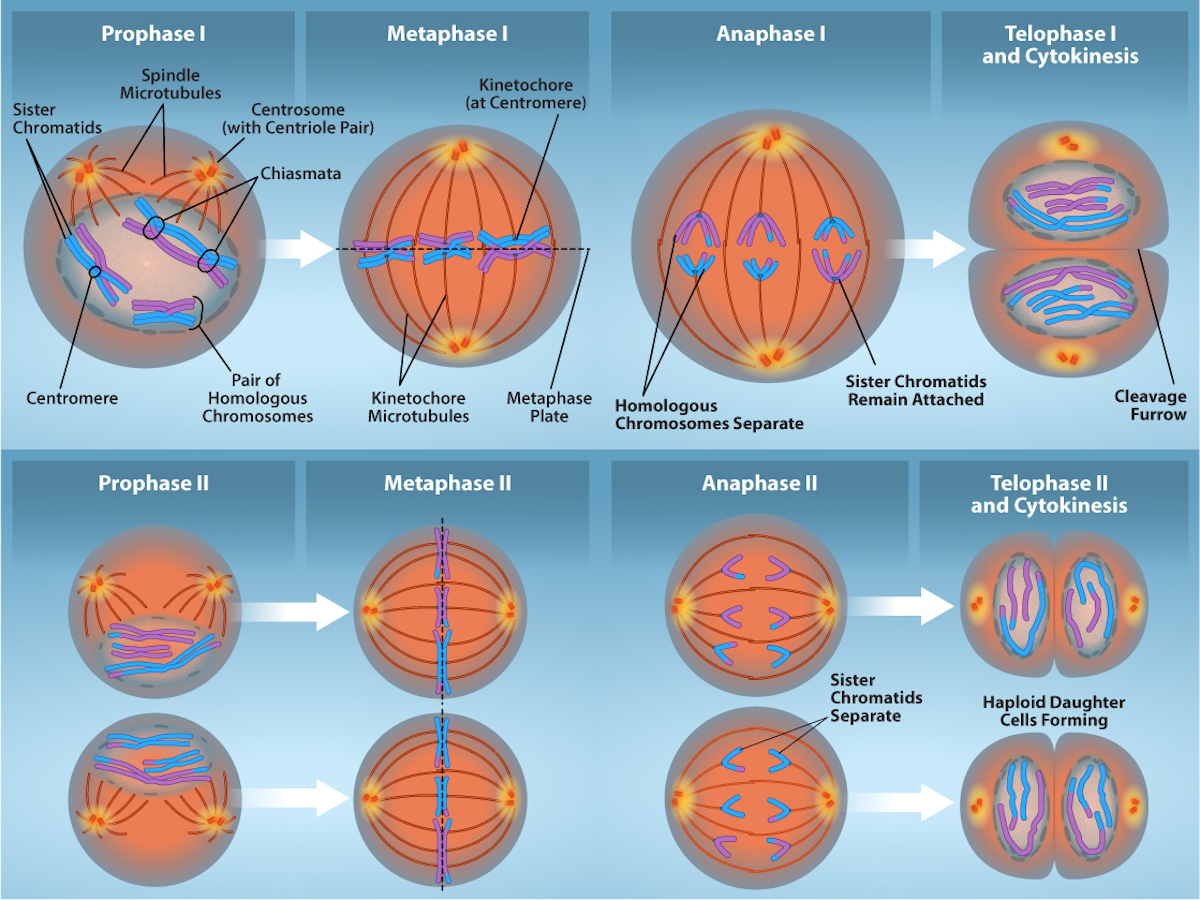
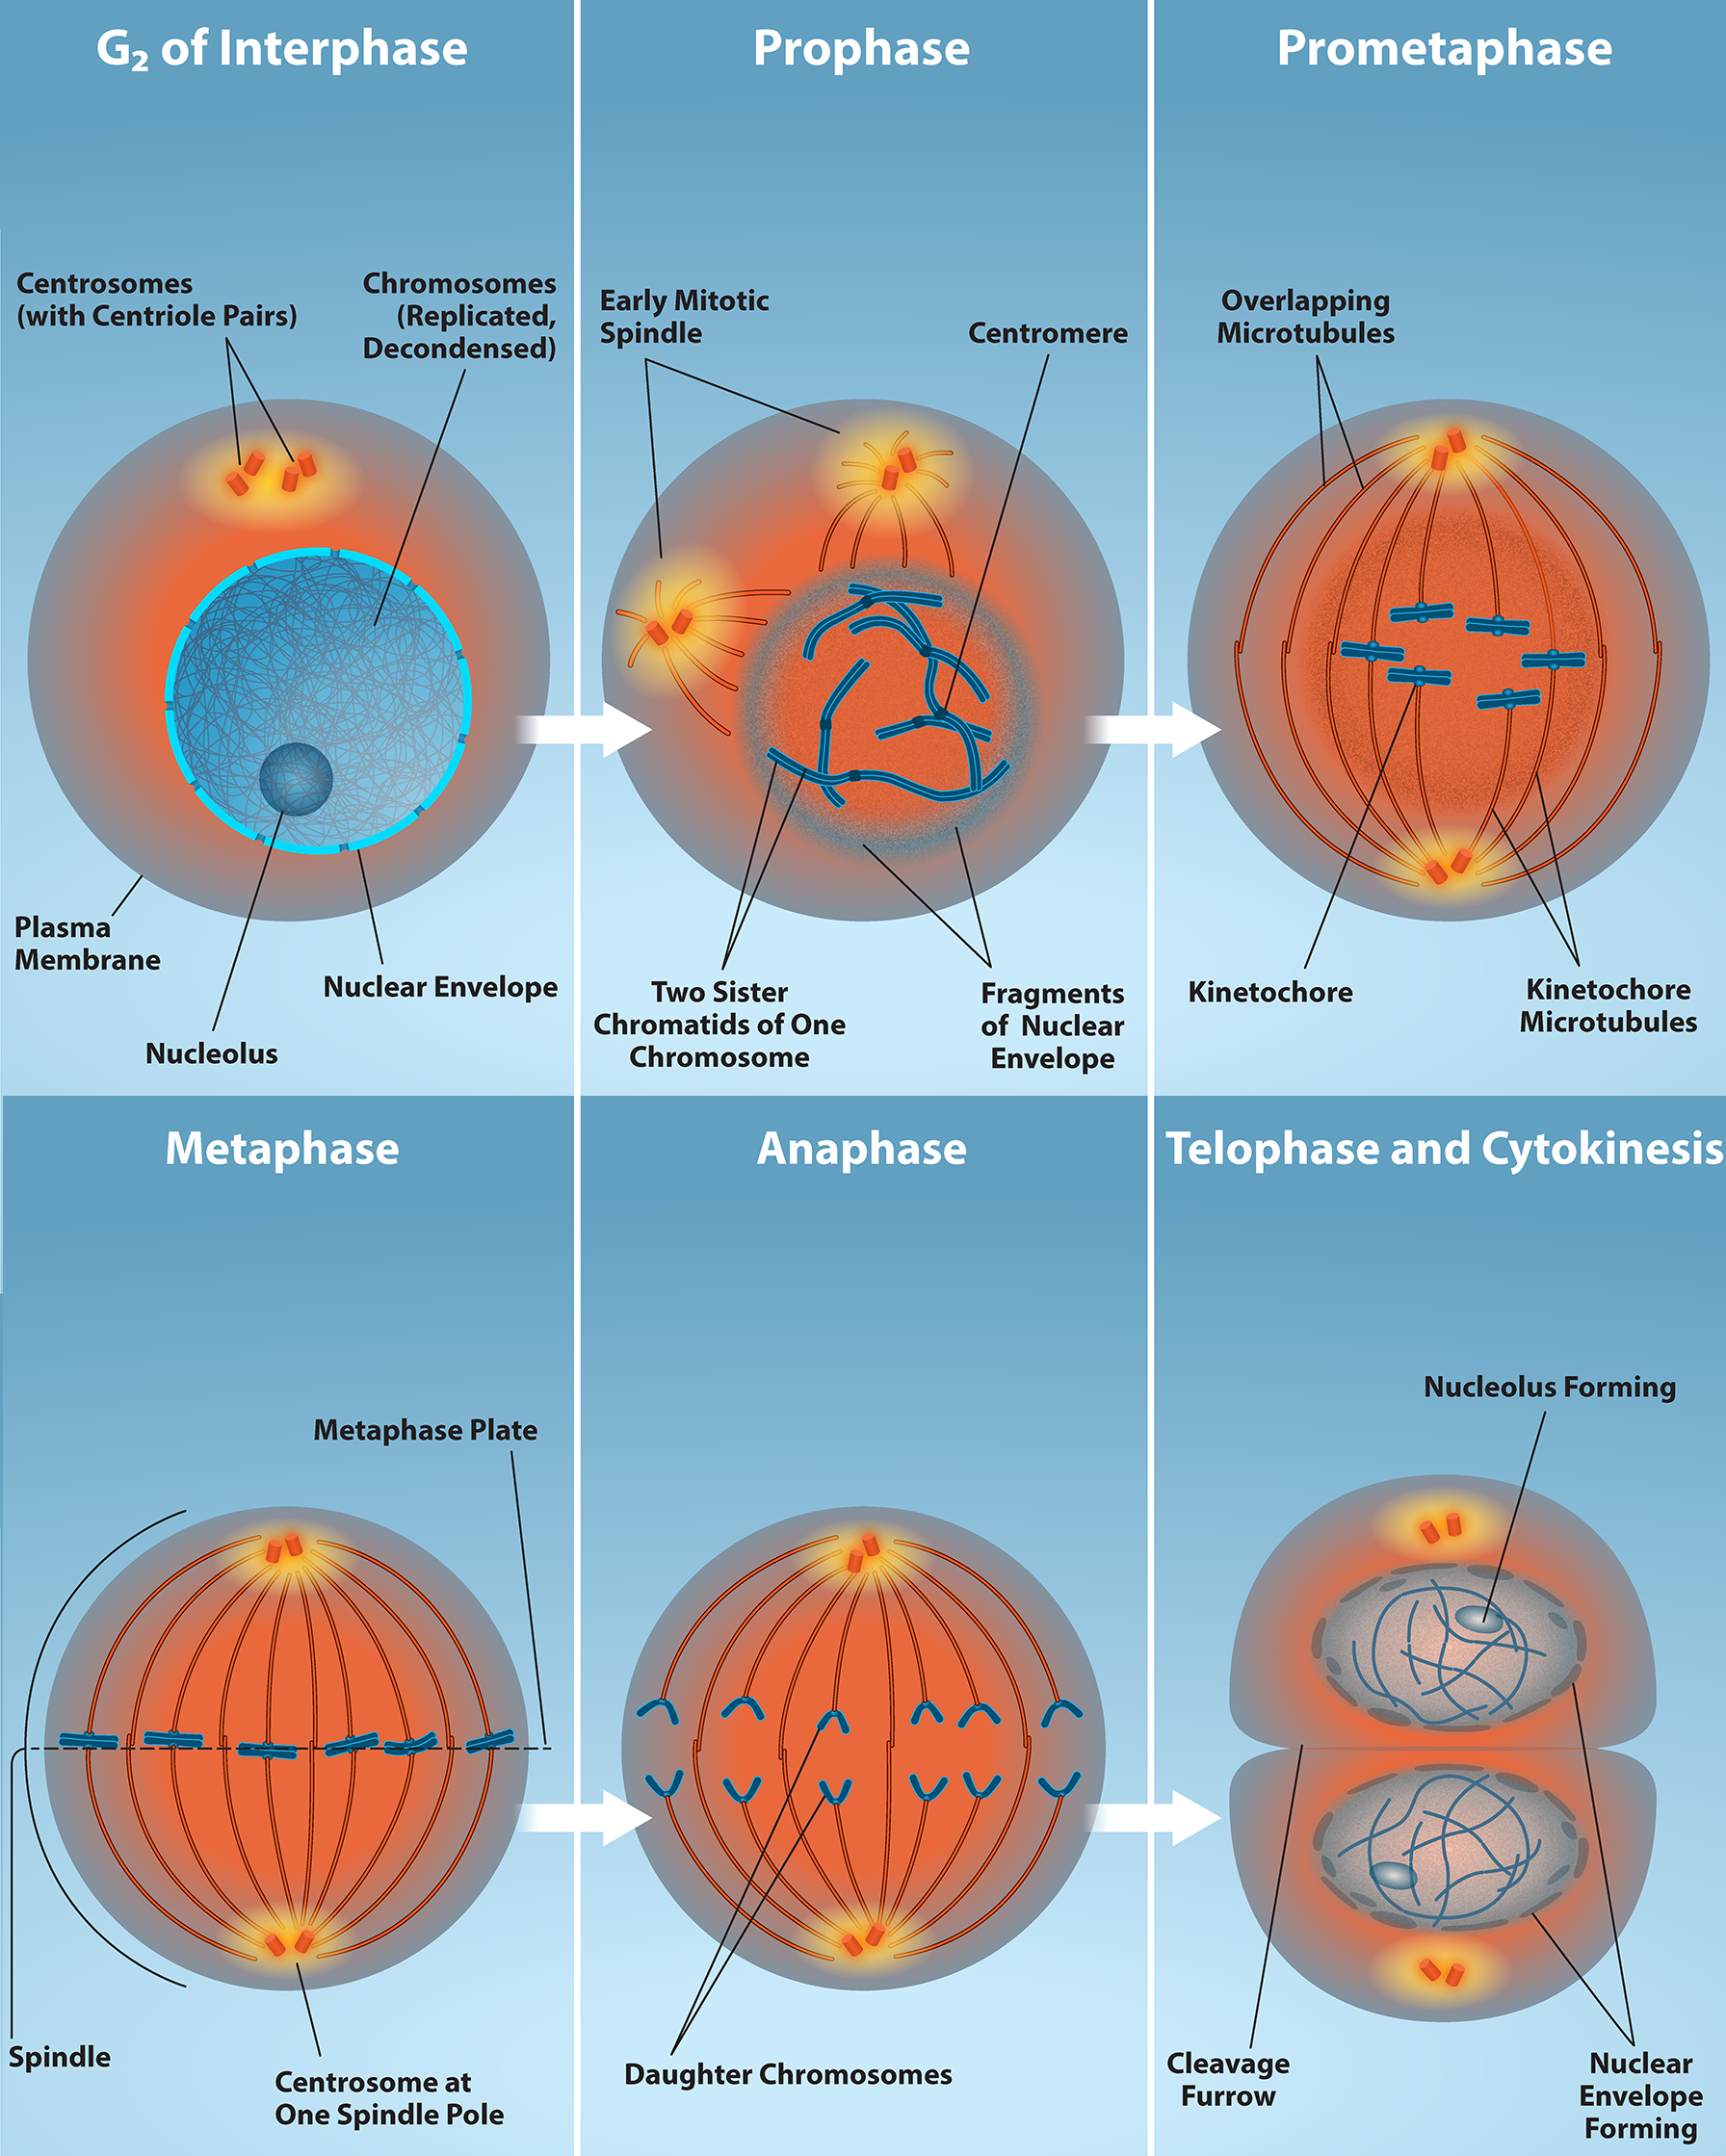
Figure 11.6 The process of chromosome alignment differs between meiosis I and meiosis II. In prophase I, pairs of homologous chromosomes form chiasmata which allow for crossing over events (genetic diversity). These pairs of homologous chromosomes arrange at the metaphase plate in metaphase I. In anaphase I, homologous chromosomes separate. Telophase I and cytokinesis result in haploid cells with 2 sister chromatids of each chromosome. In prophase II, spindle microtubules form and elongate and any nuclear envelope disappears. Sister chromatids arrange at the midpoint of the cells in metaphase II. In anaphase II, the sister chromatids separate. Telophase II and cytokinesis result in haploid cells with a single copy of each chromosome. Credit: Rao, A., Ryan, K., Fletcher, S. and Tag, A. Department of Biology, Texas A&M University.
Mary Ann Clark, Matthew Douglas, and Jung Choi, Biology 2E, OpenStax. · CC BY-NC-SA 4.0 · Original image ↗ · Access for free ↗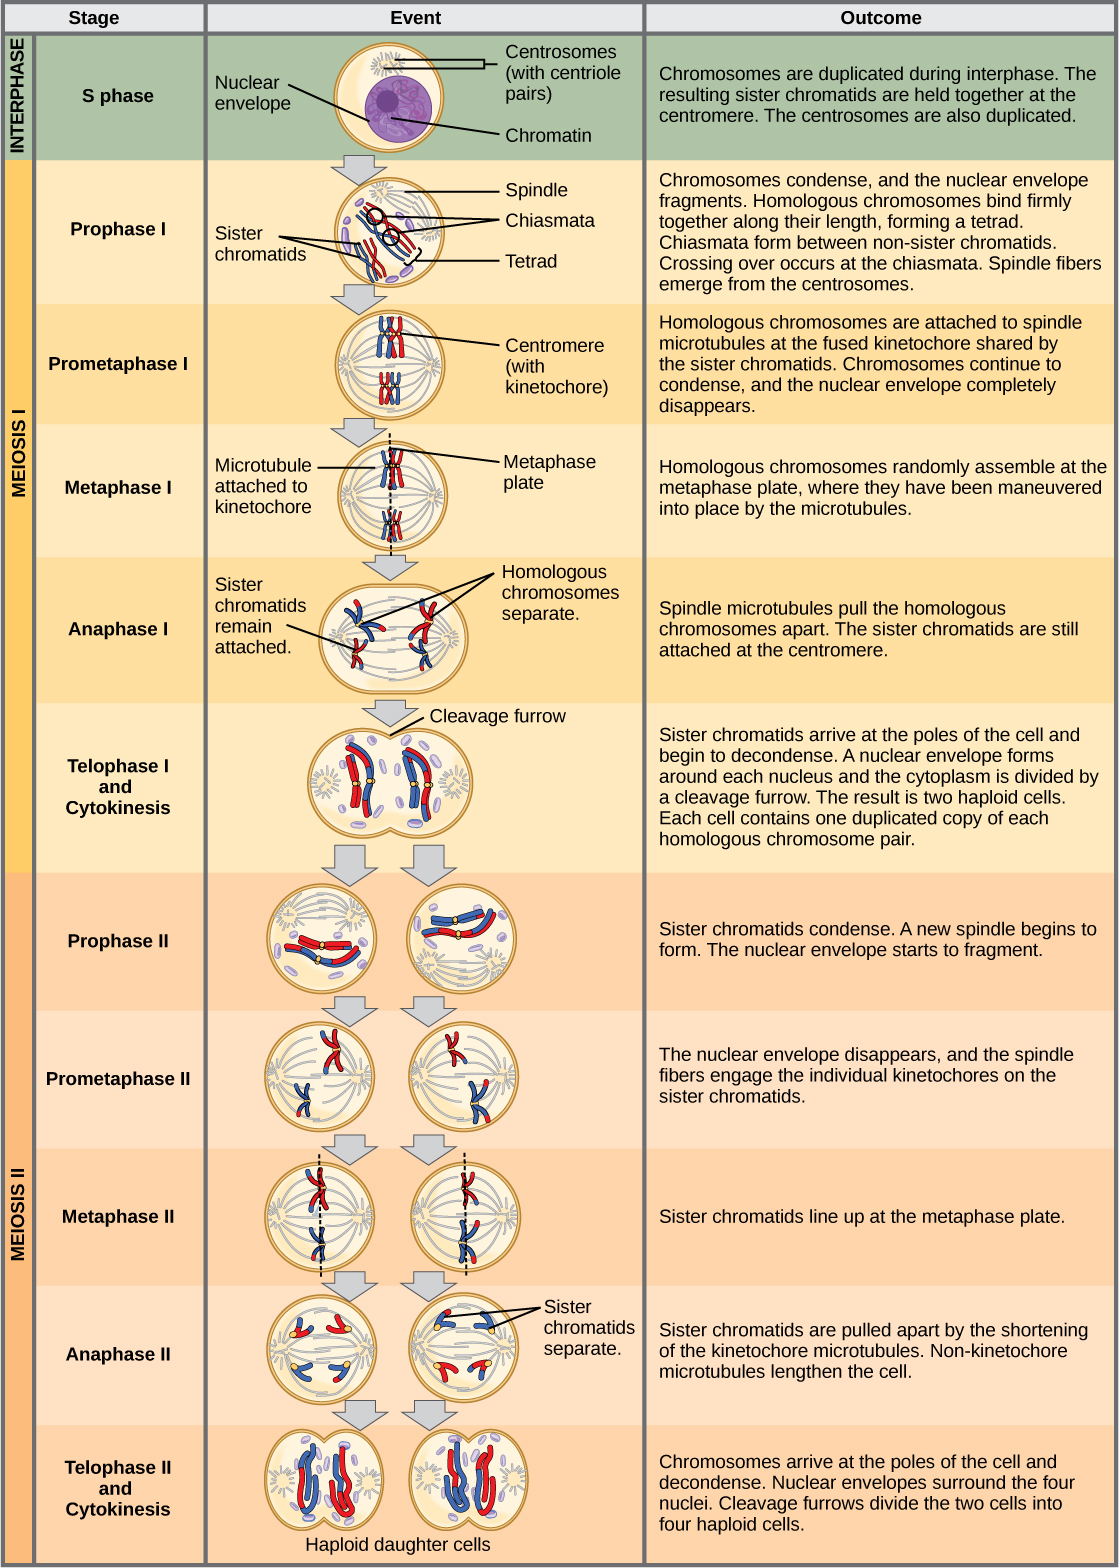
Figure 11.7 An animal cell with a diploid number of four (2 n = 4) proceeds through the stages of meiosis to form four haploid daughter cells.
Mary Ann Clark, Matthew Douglas, and Jung Choi, Biology 2E, OpenStax. · CC BY-NC-SA 4.0 · Original image ↗ · Access for free ↗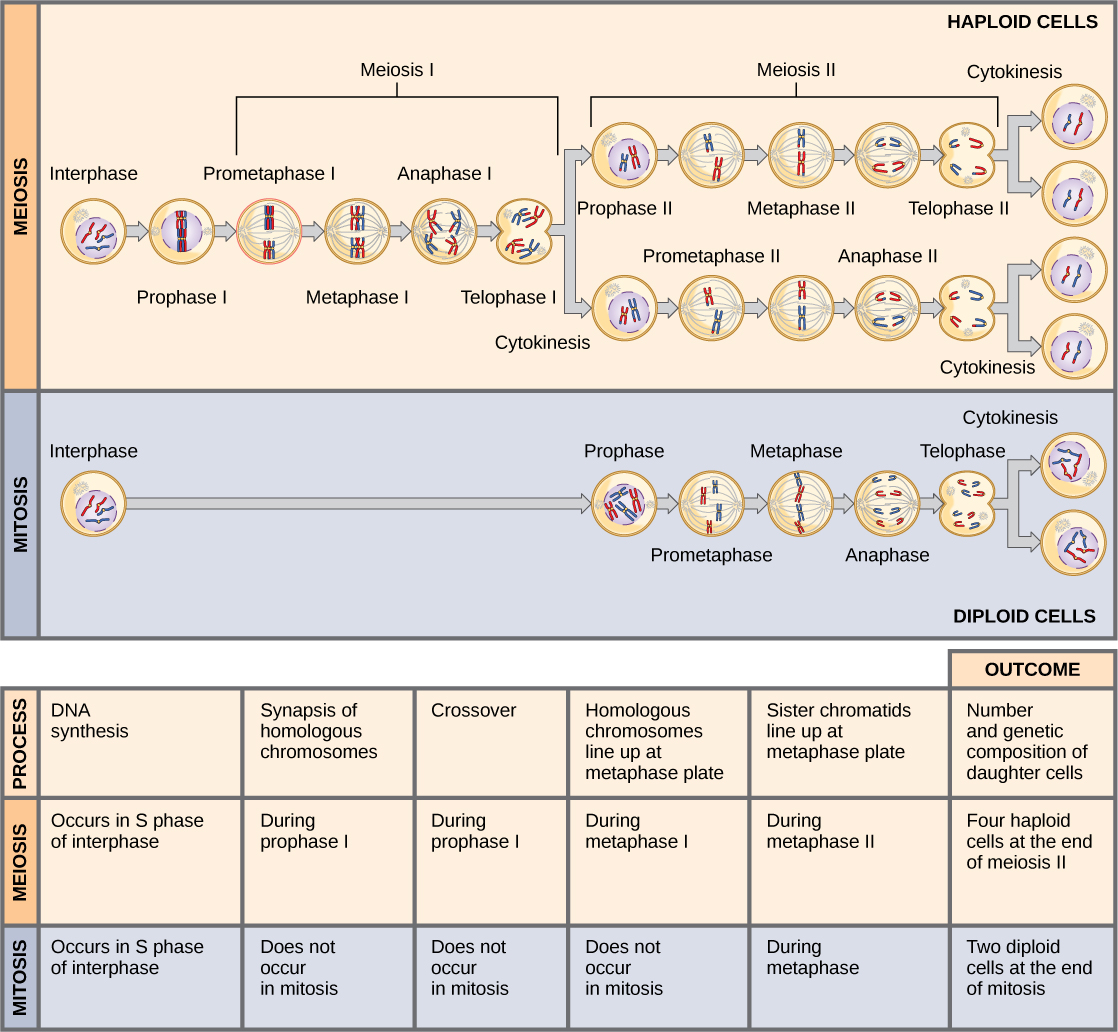
Figure 11.8 Meiosis and mitosis are both preceded by one cycle of DNA replication; however, meiosis includes two nuclear divisions. The four daughter cells resulting from meiosis are haploid and genetically distinct. The daughter cells resulting from mitosis are diploid and identical to the parent cell.
Mary Ann Clark, Matthew Douglas, and Jung Choi, Biology 2E, OpenStax. · CC BY-NC-SA 4.0 · Original image ↗ · Access for free ↗Source: 11.1 The Process of Meiosis
13.1 Chromosomal Theory and Genetic Linkage — figures and tables
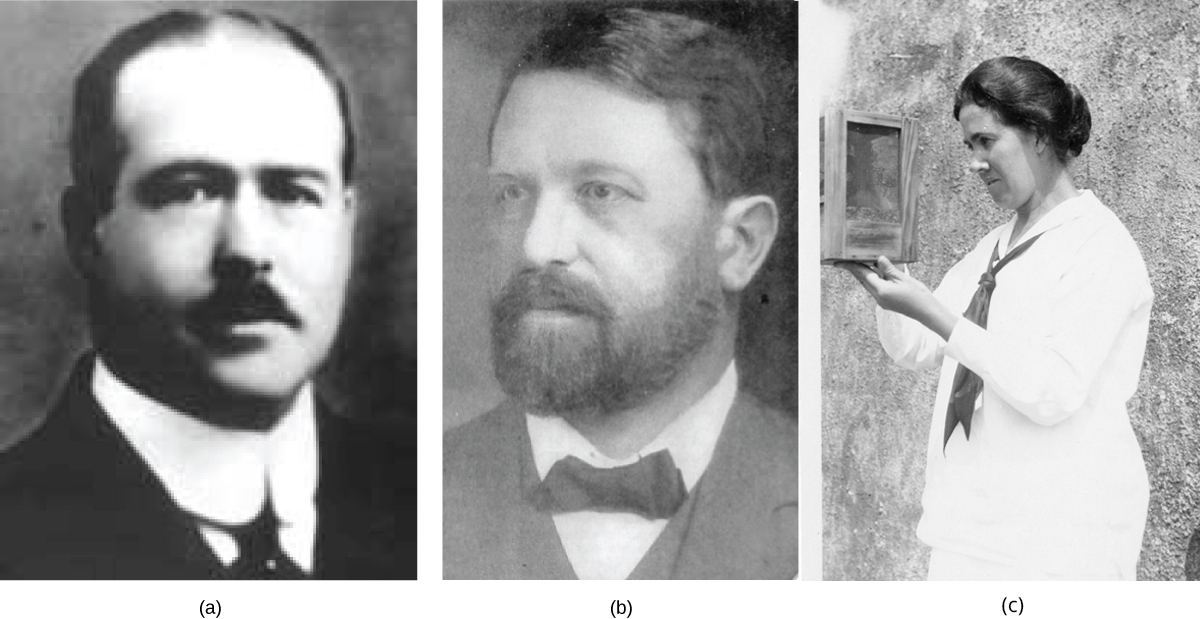
Figure 13.2 (a) Walter Sutton and (b) Theodor Boveri developed the Chromosomal Theory of Inheritance, which states that chromosomes carry the unit of heredity (genes). Eleanor Carothers (c), was the first to provide physical evidence supporting the theory.
Mary Ann Clark, Matthew Douglas, and Jung Choi, Biology 2E, OpenStax. · CC BY-NC-SA 4.0 · Original image ↗ · Access for free ↗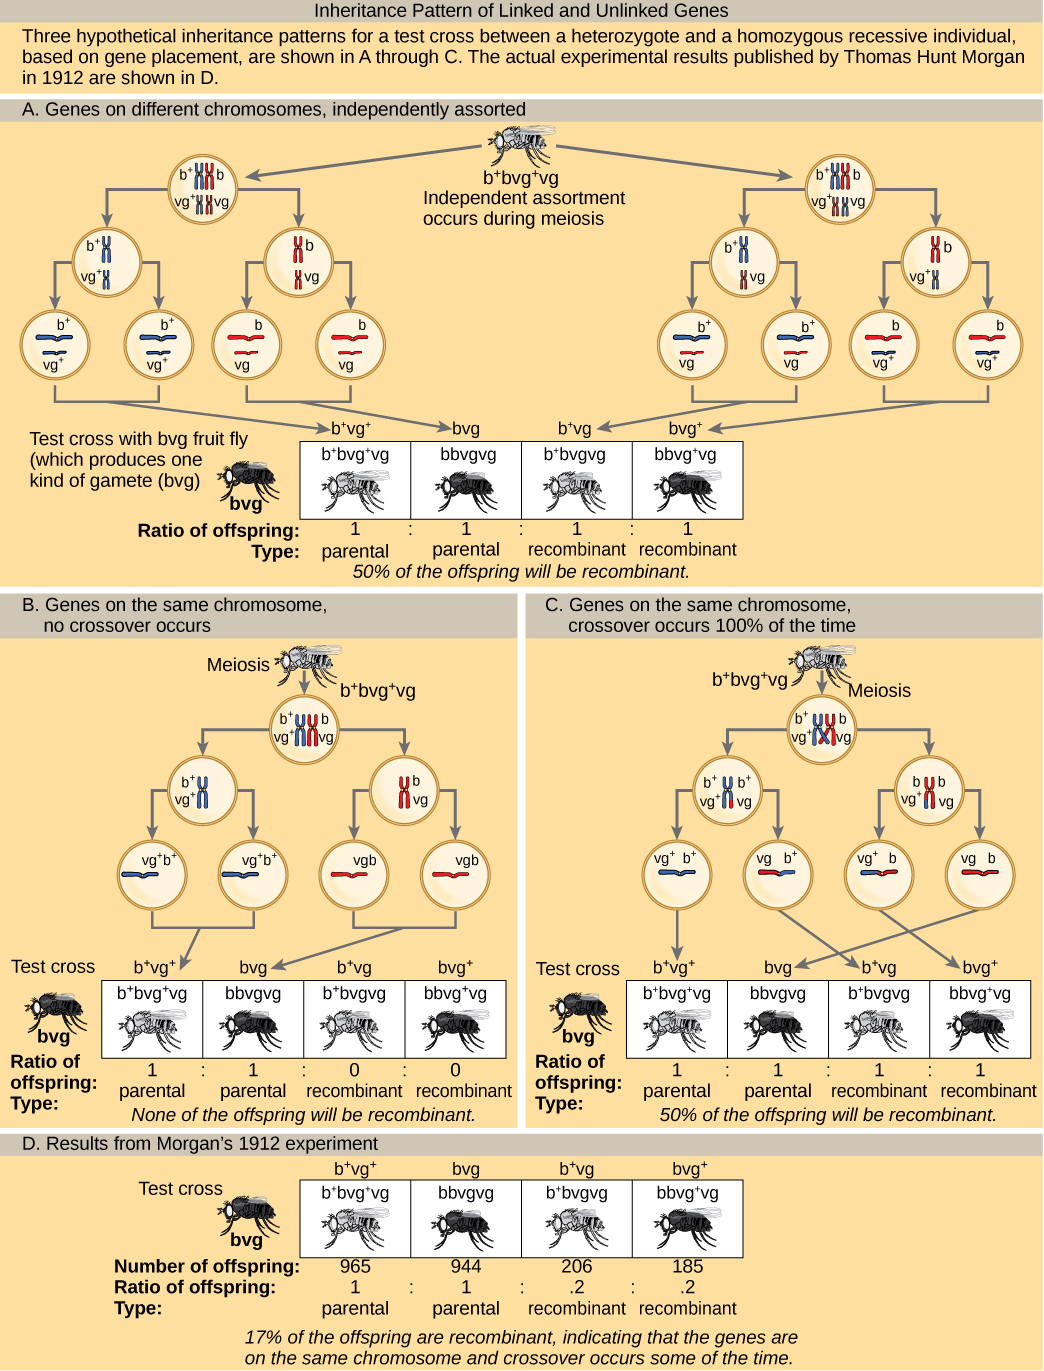
Figure 13.3 This figure shows unlinked and linked gene inheritance patterns. The example used includes fruit fly body color and wing length. Fruit flies may have a dominant gray color `b` + , or a recessive black color `b`. They may have dominant long wings vg + , or recessive short wings, vg. In (a), two genes are located on different chromosomes so independent assortment occurs during meiosis. The offspring have an equal chance of being the parental type (inheriting the same combination of traits as the parents) or a nonparental type (inheriting a different combination of traits than the parents). In (b), two genes are very close together on the same chromosome so that no crossing over occurs between them. Therefore, the genes are always inherited together and all the offspring are the parental type. In (c), two genes are far apart on the chromosome such that crossing over occurs during every meiotic event. The recombination frequency will be the same as if the genes were on separate chromosomes. (d) The actual recombination frequency of fruit fly wing length and body color that Thomas Morgan observed in 1912 was 17 percent. A crossover frequency between 0 percent and 50 percent indicates that the genes are on the same chromosome and crossover sometimes occurs.
Mary Ann Clark, Matthew Douglas, and Jung Choi, Biology 2E, OpenStax. · CC BY-NC-SA 4.0 · Original image ↗ · Access for free ↗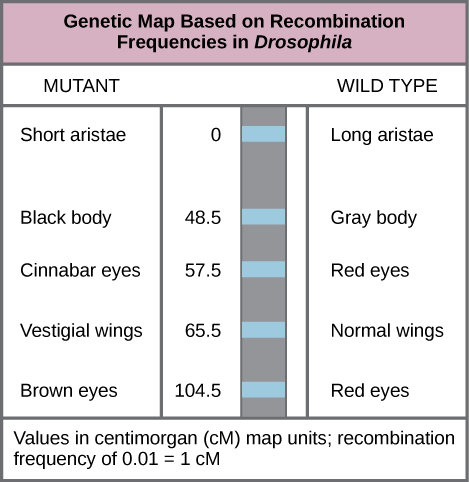
Figure 13.4 This genetic map orders Drosophila genes on the basis of recombination frequency.
Mary Ann Clark, Matthew Douglas, and Jung Choi, Biology 2E, OpenStax. · CC BY-NC-SA 4.0 · Original image ↗ · Access for free ↗12.2 Characteristics and Traits — figures and tables
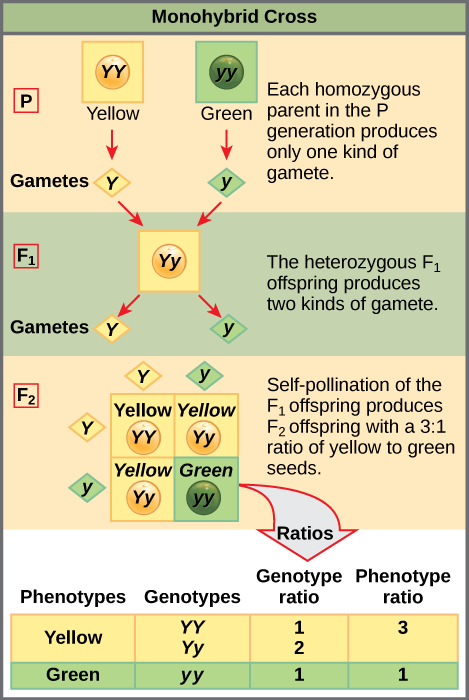
Figure 12.4 In the P generation, pea plants that are true-breeding for the dominant yellow phenotype are crossed with plants with the recessive green phenotype. This cross produces F 1 heterozygotes with a yellow phenotype. Punnett square analysis can be used to predict the genotypes of the F 2 generation.
Mary Ann Clark, Matthew Douglas, and Jung Choi, Biology 2E, OpenStax. · CC BY-NC-SA 4.0 · Original image ↗ · Access for free ↗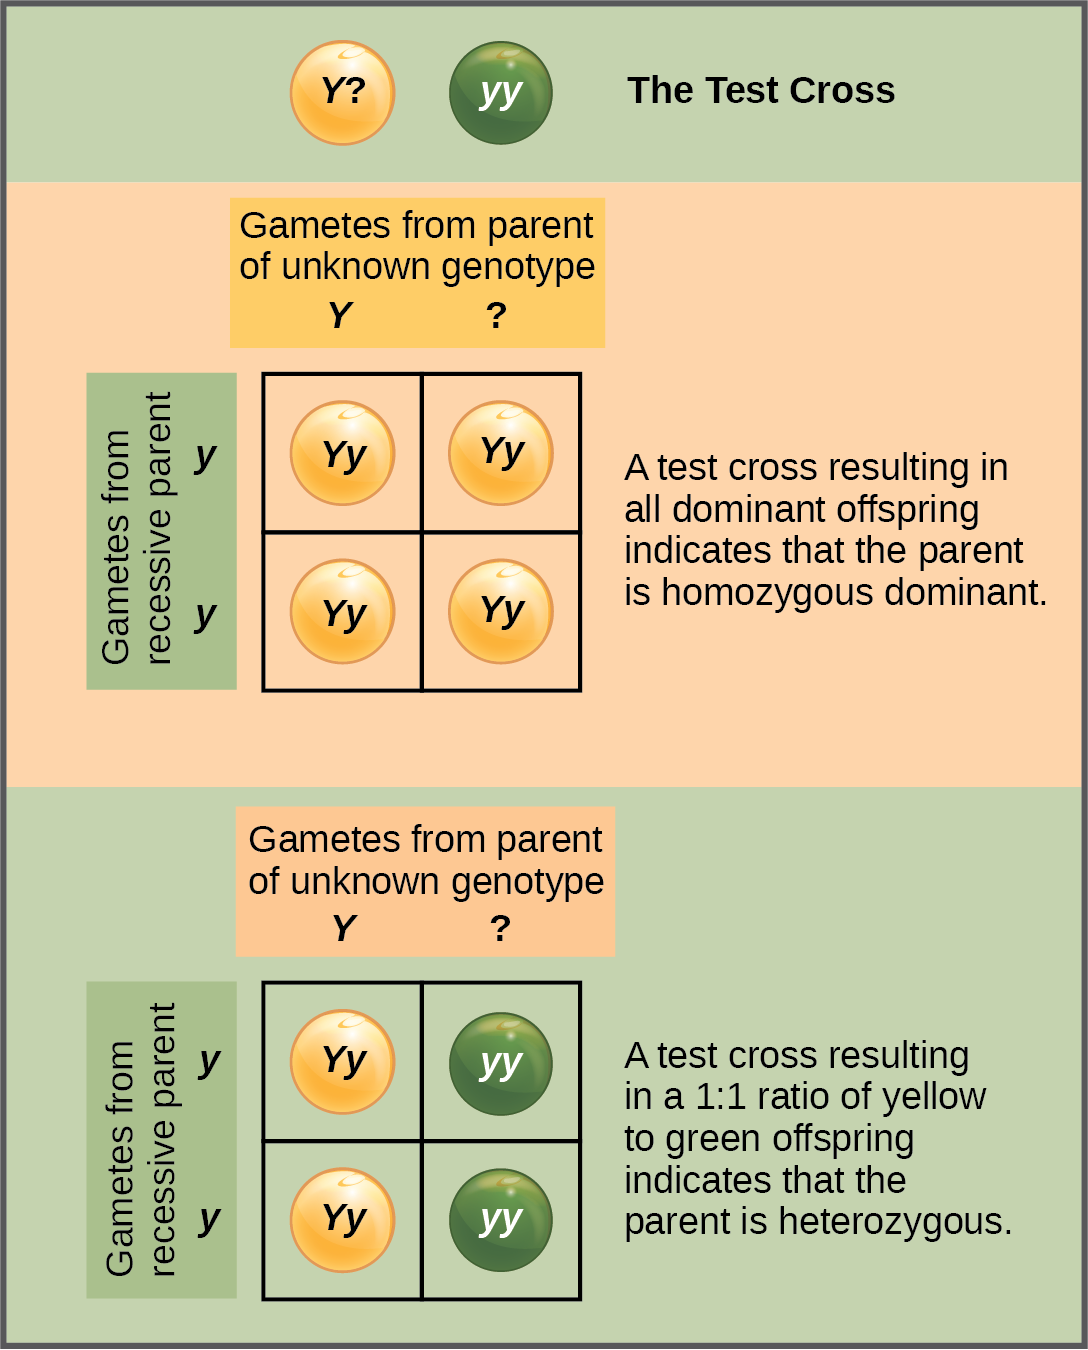
Figure 12.5 A test cross can be performed to determine whether an organism expressing a dominant trait is a homozygote or a heterozygote.
Mary Ann Clark, Matthew Douglas, and Jung Choi, Biology 2E, OpenStax. · CC BY-NC-SA 4.0 · Original image ↗ · Access for free ↗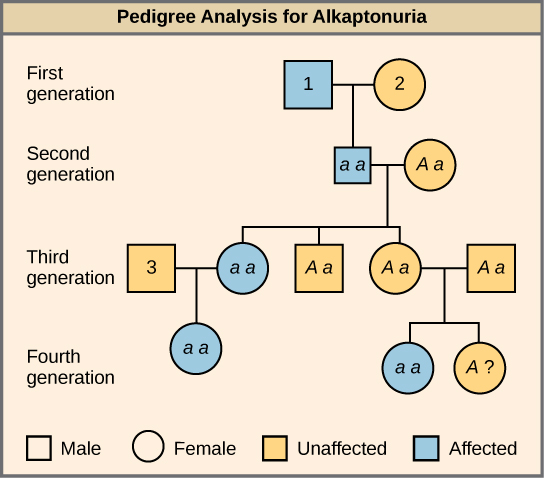
Figure 12.6 Alkaptonuria is a recessive genetic disorder in which two amino acids, phenylalanine and tyrosine, are not properly metabolized. Affected individuals may have darkened skin and brown urine, and may suffer joint damage and other complications. In this pedigree, individuals with the disorder are indicated in blue and have the genotype aa . Unaffected individuals are indicated in yellow and have the genotype AA or Aa . Note that it is often possible to determine a person’s genotype from the genotype of their offspring. For example, if neither parent has the disorder but their child does, they must be heterozygous. Two individuals on the pedigree have an unaffected phenotype but unknown genotype. Because they do not have the disorder, they must have at least one normal allele, so their genotype gets the “ A? ” designation.
Mary Ann Clark, Matthew Douglas, and Jung Choi, Biology 2E, OpenStax. · CC BY-NC-SA 4.0 · Original image ↗ · Access for free ↗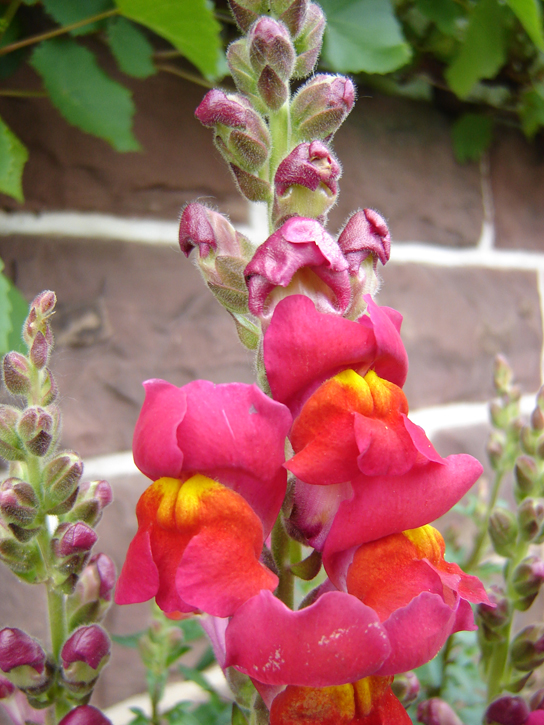
Figure 12.7 These pink flowers of a heterozygote snapdragon result from incomplete dominance. (credit: “storebukkebruse”/Flickr)
Mary Ann Clark, Matthew Douglas, and Jung Choi, Biology 2E, OpenStax. (credit: “storebukkebruse”/Flickr) · CC BY-NC-SA 4.0 · Original image ↗ · Access for free ↗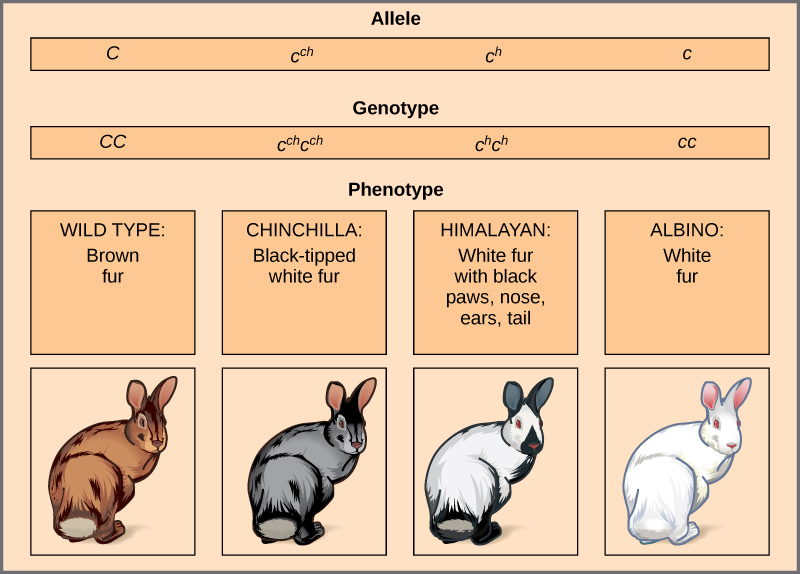
Figure 12.8 Four different alleles exist for the rabbit coat color ( C ) gene.
Mary Ann Clark, Matthew Douglas, and Jung Choi, Biology 2E, OpenStax. · CC BY-NC-SA 4.0 · Original image ↗ · Access for free ↗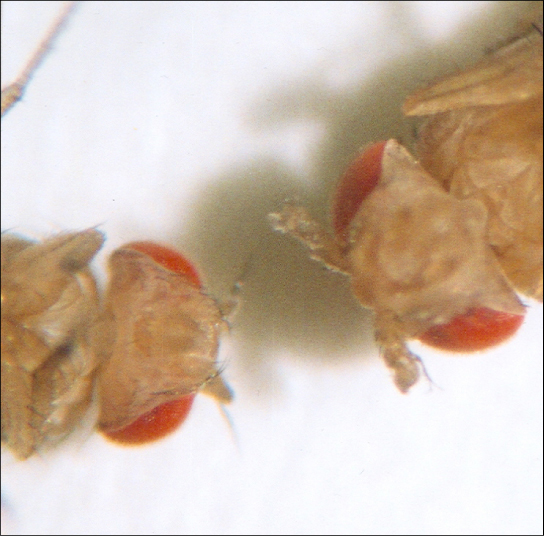
Figure 12.9 As seen in comparing the wild-type Drosophila (left) and the Antennapedia mutant (right), the Antennapedia mutant has legs on its head in place of antennae.
Mary Ann Clark, Matthew Douglas, and Jung Choi, Biology 2E, OpenStax. · CC BY-NC-SA 4.0 · Original image ↗ · Access for free ↗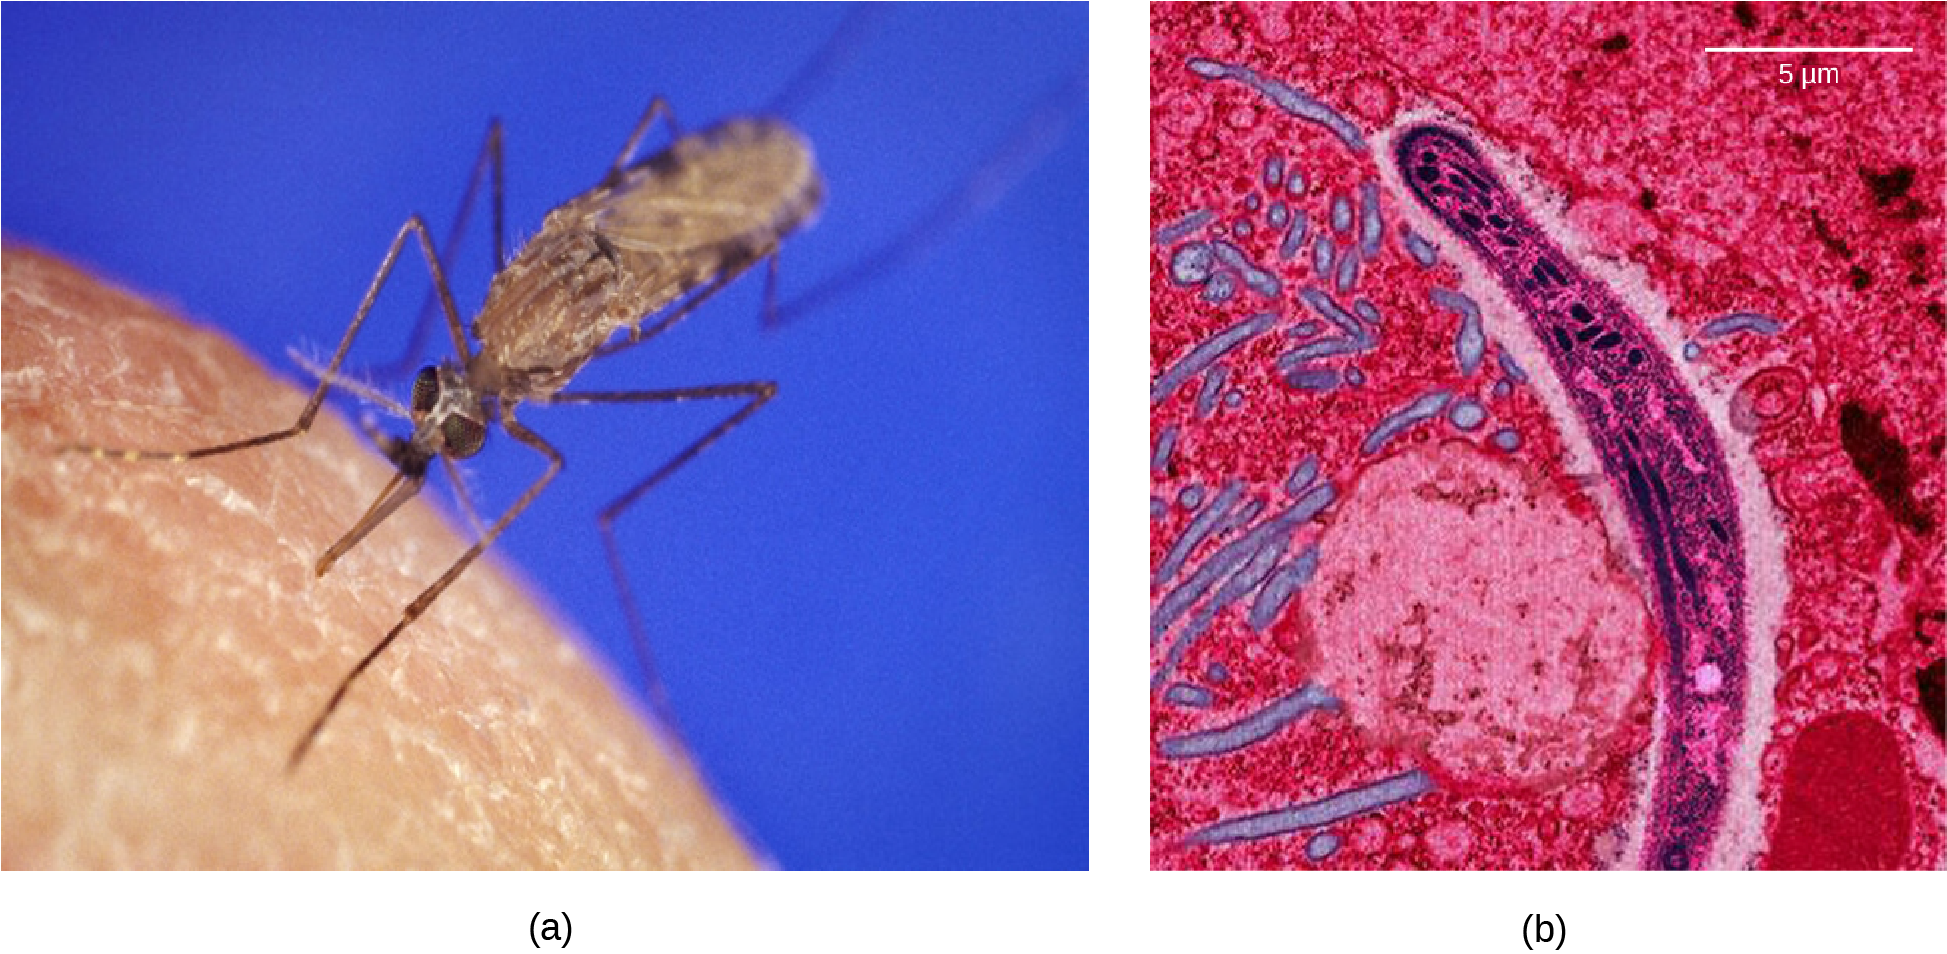
Figure 12.10 The (a) Anopheles gambiae , or African malaria mosquito, acts as a vector in the transmission to humans of the malaria-causing parasite (b) Plasmodium falciparum , here visualized using false-color transmission electron microscopy. (credit a: James D. Gathany; credit b: Ute Frevert; false color by Margaret Shear; scale-bar data from Matt Russell)
Mary Ann Clark, Matthew Douglas, and Jung Choi, Biology 2E, OpenStax. (credit a: James D. Gathany; credit b: Ute Frevert; false color by Margaret Shear; scale-bar data from Matt Russell) · CC BY-NC-SA 4.0 · Original image ↗ · Access for free ↗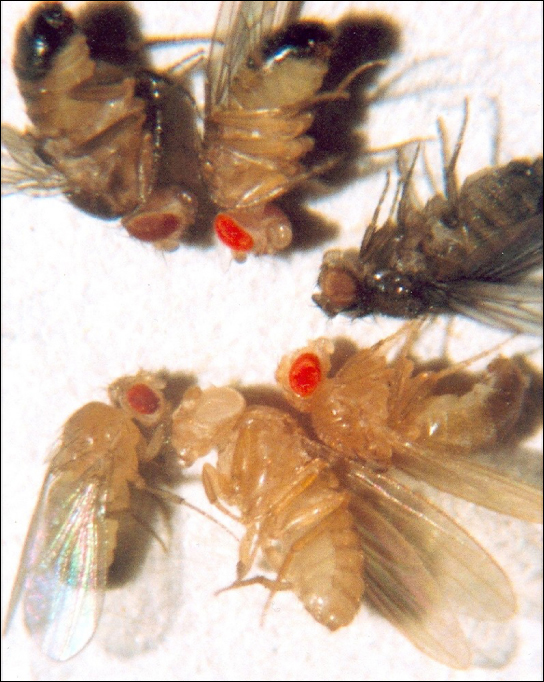
Figure 12.11 In Drosophila , several genes determine eye color. The genes for white and vermilion eye colors are located on the X chromosome. Others are located on the autosomes. Clockwise from top left are brown, cinnabar, sepia, vermilion, white, and red. Red eye color is wild-type and is dominant to white eye color.
Mary Ann Clark, Matthew Douglas, and Jung Choi, Biology 2E, OpenStax. · CC BY-NC-SA 4.0 · Original image ↗ · Access for free ↗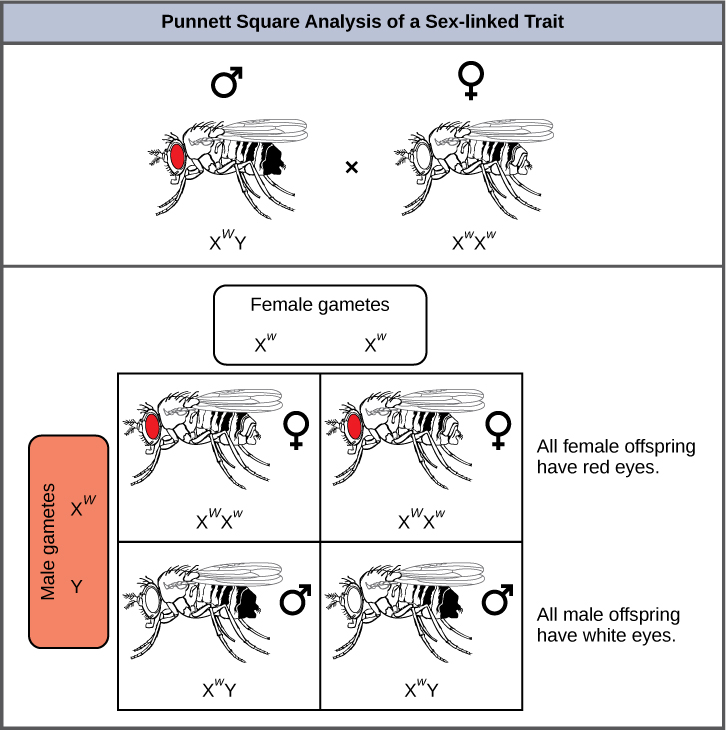
Figure 12.12 Punnett square analysis is used to determine the ratio of offspring from a cross between a red-eyed male fruit fly and a white-eyed female fruit fly.
Mary Ann Clark, Matthew Douglas, and Jung Choi, Biology 2E, OpenStax. · CC BY-NC-SA 4.0 · Original image ↗ · Access for free ↗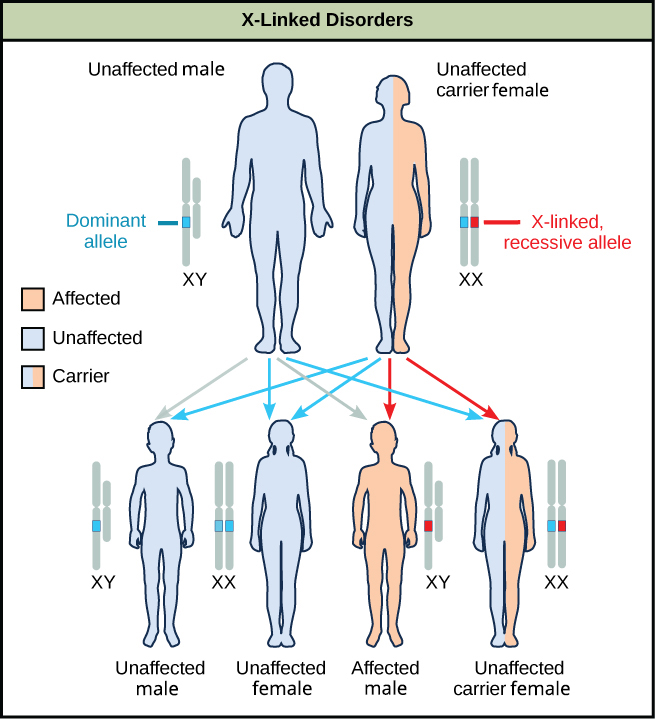
Figure 12.13 The male offspring of a person who is a carrier of a recessive X-linked disorder will have a 50 percent chance of being affected. A female will not be affected, but she will have a 50 percent chance of being a carrier like the female parent.
Mary Ann Clark, Matthew Douglas, and Jung Choi, Biology 2E, OpenStax. · CC BY-NC-SA 4.0 · Original image ↗ · Access for free ↗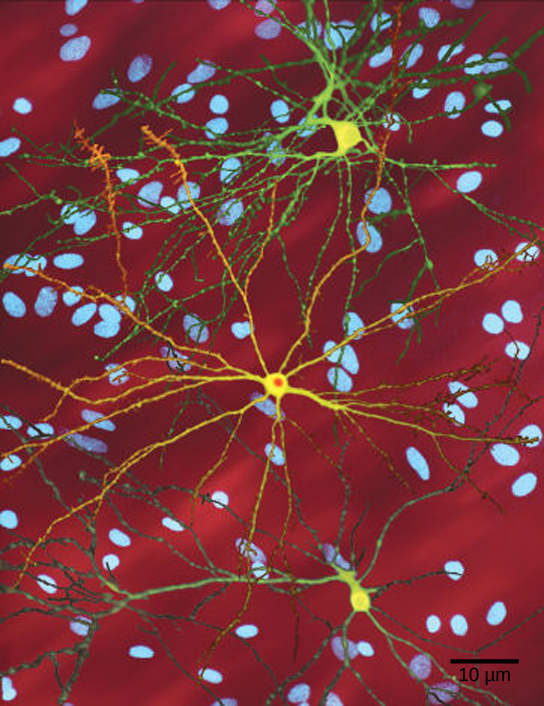
Figure 12.14 The neuron in the center of this micrograph (yellow) has nuclear inclusions characteristic of Huntington’s disease (orange area in the center of the neuron). Huntington’s disease occurs when an abnormal dominant allele for the Huntington gene is present. (credit: Dr. Steven Finkbeiner, Gladstone Institute of Neurological Disease, The Taube-Koret Center for Huntington's Disease Research, and the University of California San Francisco/Wikimedia)
Mary Ann Clark, Matthew Douglas, and Jung Choi, Biology 2E, OpenStax. (credit: Dr. Steven Finkbeiner, Gladstone Institute of Neurological Disease, The Taube-Koret Center for Huntington's Disease Research, and the University of California San Francisco/Wikimedia) · CC BY-NC-SA 4.0 · Original image ↗ · Access for free ↗| Dominant Traits | Recessive Traits |
|---|---|
| Achondroplasia | Albinism |
| Brachydactyly | Cystic fibrosis |
| Huntington’s disease | Duchenne muscular dystrophy |
| Marfan syndrome | Galactosemia |
| Neurofibromatosis | Phenylketonuria |
| Widow’s peak | Sickle-cell anemia |
| Wooly hair | Tay-Sachs disease |
Table 12.4. Mary Ann Clark, Matthew Douglas, and Jung Choi, Biology 2E, OpenStax.
Source: 12.2 Characteristics and Traits