Intergenerational mobility compares children’s position with their parents’; intragenerational mobility tracks change during one person’s life. Vertical mobility changes rank, while horizontal mobility changes position without a major rank shift. Structural mobility arises when the distribution of jobs or resources changes, allowing many people to move even without altered relative competition. Absolute mobility asks whether living standards or income improved; relative mobility asks how strongly rank depends on origin. Meritocracy claims rewards follow talent and effort, but unequal schooling, wealth, networks, and discrimination can affect both opportunity and measured achievement. Mobility in one generation does not establish equal opportunity for everyone.
Absolute poverty concerns inability to meet a specified basic-needs standard; relative poverty concerns resources substantially below the surrounding society’s usual level. Thresholds operationalize these concepts and depend on measurement choices, household size, and costs. Poverty can be persistent or episodic and includes material insecurity beyond current income. Segregation can restrict access to jobs, schools, services, and diverse networks; social isolation reduces connections, while social exclusion limits participation in institutions and community life. These processes can reinforce one another but are not identical. A person may have many close ties yet remain excluded from employment or political influence.
Worked question. A child earns more in inflation-adjusted income than their parents but remains at the same percentile because incomes rose broadly. Has mobility occurred?
There is absolute intergenerational improvement without relative rank mobility. If the person later moves from a lower-paid to a higher-paid position during adulthood, that is intragenerational vertical mobility. The distinction prevents a rise in average living standards from being mistaken for reduced dependence of social rank on family origin.
Figure 9.7 Does taste or fashion sense indicate class? Is there any way to tell if these people come from an upper-, middle-, or lower-class background? (Credit: Kelly Bailey/flickr)
Figure 9.8 Members of the upper class can afford to live, work, and play in exclusive places, such as country clubs and gated communities, designed for luxury, safety, and comfort. (Credit: PrimeImageMedia.com/flickr)
Figure 9.10 Bike messengers and bike delivery people are often considered members of the working class. They endure difficult and dangerous conditions to do their work, and they are not always well represented by government agencies and in regulations designed for safety or fairness. (Credit: edwardhblake/flickr)
Figure 10.8 For children who have homes in slums like this one in Phnom Phen, Cambodia, survival and safety are often the primary and immediate concerns. Longer-term goals, such as education and social mobility, may not be available options. (Credit: ND Strupler)
Figure 10.10 For this child, who is being assessed for malnutrition at a clinic in Kenya, risks associated with poverty and lack of food were exacerbated by a massive drought that hit the region. (Credit: DFID - UK Department for International Development/flickr)
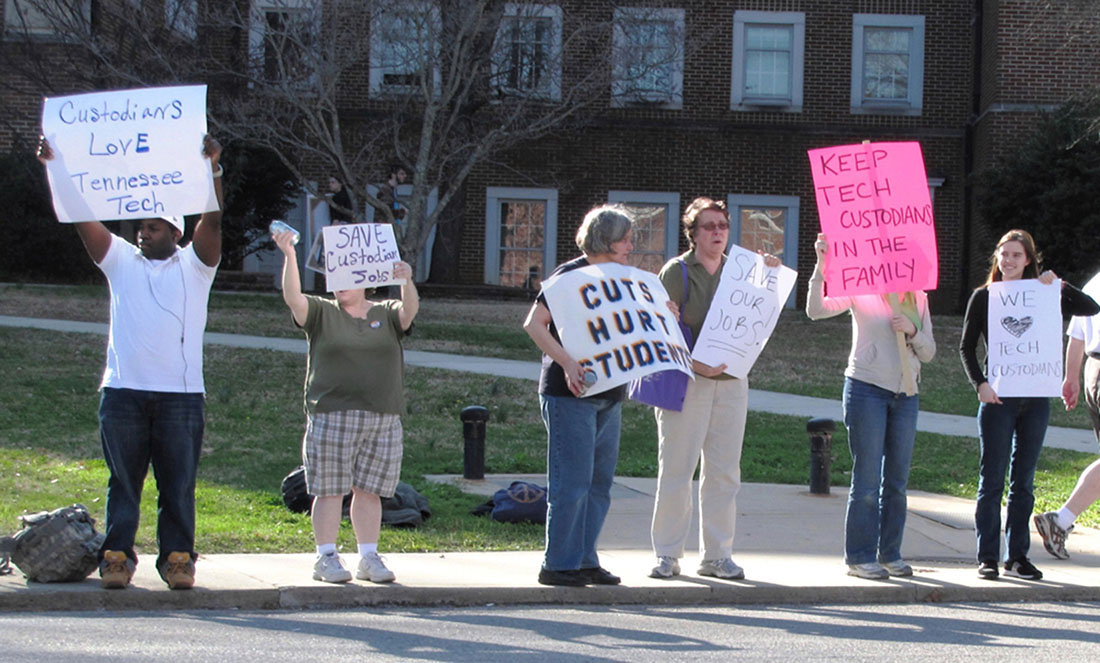
Figure 9.13 These people are protesting a decision made by Tennessee Technological University in Cookeville, Tennessee, to lay off custodians and outsource the jobs to a private firm to avoid paying employee benefits. Private job agencies often pay lower hourly wages. Is the decision fair? (Credit: Brian Stansberry/Wikimedia Commons)
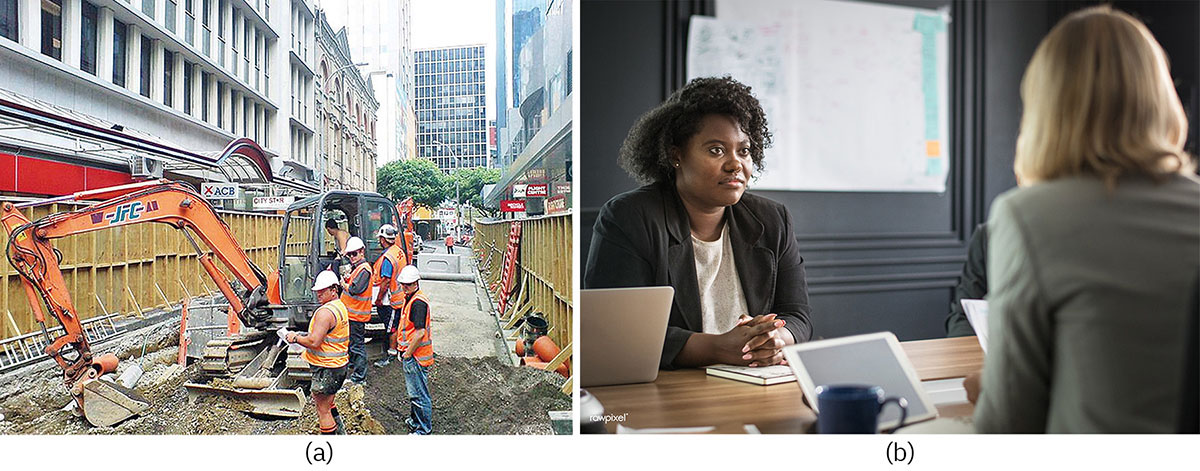
Figure 9.14 (a) A group of construction workers on the job site, and (b) businesspeople in a meeting. What categories of stratification do these construction workers share? How do construction workers differ from executives or custodians? Who is more skilled? Who has greater prestige in society? (Credit: (a) Wikimedia Commons; Photo (b) Chun Kit/flickr)
11.4 Intergroup Relationships — figures and tables
Figure 11.6 — 11.4 Intergroup Relationships
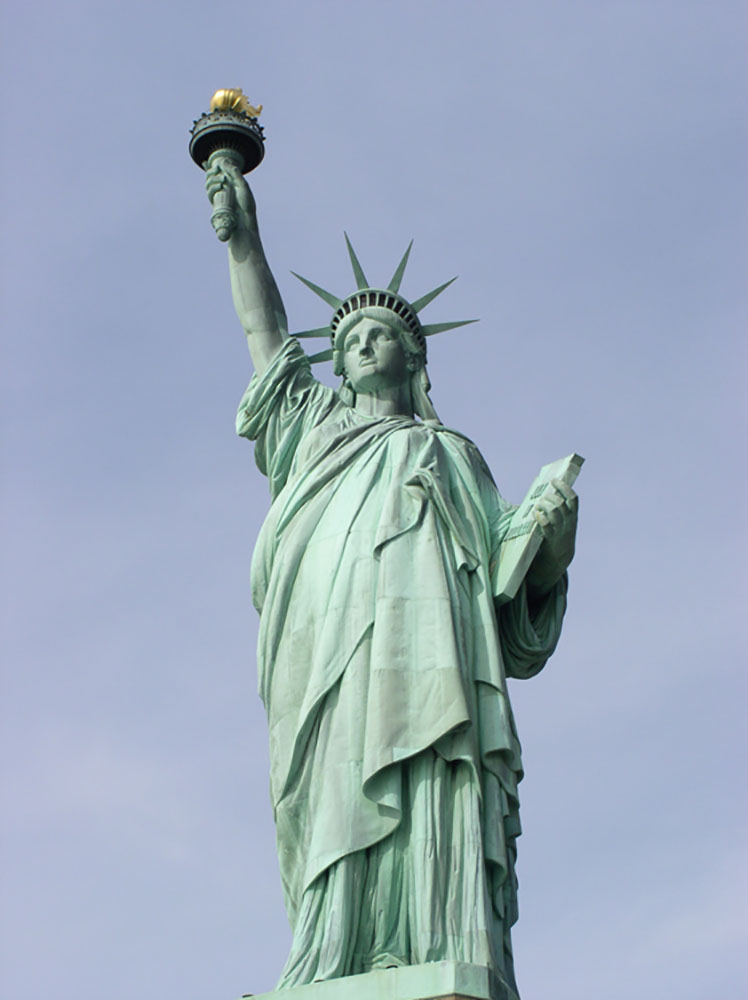
Figure 11.6 For many immigrants to the United States, the Statue of Liberty is a symbol of freedom and a new life. Unfortunately, they often encounter prejudice and discrimination. (Credit: Mark Heard/flickr)
Tonja R. Conerly, Kathleen Holmes, and Asha Lal Tamang, Introduction Sociology 3E, OpenStax. · CC BY-NC-SA 4.0
· Original image ↗ · Access for free ↗Figure 11.7 — 11.4 Intergroup Relationships
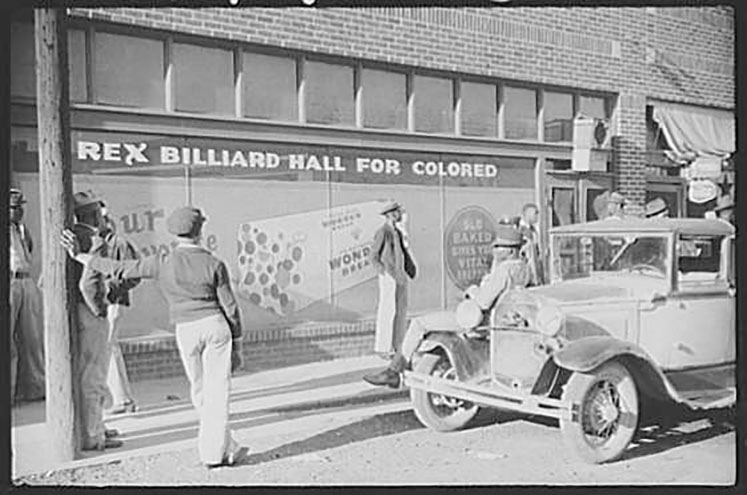
Figure 11.7 In the “Jim Crow” South, it was legal to have “separate but equal” facilities for Black people and White people. (Credit: Library of Congress/Wikimedia Commons)
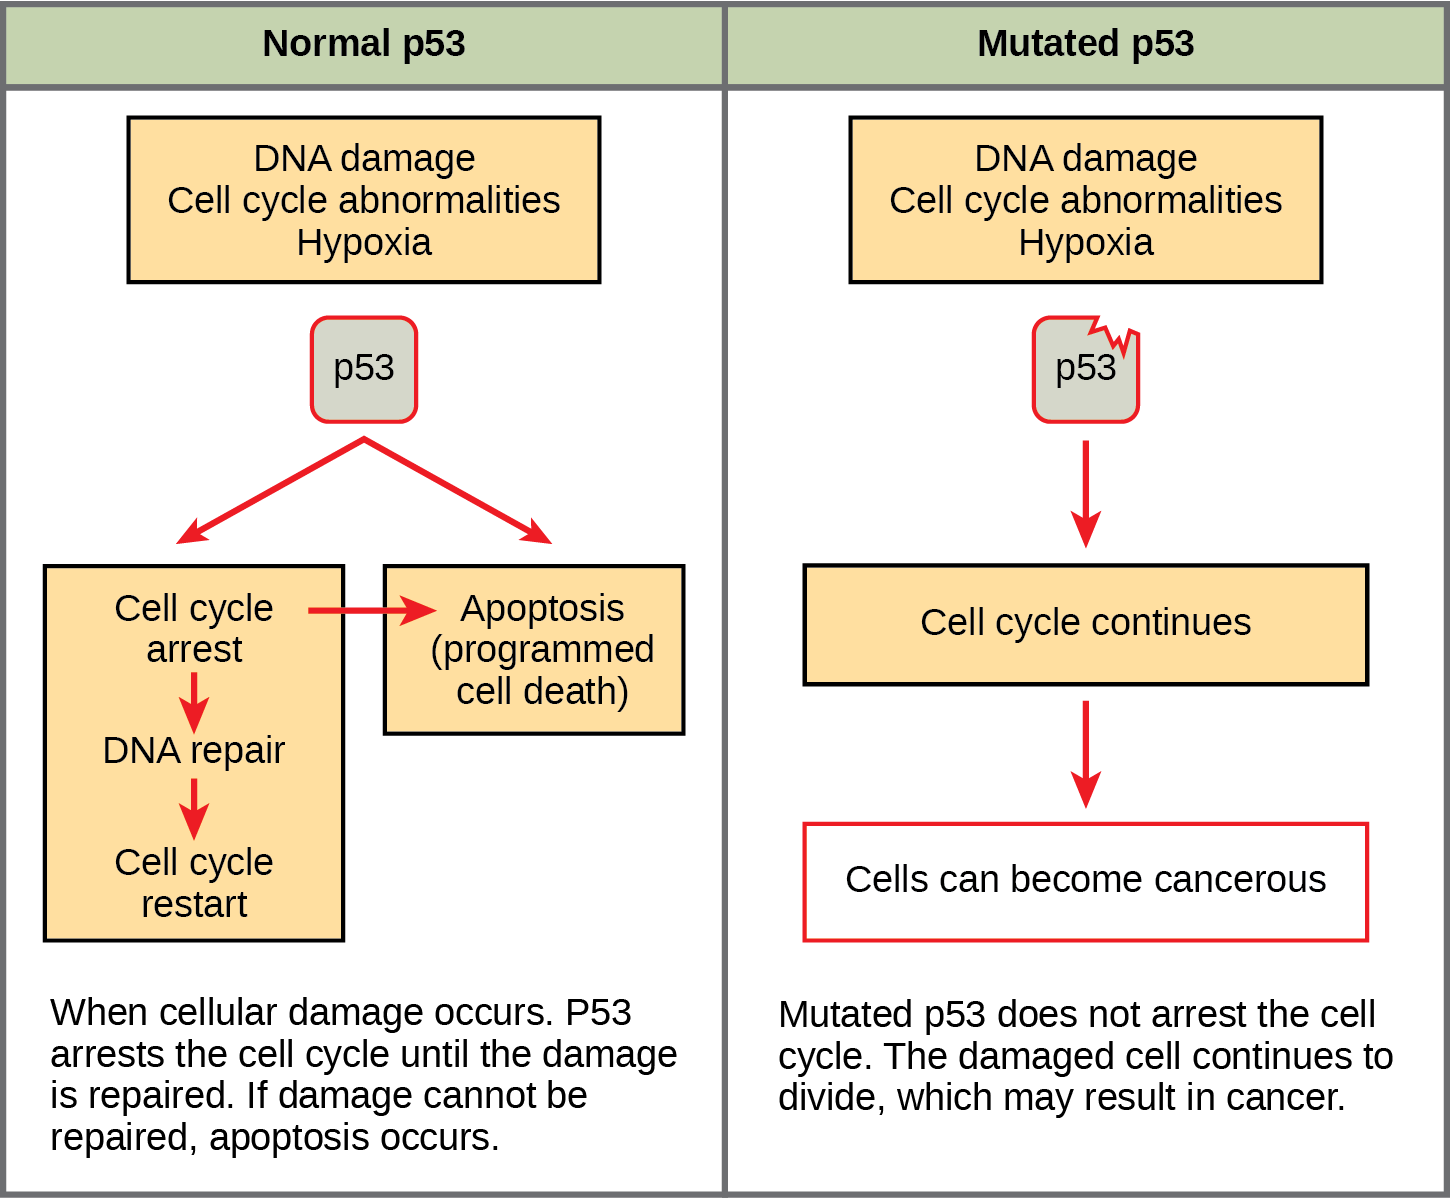
Figure 10.16 The role of normal p53 is to monitor DNA and the supply of oxygen (hypoxia is a condition of reduced oxygen supply). If damage is detected, p53 triggers repair mechanisms. If repairs are unsuccessful, p53 signals apoptosis. A cell with an abnormal p53 protein cannot repair damaged DNA and thus cannot signal apoptosis. Cells with abnormal p53 can become cancerous. (credit: modification of work by Thierry Soussi)
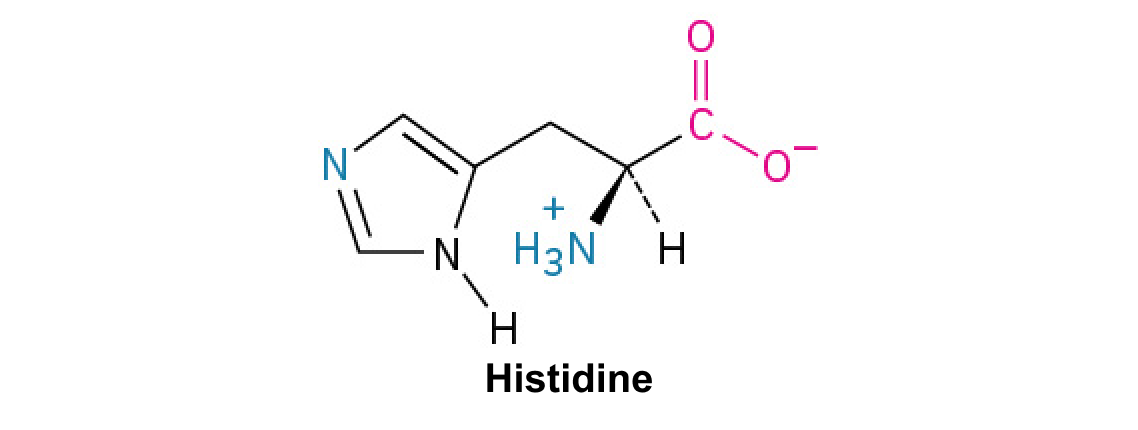
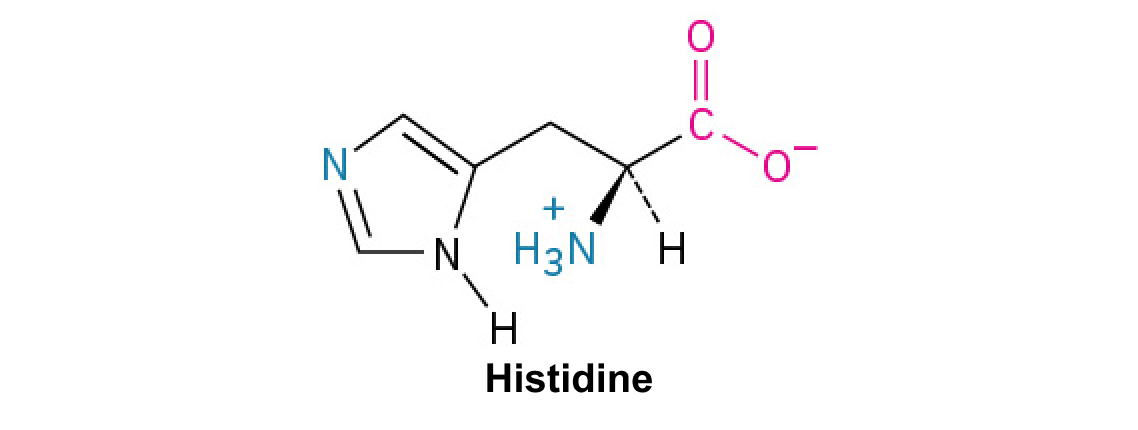
A nitrogen-containing functional group. A free amino acid’s amino group is typically protonated (NH₃⁺) near physiological pH; proline’s ring nitrogen is an exception to this formula.
Figure 15.4 This figure shows the genetic code for translating each nucleotide triplet in mRNA into an amino acid or a termination signal in a protein. (credit: modification of work by NIH)
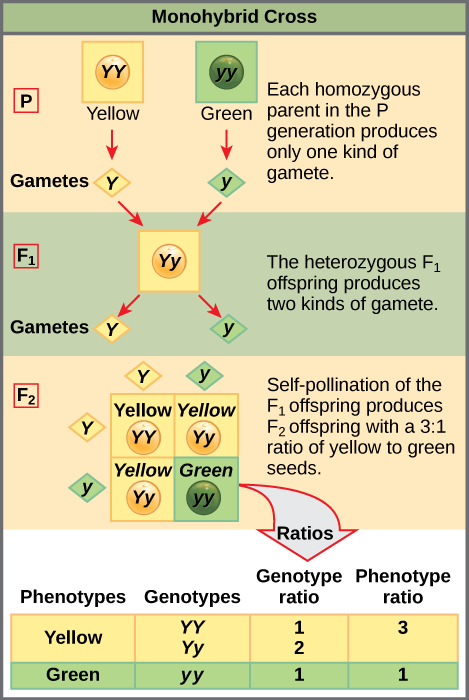
Figure 12.4 In the P generation, pea plants that are true-breeding for the dominant yellow phenotype are crossed with plants with the recessive green phenotype. This cross produces F 1 heterozygotes with a yellow phenotype. Punnett square analysis can be used to predict the genotypes of the F 2 generation.
An electrical property that can be positive or negative. Opposite charges attract and like charges repel; net charge is the sum of all charges on a particle.
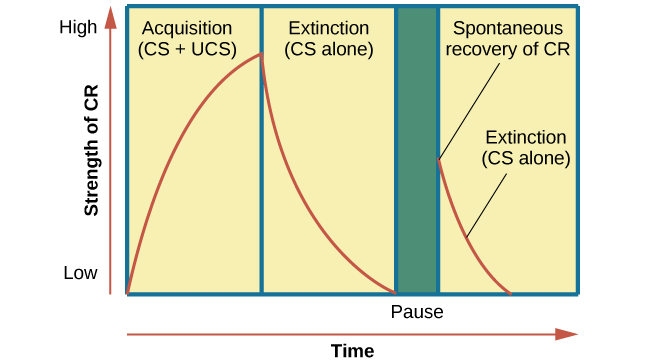
Figure 6.7 This is the curve of acquisition, extinction, and spontaneous recovery. The rising curve shows the conditioned response quickly getting stronger through the repeated pairing of the conditioned stimulus and the unconditioned stimulus (acquisition). Then the curve decreases, which shows how the conditioned response weakens when only the conditioned stimulus is presented (extinction). After a break or pause from conditioning, the conditioned response reappears (spontaneous recovery).
Figure 15.10 A generalized promoter of a gene transcribed by RNA polymerase II is shown. Transcription factors recognize the promoter. RNA polymerase II then binds and forms the transcription initiation complex.
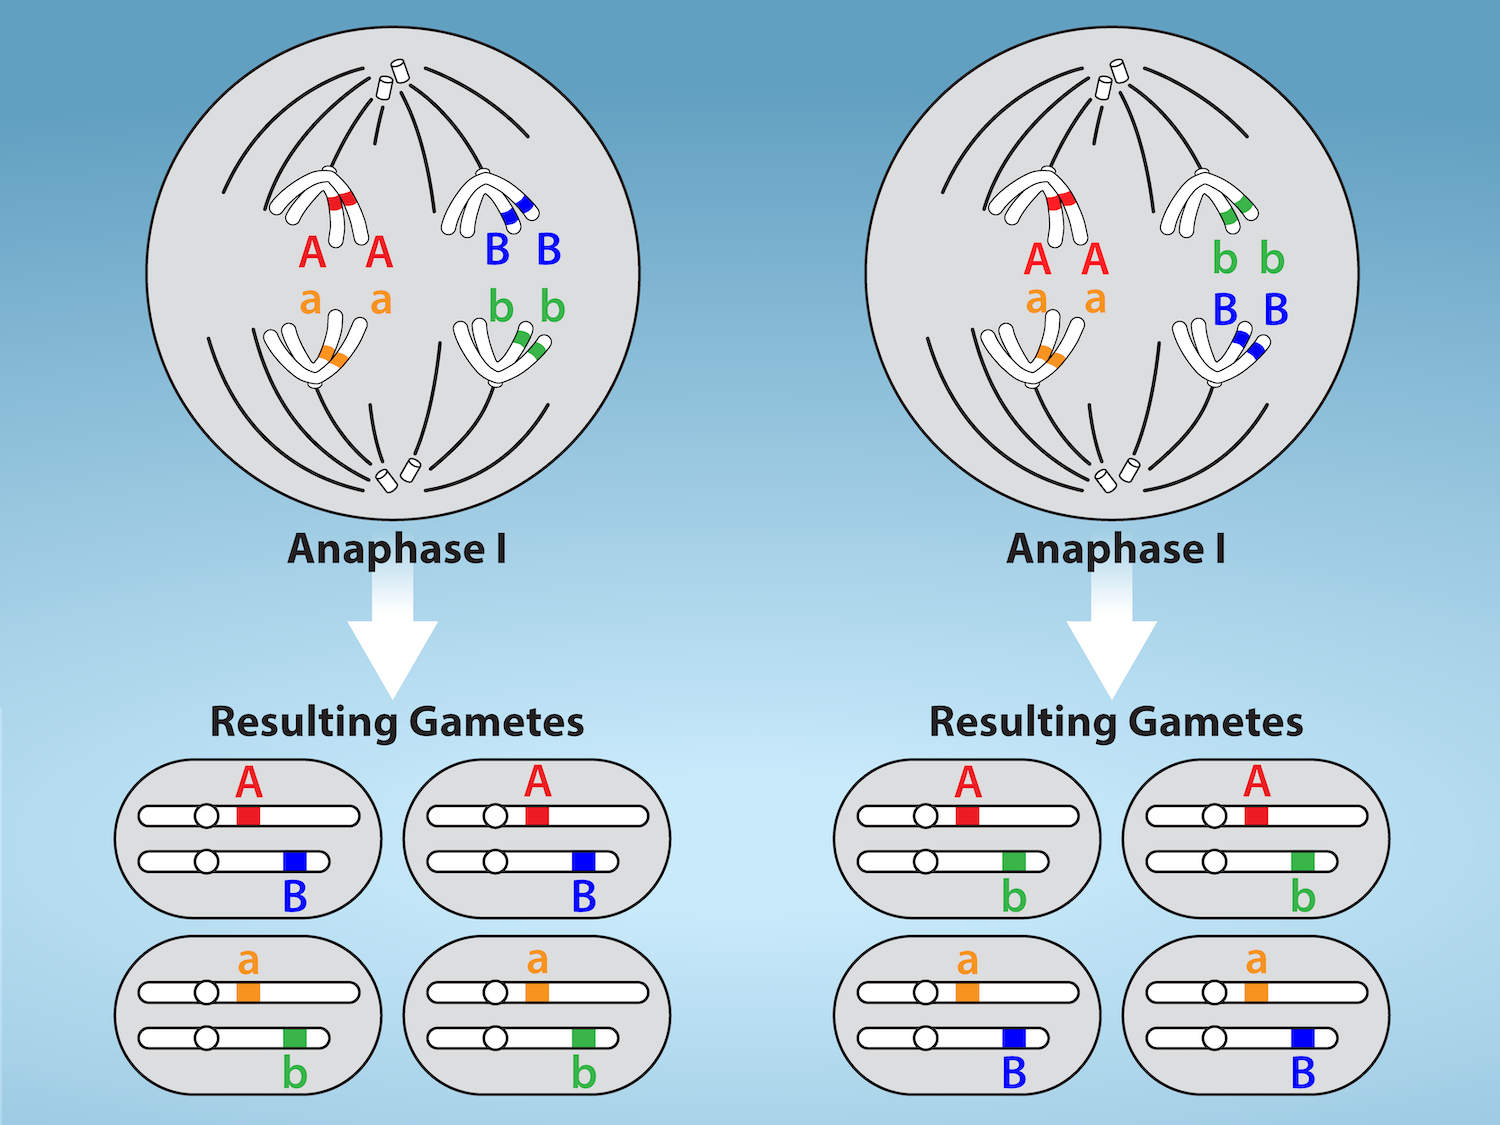
Figure 11.5 Random, independent assortment during metaphase I is demonstrated by considering a cell with a set of two chromosomes (n = 2).
There are two possible homologous chromosome arrangements at the equatorial plane in metaphase I, that are then separated during anaphase I.
The total possible number of different gametes is 2 n , where n equals the number of chromosomes in a set. In this example, there are four possible
genetic combinations for the gametes. With n = 23 in human cells, there are over eight million possible combinations of paternal and maternal
chromosomes. Credit: Rao, A.and Fletcher, S. Department of Biology, Texas A&M University.
Figure 12.4 In the P generation, pea plants that are true-breeding for the dominant yellow phenotype are crossed with plants with the recessive green phenotype. This cross produces F 1 heterozygotes with a yellow phenotype. Punnett square analysis can be used to predict the genotypes of the F 2 generation.
Figure 12.4 In the P generation, pea plants that are true-breeding for the dominant yellow phenotype are crossed with plants with the recessive green phenotype. This cross produces F 1 heterozygotes with a yellow phenotype. Punnett square analysis can be used to predict the genotypes of the F 2 generation.
The exponent needed to obtain a number from a chosen fixed number. For decimal logarithms, log₁₀(100) = 2 because 10² = 100; pH uses the negative decimal logarithm of hydrogen ion activity.
A thin boundary or sheet. Cell membranes are lipid bilayers containing proteins; blotting membranes are synthetic supports that hold proteins or nucleic acids for detection.
Figure 15.11 Eukaryotic pre-mRNA processing. In addition to 5’ Cap and 3’ Poly-A Tail addition, introns must be precisely removed and exons joined to generate a functional mRNA. Nucleotides upstream (towards the 5’cap) of the translation START codon are part of the 5’ untranslated region (5’ UTR). Nucleotides downstream (towards 3’end) of the STOP codon form the 3’ UTR. Both 5’ and 3’ UTRs are important for regulating translation initiation and mRNA stability. Credit: Rao, A., Ryan, K. Fletcher, S. and Tag, A. Department of Biology, Texas A&M University.
Rao, A., Ryan, K. Fletcher, S. and Tag, A. Department of Biology, Texas A&M University.; Mary Ann Clark, Matthew Douglas, and Jung Choi, Biology 2e, OpenStax. · CC BY-NC-SA 4.0
· Original image ↗ · Access for free ↗
Figure 12.4 In the P generation, pea plants that are true-breeding for the dominant yellow phenotype are crossed with plants with the recessive green phenotype. This cross produces F 1 heterozygotes with a yellow phenotype. Punnett square analysis can be used to predict the genotypes of the F 2 generation.
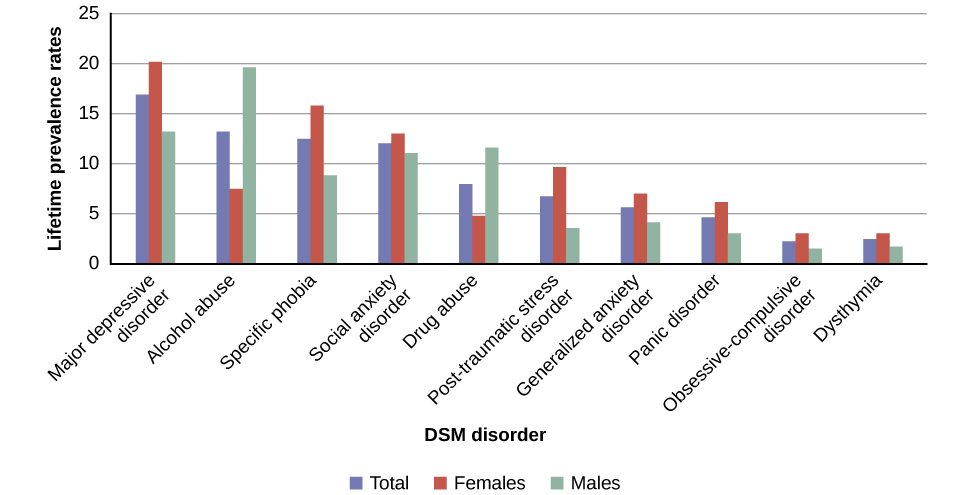
Figure 15.4 The graph shows the breakdown of psychological disorders, comparing the percentage prevalence among adult males and adult females in the United States. Because the data is from 2007, the categories shown here are from the DSM-IV, which has been supplanted by the DSM-5. Most categories remain the same; however, alcohol abuse now falls under a broader Alcohol Use Disorder category.
Figure 12.19 Reaction diagrams for an endothermic process in the absence (red curve) and presence (blue curve) of a catalyst. The catalyzed pathway involves a two-step mechanism (note the presence of two transition states) and an intermediate species (represented by the valley between the two transitions states).
Figure 7.45 - Non-homologous end joining (left) versus homologous recombination (right) - Wikipedia
Wikipedia, as credited by Kevin Ahern, Indira Rajagopal, and Taralyn Tan, Biochemistry Free For All, Oregon State University, via Biology LibreTexts. · Source attribution
· Original image ↗ · Access for free ↗
social exclusion
Restricted participation in institutions, opportunities, or community life.
The amount of a substance that can dissolve in a solvent under specified conditions. Soluble means able to dissolve; insoluble means only very slightly soluble in that solvent.
Figure 15.7 Messenger RNA is a copy of protein-coding information in the coding strand of DNA, with the substitution of U in the RNA for T in the coding sequence. However, new RNA nucleotides base pair with the nucleotides of the template strand. RNA is synthesized in its 5'-3' direction, using the enzyme RNA polymerase. As the template is read, the DNA unwinds ahead of the polymerase and then rewinds behind it.
A fleeting, high-energy arrangement at a reaction barrier. It is an energy maximum along the reaction path, rather than a stable reaction intermediate.
Figure 12.19 Reaction diagrams for an endothermic process in the absence (red curve) and presence (blue curve) of a catalyst. The catalyzed pathway involves a two-step mechanism (note the presence of two transition states) and an intermediate species (represented by the valley between the two transitions states).
Figure 15.18 Translation begins when an initiator tRNA anticodon recognizes a start codon on mRNA bound to a small ribosomal subunit. The large ribosomal subunit joins the small subunit, and a second tRNA is recruited. As the mRNA moves relative to the ribosome, successive tRNAs move through the ribosome and the polypeptide chain is formed. Entry of a release factor into the A site terminates translation and the components dissociate.
By the end of this section, you should be able to:
Describe the U.S. class structure
Describe several types of social mobility
Recognize characteristics that define and identify class
How does social stratification affect your ability to move up or down the social classes? What is a standard of living? What factors matter in rising up or becoming more successful in the eyes of those around you? Does being in a social class dictate your style, behavior, or opportunities?
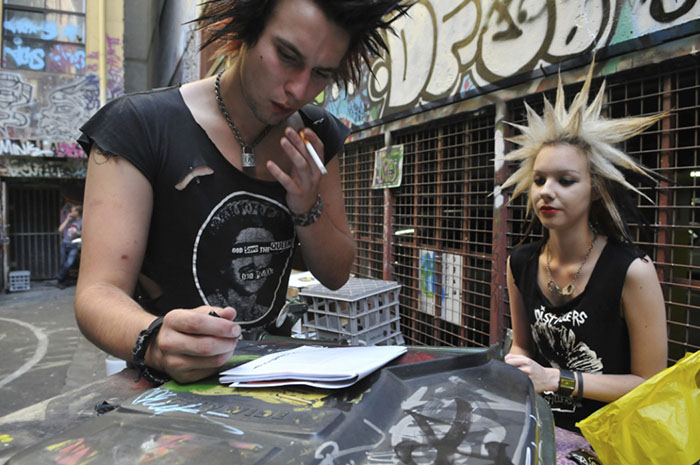
Figure 9.7 Does taste or fashion sense indicate class? Is there any way to tell if these people come from an upper-, middle-, or lower-class background? (Credit: Kelly Bailey/flickr)
For sociologists, categorizing social class is a fluid science. Sociologists generally identify three levels of class in the United States: upper, middle, and lower class. Within each class, there are many subcategories. Wealth is the most significant way of distinguishing classes, because wealth can be transferred to one’s children and perpetuate the class structure. One economist, J.D. Foster, defines the 20 percent of U.S. citizens’ highest earners as “upper income,” and the lower 20 percent as “lower income.” The remaining 60 percent of the population make up the middle class (Mason 2010). With that distinction, economists can describe the range in annual household incomes for the middle-class, but they cannot show how the range of all incomes vary and how they change over time. For this reason, the Pew Center defines classes based on the median household income. The lower class includes those whose income is two-thirds of the national median, the middle class includes those whose income falls between two-thirds and twice the median, and the upper class includes those whose income is above twice the national median (Kochhar 2015). Though median income levels vary from state to state, at the national level you would be considered in the middle-class if you earned between $48,500 to $145,500 in 2018 U.S. dollars (Bennett 2000).
One sociological perspective distinguishes the classes, in part, according to their relative power and control over their lives. Members of the upper class not only have power and control over their own lives, but their social status gives them power and control over others’ lives. The middle class doesn’t generally control other strata of society, but its members do exert control over their own lives. In contrast, the lower class has little control over their work or lives. Below, we will explore the major divisions of U.S. social class and their key subcategories.
Figure 9.8 Members of the upper class can afford to live, work, and play in exclusive places, such as country clubs and gated communities, designed for luxury, safety, and comfort. (Credit: PrimeImageMedia.com/flickr)
The upper class is considered the top, and only the powerful elite get to see the view from there. In the United States, people with extreme wealth make up one percent of the population, and they own roughly one-third of the country’s wealth (Beeghley 2008).
Money provides not just access to material goods, but also access to a lot of power. As corporate leaders, members of the upper class make decisions that affect the job status of millions of people. As media owners, they influence the collective identity of the nation. They run the major network television stations, radio broadcasts, newspapers, magazines, publishing houses, and sports franchises. As board members of the most influential colleges and universities, they influence cultural attitudes and values. As philanthropists, they establish foundations to support social causes they believe in. As campaign contributors and legislation drivers, they fund political campaigns to sway policymakers, sometimes to protect their own economic interests and at other times to support or promote a cause. (The methods, effectiveness, and impact of these political efforts are discussed in the Politics and Government chapter.)
U.S. society has historically distinguished between “old money” (inherited wealth passed from one generation to the next) and “new money” (wealth you have earned and built yourself). While both types may have equal net worth, they have traditionally held different social standings. People of old money, firmly situated in the upper class for generations, have held high prestige. Their families have socialized them to know the customs, norms, and expectations that come with wealth. Often, the very wealthy don’t work for wages. Some study business or become lawyers in order to manage the family fortune. Others, such as Paris Hilton and Kim Kardashian, capitalize on being a rich socialite and transform that into celebrity status, flaunting a wealthy lifestyle.
However, new-money members of the upper class are not oriented to the customs and mores of the elite. They haven’t gone to the most exclusive schools. They have not established old-money social ties. People with new money might flaunt their wealth, buying sports cars and mansions, but they might still exhibit behaviors attributed to the middle and lower classes.
Many people consider themselves middle class, but there are differing ideas about what that means. People with annual incomes of $150,000 call themselves middle class, as do people who annually earn $30,000. That helps explain why, in the United States, the middle class is broken into upper and lower subcategories.
Lower-middle class members tend to complete a two-year associate’s degrees from community or technical colleges or a four-year bachelor’s degree. Upper-middle class people tend to continue on to postgraduate degrees. They’ve studied subjects such as business, management, law, or medicine.
Middle-class people work hard and live fairly comfortable lives. Upper-middle-class people tend to pursue careers, own their homes, and travel on vacation. Their children receive high-quality education and healthcare (Gilbert 2010). Parents can support more specialized needs and interests of their children, such as more extensive tutoring, arts lessons, and athletic efforts, which can lead to more social mobility for the next generation. Families within the middle class may have access to some wealth, but also must work for an income to maintain this lifestyle.
In the lower middle class, people hold jobs supervised by members of the upper middle class. They fill technical, lower- level management or administrative support positions. Compared to lower-class work, lower-middle-class jobs carry more prestige and come with slightly higher paychecks. With these incomes, people can afford a decent, mainstream lifestyle, but they struggle to maintain it. They generally don’t have enough income to build significant savings. In addition, their grip on class status is more precarious than those in the upper tiers of the class system. When companies need to save money, lower-middle class people are often the ones to lose their jobs.
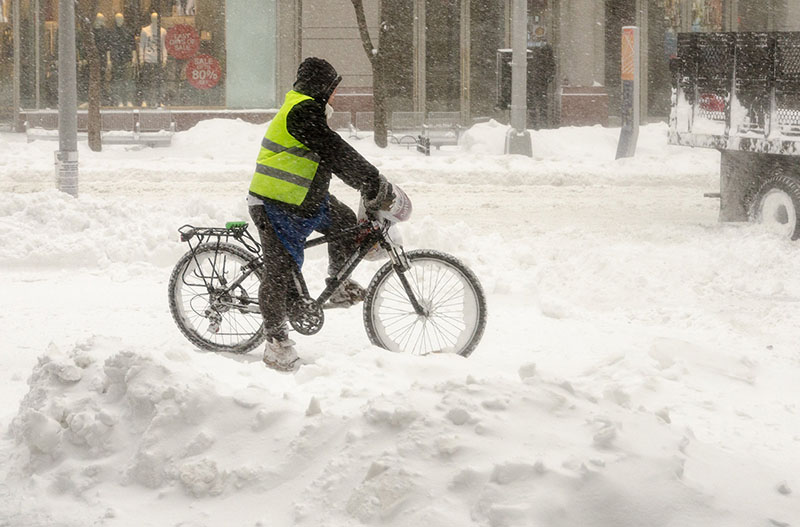
Figure 9.10 Bike messengers and bike delivery people are often considered members of the working class. They endure difficult and dangerous conditions to do their work, and they are not always well represented by government agencies and in regulations designed for safety or fairness. (Credit: edwardhblake/flickr)
The lower class is also referred to as the working class. Just like the middle and upper classes, the lower class can be divided into subsets: the working class, the working poor, and the underclass. Compared to the lower middle class, people from the lower economic class have less formal education and earn smaller incomes. They work jobs that require less training or experience than middle-class occupations and often do routine tasks under close supervision.
Working-class people, the highest subcategory of the lower class, often land steady jobs. The work is hands-on and often physically demanding, such as landscaping, cooking, cleaning, or building.
Beneath the working class is the working poor. They have unskilled, low-paying employment. However, their jobs rarely offer benefits such as healthcare or retirement planning, and their positions are often seasonal or temporary. They work as migrant farm workers, housecleaners, and day laborers. Education is limited. Some lack a high school diploma.
How can people work full-time and still be poor? Even working full-time, millions of the working poor earn incomes too meager to support a family. The government requires employers pay a minimum wage that varies from state to state, and often leave individuals and families below the poverty line. In addition to low wages, the value of the wage has not kept pace with inflation. “The real value of the federal minimum wage has dropped 17% since 2009 and 31% since 1968 (Cooper, Gould, & Zipperer, 2019). Furthermore, the living wage, the amount necessary to meet minimum standards, differs across the country because the cost of living differs. Therefore, the amount of income necessary to survive in an area such as New York City differs dramatically from small town in Oklahoma (Glasmeier, 2020).
The underclass is the United States’ lowest tier. The term itself and its classification of people have been questioned, and some prominent sociologists (including a former president of the American Sociological Association), believe its use is either overgeneralizing or incorrect (Gans 1991). But many economists, sociologists government agencies, and advocacy groups recognize the growth of the underclass. Members of the underclass live mainly in inner cities. Many are unemployed or underemployed. Those who do hold jobs typically perform menial tasks for little pay. Some of the underclass are homeless. Many rely on welfare systems to provide food, medical care, and housing assistance, which often does not cover all their basic needs. The underclass have more stress, poorer health, and suffer crises fairly regularly.
Class Traits
Does a person’s appearance indicate class? Can you tell a person’s education level based on their clothing? Do you know a person’s income by the car they drive? Class traits, also called class markers, are the typical behaviors, customs, and norms that define each class. Class traits indicate the level of exposure a person has to a wide range of cultures. Class traits also indicate the amount of resources a person has to spend on items like hobbies, vacations, and leisure activities.
People may associate the upper class with enjoyment of costly, refined, or highly cultivated tastes—expensive clothing, luxury cars, high-end fund-raisers, and frequent or expensive vacations. People may also believe that the middle and lower classes are more likely to enjoy camping, fishing, or hunting, shopping at large retailers, and participating in community activities. While these descriptions may identify class traits, they are stereotypes. Moreover, just as class distinctions have blurred in recent decades, so too have class traits. A factory worker could be a skilled French cook. A billionaire might dress in ripped jeans, and a low-income student might own designer shoes.
For famous wealthy people, making choices that do not seem to align with their economic status can often lead to public commentary. Jennifer Lopez being spotted in a dress that cost less than $30 and Zac Efron shopping at thrift stores have made the news. Others, like Halle Berry and Keanu Reeves, are known for frequent use of public transportation and relatively modest living (at least when considering to their net worth). When questioned, most point to nothing more than practicality. Lady Gaga tweeted " why do people look at me like I'm crazy when i use coupons at grocery or try bargaining at retail..." (2012). And in dense, crowded cities such as Washington, Chicago, and New York, riding the trains is often faster and easier than taking a car.
Social Mobility
People are often inspired and amazed at people's ability to overcome extremely difficult upbringings. Mariano Rivera, acknowledged to be the best relief pitcher in history, made a baseball glove out of cardboard and tape because his family could not afford a real one. Alice Coachman grew up with few resources and was denied access to training facilities because of her race; she ran barefoot and built her own high jump equipment before becoming the first Black woman (and one of the first American track and field athletes) to win an Olympic Gold. Pelé, perhaps the most transformative figure in soccer, learned the game while using a rag-stuffed sock for a ball. These are some of the stories told in documentaries or biographies meant to inspire and share the challenges of unequal upbringings. Relative to the overall population, the number of people who rise from poverty to become very successful is small, and the number that become wealthy is even smaller. Systemic barriers like unequal education, discrimination, and lack of opportunity can slow or diminish one's ability to move up. Still, people who earn a college degree, get a job promotion, or marry someone with a good income may move up socially.
Social mobility refers to the ability of individuals to change positions within a social stratification system. When people improve or diminish their economic status in a way that affects social class, they experience social mobility. Individuals can experience upward or downward social mobility for a variety of reasons. Upward mobility refers to an increase—or upward shift—when they move from a lower to a higher socioeconomical class. In contrast, individuals experience downward mobility when they move from higher socioeconomic class to a lower one. Some people move downward because of business setbacks, unemployment, or illness. Dropping out of school, losing a job, or getting a divorce may result in a loss of income or status and, therefore, downward social mobility.
It is not uncommon for different generations of a family to belong to varying social classes. This is known as intergenerational mobility. For example, an upper-class executive may have parents who belonged to the middle class. In turn, those parents may have been raised in the lower class. Patterns of intergenerational mobility can reflect long-term societal changes.
On the other hand, intragenerational mobility refers to changes in a person's social mobility over the course of their lifetime. For example, the wealth and prestige experienced by one person may be quite different from that of their siblings.
Structural mobility happens when societal changes enable a whole group of people to move up or down the social class ladder. Structural mobility is attributable to changes in society as a whole. In the first half of the twentieth century, industrialization expanded the U.S. economy, raising the standard of living and leading to upward structural mobility for almost everyone. In the decade and a half of the twenty-first century, recessions and the outsourcing of jobs overseas have contributed to the withdrawal of Americans from the workforce (BLS 2021). Many people experienced economic setbacks, creating a wave of downward structural mobility.
When analyzing the trends and movements in social mobility, sociologists consider all modes of mobility. Scholars recognize that mobility is not as common or easy to achieve as many people think.
Stratification of Socioeconomic Classes
In the last century, the United States has seen a steady rise in its standard of living, the level of wealth available to acquire the material necessities and comforts to maintain a specific lifestyle. The country’s standard of living is based on factors such as income, employment, class, literacy rates, mortality rates, poverty rates, and housing affordability. A country with a high standard of living will often reflect a high quality of life, which in the United States means residents can afford a home, own a car, and take vacations. Ultimately, standard of living is shaped by the wealth and distribution of wealth in a country and the expectations its citizens have for their lifestyle.
Wealth is not evenly distributed in most countries. In the United States, a small portion of the population has the means to the highest standard of living. The wealthiest one percent of the population holds one-third of our nation’s wealth while the bottom 50 percent of Americans hold only 2 percent. Those in-between, the top 50 to 90 percent hold almost two-thirds of the nation’s wealth (The Federal Reserve, 2021).
Many people think of the United States as a “middle-class society.” They think a few people are rich, a few are poor, and most are fairly well off, existing in the middle of the social strata. Rising from lower classes into the middle-class is to achieve the American Dream. For this reason, scholars are particularly worried by the shrinking of the middle class. Although the middle class is still significantly larger than the lower and upper classes, it shrank from 69 percent in 1971 to 51 percent in 2020. Arguably the most significant threat to the U.S.’s relatively high standard of living is the decline of the middle class. The wealth of the middle class has also been declining in recent decades. Its share of the wealth fell from 32 percent in 1983 to 16 percent in 2016 (Horowitz, Igielnik, & Kochhar 2020).
People with wealth often receive the most and best schooling, access better health care, and consume the most goods and services. In addition, wealthy people also wield decision-making power over their daily life because money gives them access to better resources. By contrasts, many lower-income individuals receive less education and inadequate health care and have less influence over the circumstances of their everyday lives.
Additionally, tens of millions of women and men struggle to pay rent, buy food, find work, and afford basic medical care. Women who are single heads of household tend to have a lower income and lower standard of living than their married or single male counterparts. This is a worldwide phenomenon known as the “feminization of poverty”—which acknowledges that women disproportionately make up the majority of individuals in poverty across the globe and have a lower standard of living. In the United States, women make up approximately 56 percent of Americans living in poverty. One reason for this difference is the struggle of single mothers to provide for their children. One in four unmarried mothers lives in poverty (Bleiweis, 2020). The wage gap, discussed extensively in the Work and the Economy chapter, also contributes to the gender-disparity in poverty.
In the United States, poverty is most often referred to as a relative rather than absolute measurement. Absolute poverty is an economic condition in which a family or individual cannot afford basic necessities, such as food and shelter, so that day-to-day survival is in jeopardy. Relative poverty is an economic condition in which a family or individuals have 50% less income than the average median income. This income is sometimes called the poverty level or the poverty line. In 2021, for example, the poverty for a single individual was set at $12,880 for one individual, $17,420 for a couple, and $26,500 for a family of four (ASPE 2021).
As a wealthy developed country, the United States invests in resources to provide the basic necessities to those in need through a series of federal and state social welfare programs. These programs provide food, medical, and cash assistance. Temporary Assistance for Needy Families (TANF) provides cash assistance. The goal of TANF is to help families with children achieve economic self-sufficiency. Adults who receive assistance must fall under a specific income level, usually half the poverty level, set by the state. TANF funding goes to childcare, support for parents who are working or training a required number of hours a week, and other services. TANF is time-limited. Most states only provide assistance for a maximum of 5 years (CBPP).
One of the best-known programs is the Supplemental Nutrition Assistance Program (SNAP), administered by the United States Department of Agriculture and formerly known as the Food Stamp Program. This program began in the Great Depression, when unmarketable or surplus food was distributed to the hungry. It was not formalized until 1961, when President John F. Kennedy initiated a food stamp pilot program. His successor Lyndon B. Johnson was instrumental in the passage of the Food Stamp Act in 1964. In 1965, more than 500,000 individuals received food assistance. During the height of the pandemic in 2020, participation reached 43 million people.
10.2 Global Wealth and Poverty
OpenStax · 10.2 Global Wealth and Poverty ↗ Instructional page including learning objectives, examples, figures, source tables and questions. Site navigation and embedded media players are omitted; source media links remain available.
Learning Objectives
By the end of this section, you should be able to:
Differentiate relative, extreme, and subjective poverty
Describe the economic situation of some of the world’s most impoverished areas
Explain the cyclical impact of the consequences of poverty
What does it mean to be poor? Does it mean being a single mother with two kids in New York City, waiting for the next paycheck in order to buy groceries? Does it mean living with almost no furniture in your apartment because your income doesn’t allow for extras like beds or chairs? Or does it mean having to live with the distended bellies of the chronically malnourished throughout the peripheral nations of Sub-Saharan Africa and South Asia? Poverty has a thousand faces and a thousand gradations; there is no single definition that pulls together every part of the spectrum. You might feel you are poor if you can’t afford cable television or buy your own car. Every time you see a fellow student with a new laptop and smartphone you might feel that you, with your ten-year-old desktop computer, are barely keeping up. However, someone else might look at the clothes you wear and the calories you consume and consider you rich.
Types of Poverty
Social scientists define global poverty in different ways and take into account the complexities and the issues of relativism described above. Relative poverty is a state of living where people can afford necessities but are unable to meet their society’s average standard of living. People often disparage “keeping up with the Joneses”—the idea that you must keep up with the neighbors’ standard of living to not feel deprived. But it is true that you might feel ”poor” if you are living without a car to drive to and from work, without any money for a safety net should a family member fall ill, and without any “extras” beyond just making ends meet.
Contrary to relative poverty, people who live in extreme poverty lack even the basic necessities, which typically include adequate food, clean water, safe housing, and access to healthcare. Extreme poverty occurs when someone lives on less than 1.90 U.S dollars per day.
In prior years, the World Bank—the primary organization analyzing these trends––focused heavily on the number of people under that extreme poverty level of $1.90 per day. (The previous term was "absolute poverty.") In 2018, the World Bank added two more measures to consider: people living on less than $3.20 and people living on less than $5.50. As the number of people in that extreme category continues to decline, these two new categories will be important to recognize the population that lives above the $1.90 line, but still remains vulnerable to extreme poverty. Someone who begins to earn enough to live on more than $1.90 is still in severe poverty and should be considered as such (Schoch 2020).
If you were forced to live on $1.90 a day, or even $5.50, how would you do it? What would you deem worthy of spending money on, and what could you do without? How would you manage the necessities—and how would you make up the gap between what you need to live and what you can afford?
Subjective poverty describes poverty that is composed of many dimensions; it is subjectively present when your actual income does not meet your expectations and perceptions. With the concept of subjective poverty, the poor themselves have a greater say in recognizing when it is present. In short, subjective poverty has more to do with how a person or a family defines themselves. This means that a family subsisting on a few dollars a day in Nepal might think of themselves as doing well, within their perception of normal. However, a westerner traveling to Nepal might visit the same family and see extreme need.
Big Picture
The Underground Economy Around the World
What do the driver of an unlicensed hack cab in New York, a piecework seamstress working from her home in Mumbai, and a street tortilla vendor in Mexico City have in common? They are all members of the underground economy, a loosely defined unregulated market unhindered by taxes, government permits, or human protections. Official statistics before the worldwide recession posit that the underground economy accounted for over 50 percent of nonagricultural work in Latin America; the figure went as high as 80 percent in parts of Asia and Africa (Chen 2001). A recent article in the Wall Street Journal discusses the challenges, parameters, and surprising benefits of this informal marketplace. The wages earned in most underground economy jobs, especially in peripheral nations, are a pittance––a few rupees for a handmade bracelet at a market, or maybe 250 rupees ($5 U.S.) for a day’s worth of fruit and vegetable sales (Barta 2009). But these tiny sums mark the difference between survival and extinction for the world’s poor.
The underground economy has never been viewed very positively by global economists. After all, its members don’t pay taxes, don’t take out loans to grow their businesses, and rarely earn enough to put money back into the economy in the form of consumer spending. But according to the International Labor Organization (an agency of the United Nations), some 52 million people worldwide will lose their jobs due to the ongoing worldwide recession. And while those in core nations know that high unemployment rates and limited government safety nets can be frightening, their situation is nothing compared to the loss of a job for those barely eking out an existence. Once that job disappears, the chance of staying afloat is very slim.
Within the context of this recession, some see the underground economy as a key player in keeping people alive. Indeed, an economist at the World Bank credits jobs created by the informal economy as a primary reason why peripheral nations are not in worse shape during this recession. Women in particular benefit from the informal sector. The majority of economically active women in peripheral nations are engaged in the informal sector, which is somewhat buffered from the economic downturn. The flip side, of course, is that it is equally buffered from the possibility of economic growth.
Even in the United States, the informal economy exists, although not on the same scale as in peripheral and semi-peripheral nations. It might include under-the-table nannies, gardeners, and housecleaners, as well as unlicensed street vendors and taxi drivers. There are also those who run informal businesses, like daycares or salons, from their houses. Analysts estimate that this type of labor may make up 10 percent of the overall U.S. economy, a number that will likely grow as companies reduce head counts, leaving more workers to seek other options. In the end, the article suggests that, whether selling medicinal wines in Thailand or woven bracelets in India, the workers of the underground economy at least have what most people want most of all: a chance to stay afloat (Barta 2009).
Who Are the Impoverished?
Who are the impoverished? Who is living in absolute poverty? The truth that most of us would guess is that the richest countries are often those with the least people. Compare the United States, which possesses a relatively small slice of the population pie and owns by far the largest slice of the wealth pie, with India. These disparities have the expected consequence. The poorest people in the world are women and those in peripheral and semi-peripheral nations. For women, the rate of poverty is particularly worsened by the pressure on their time. In general, time is one of the few luxuries the very poor have, but study after study has shown that women in poverty, who are responsible for all family comforts as well as any earnings they can make, have less of it. The result is that women are suffering more in terms of overall wellbeing (Buvinic 1997). It is harder for females to get credit to expand businesses, to take the time to learn a new skill, or to spend extra hours improving their craft so as to be able to earn at a higher rate.
Global Feminization of Poverty
In almost all societies, women have higher rates of poverty than men. More women and girls live in poor conditions, receive inadequate healthcare, bear the brunt of malnutrition and inadequate drinking water, and so on. This situation goes back decades, and led University of Michigan sociologist Diana Pearce to coin the term "feminization of poverty" in 1978. Throughout the 1990s, data indicated that while overall poverty rates were rising, especially in peripheral nations, the rates of impoverishment increased for women nearly 20 percent more than for men (Mogadham 2005). More recently, as extreme poverty rates continue to fall, women still make up a disproportionate amount of the world's poor. Gender differences are sometimes difficult to discern in international poverty data, but researchers have undertaken efforts to define the makeup of those affected by poverty. Of people aged 25-34, the world has 122 women living in poverty for every 100 men living in poverty. The world's elderly below the poverty line are also more likely to be women (World Bank 2018).
Why is this happening? While myriad variables affect women's poverty, research specializing in this issue identifies three causes (Mogadham 2005):
The expansion in the number of female-headed households
The persistence and consequences of intra-household inequalities and biases against women
The implementation of neoliberal economic policies around the world
While women are living longer and healthier lives today compared to ten years ago, around the world many women are denied basic rights, particularly in the workplace. In peripheral nations, they accumulate fewer assets, farm less land, make less money, and face restricted civil rights and liberties. Women can stimulate the economic growth of peripheral nations, but they are often undereducated and lack access to credit needed to start small businesses. When women are able to attain higher levels of education, they account for significant economic growth within their nations (OECD 2012).
A wide range of organizations undertake programs or provide support in order to improve opportunity, safety, education, equality, and financial outcomes for women. Some of these efforts involve diplomacy, such as one government (or a coalition) working to secure greater rights and improve circumstances of women in other countries. Key areas of focus are reducing institutional and cultural discrimination, ending domestic violence, providing women more agency in decision making, and increasing education for children (Scott 2012). Other programs focus on more immediate needs and opportunities. Microcredit and women's collective savings accounts are ways to provide financial resources for women and families to make important investments, such as building a well at their home to improve health and reduce time spent obtaining clean water. Other uses may involve starting a business, paying a debt, or buying an important appliance or equipment. Unfortunately, these microfinance programs don't have a track record of alleviating poverty, and in some cases they can lead to negative outcomes such as trapping women in a cycle of debt, or increasing domestic violence. Collective savings programs—where local people pool their resources and extend credit within their group—have shown some more positive outcomes (Aizenman 2016 and Niner 2018). The UN has emphasized that microfinance and cultural empowerment would both be more successful if they were used in concert with each other (Scott 2012).
Africa
The majority of the poorest countries in the world are in Africa. That is not to say there is not diversity within the countries of that continent; countries like South Africa and Egypt have much lower rates of poverty than Angola and Ethiopia, for instance. Overall, African income levels have been dropping relative to the rest of the world, meaning that Africa as a whole is getting relatively poorer. Making the problem worse, 2014 saw an outbreak of the Ebola virus in western Africa, leading to a public health crisis and an economic downturn due to loss of workers and tourist dollars.
Why is Africa in such dire straits? Much of the continent’s poverty can be traced to the availability of land, especially arable land (land that can be farmed). Centuries of struggle over land ownership have meant that much useable land has been ruined or left unfarmed, while many countries with inadequate rainfall have never set up an infrastructure to irrigate. Many of Africa’s natural resources were long ago taken by colonial forces, leaving little agricultural and mineral wealth on the continent.
Further, African poverty is worsened by civil wars and inadequate governance that are the result of a continent re-imagined with artificial colonial borders and leaders. Consider the example of Rwanda. There, two ethnic groups cohabitated with their own system of hierarchy and management until Belgians took control of the country in 1915 and rigidly confined members of the population into two unequal ethnic groups. While, historically, members of the Tutsi group held positions of power, the involvement of Belgians led to the Hutu seizing power during a 1960s revolt. This ultimately led to a repressive government and genocide against Tutsis that left hundreds of thousands of Rwandans dead or living in diaspora (U.S. Department of State 2011c). The painful rebirth of a self-ruled Africa has meant many countries bear ongoing scars as they try to see their way towards the future (World Poverty 2012a). In 2020, armed conflicts were underway in regions of nations including the Tigray conflict in Ethiopia, the Kamwina Nsapo rebellion in Democratic Republic of Congo, the Boko Haram insurgency in Nigeria and neighboring countries, and several more. While most of the ongoing conflicts are considered minor, they are both dangerous and disruptive to the people living in those regions, and several have included ethnic cleansing, mass kidnapping, extensive sexual violence, and use of child soldiers.
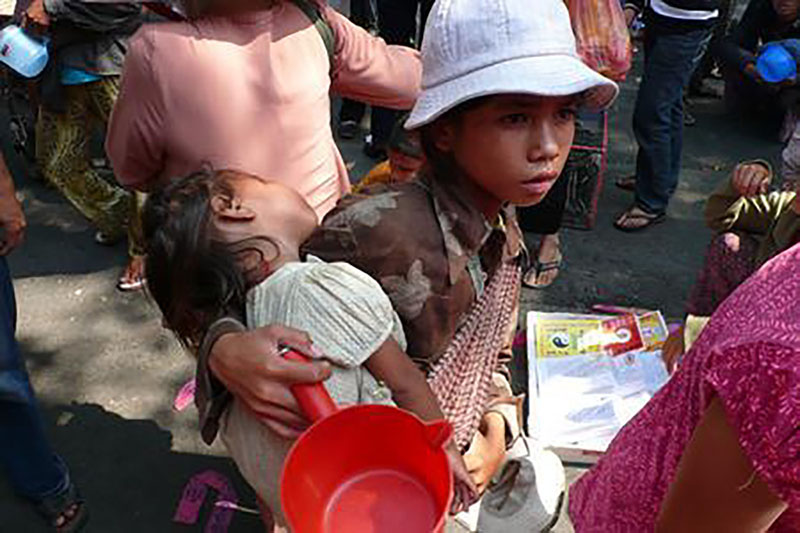
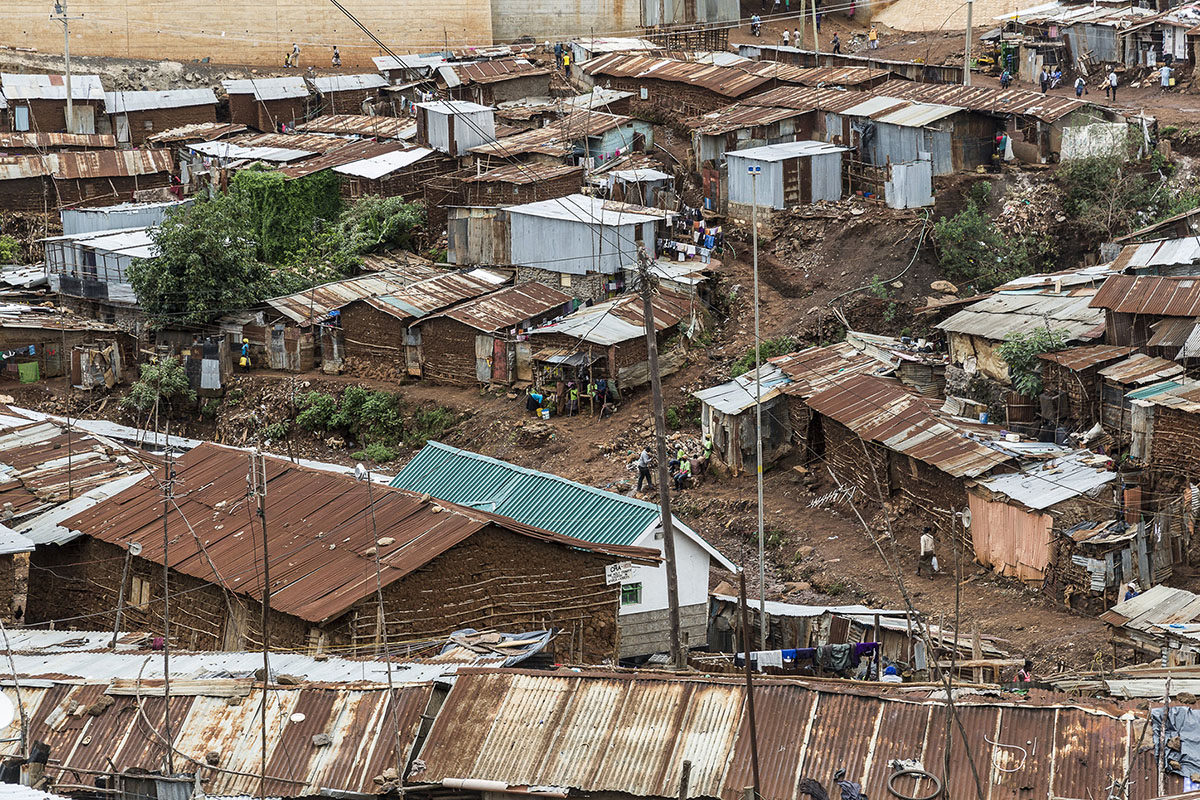
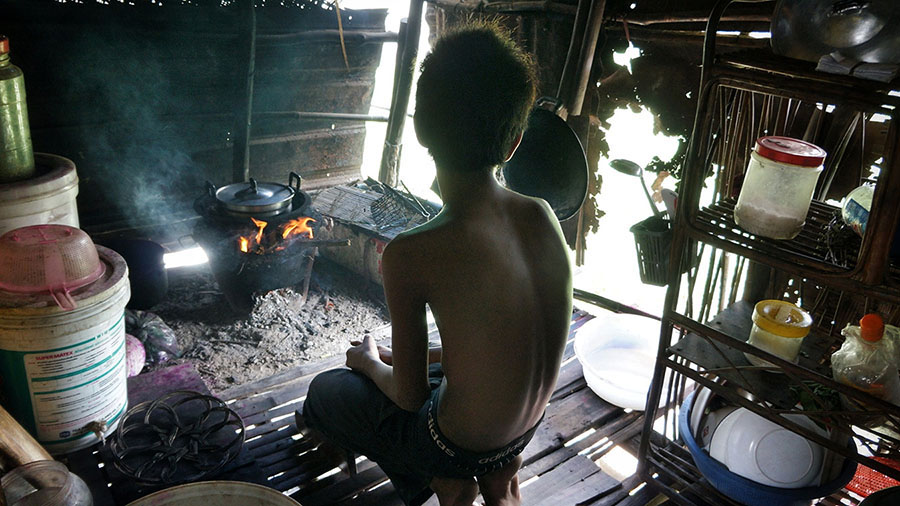
Figure 10.8 For children who have homes in slums like this one in Phnom Phen, Cambodia, survival and safety are often the primary and immediate concerns. Longer-term goals, such as education and social mobility, may not be available options. (Credit: ND Strupler)
While the majority of the world’s poorest countries are in Africa, the majority of the world’s poorest people are in Asia. As in Africa, Asia finds itself with disparity in the distribution of poverty, with Japan and South Korea holding much more wealth than India and Cambodia. In fact, most poverty is concentrated in South Asia. One of the most pressing causes of poverty in Asia is simply the pressure that the size of the population puts on its resources. Unlike Africa, many people living in poverty reside in urban areas, often in crowded, unhygenic conditions with limited access to water and resources. Estimates indicate that Asia has 60 percent of the world's people who live in slums (WorldVision 2019). Those who find work often do so in garment factories or other manufacturing facilities, where pay is very low and the demands are incredibly high. (See the feature below on sweatshop labor.) Children are sent to work in these conditions as well.
Asia is also frequently impacted by natural disasters. Countries like India, Bangladesh, Vietnam, Thailand, and the Philippines experience frequent typhoons (hurricanes) and flooding. For those living in insecure structures —often constructed from various leftover materials and not subject to any type of building codes—such events can leave entire swaths of the population homeless and vulnerable to disease or injury (WorldVision 2019).
MENA
The Middle East and North Africa region (MENA) includes oil-rich countries in the Gulf, such as Iran, Iraq, and Kuwait, but also countries that are relatively resource-poor in relationship to their populations, such as Morocco and Yemen. These countries are predominately Islamic. For the last quarter-century, economic growth was slower in MENA than in other developing economies, and almost a quarter of the 300 million people who make up the population live on less than $2.00 a day (World Bank 2013).
The International Labour Organization tracks the way income inequality influences social unrest. The two regions with the highest risk of social unrest are Sub-Saharan Africa and the Middle East-North Africa region (International Labour Organization 2012). Increasing unemployment and high socioeconomic inequality in MENA were major factors in the Arab Spring, which—beginning in 2010—toppled dictatorships throughout the Middle East in favor of democratically elected government. Unemployment and income inequalities are still being blamed on immigrants, foreign nationals, and ethnic/religious minorities.
Sociology in the Real World
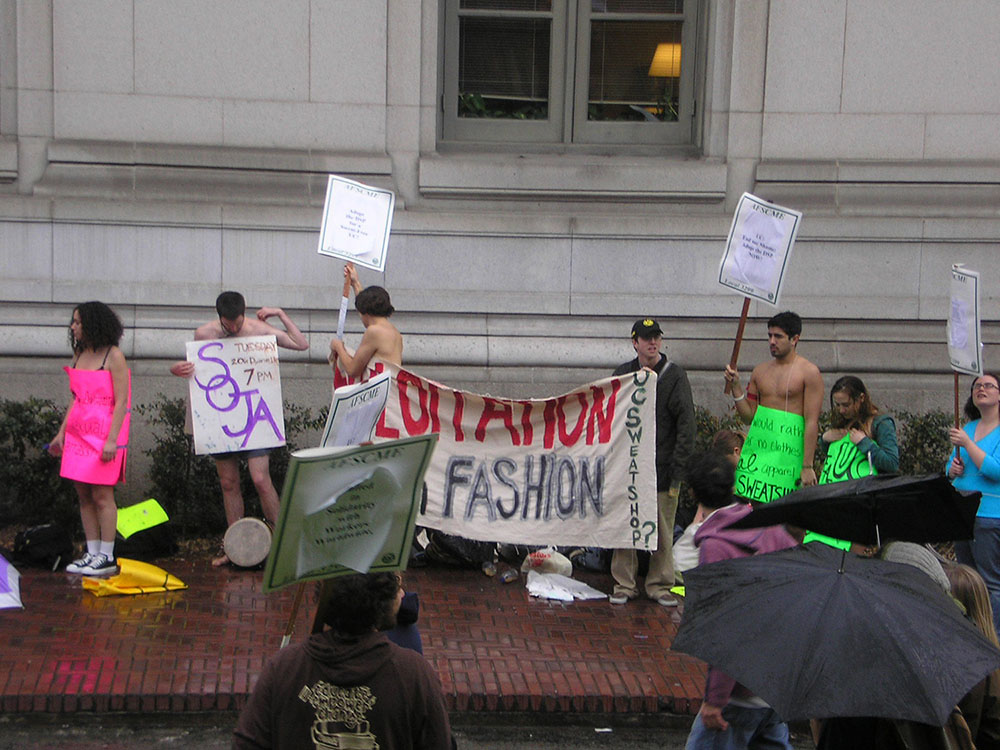
Sweatshops and Student Protests: Who’s Making Your Team Spirit?
Most of us don’t pay too much attention to where our favorite products are made. And certainly when you’re shopping for a college sweatshirt or ball cap to wear to a school football game, you probably don’t turn over the label, check who produced the item, and then research whether or not the company has fair labor practices. But for the members of USAS—United Students Against Sweatshops—that’s exactly what they do. The organization, which was founded in 1997, has waged countless battles against both apparel makers and other multinational corporations that do not meet what USAS considers fair working conditions and wages. USAS also focuses on ensuring safe and non-exploitative conditions as well as improved pay and benefits for campus workers, including dining hall staff, security guards, and adjuncts (USAS 2021).
How do clothes get made, and why are garment workers among the most commonly mistreated? In many cases, large apparel companies—including Nike, Lululemon, H&M, Urban Outfitters (owner of Anthropologie and Free People), Zara, and most other major brands—outsource their manufacturing to factories around the world. The apparel companies negotiate prices and schedules with the local manufacturers, and often push for the lowest possible manufacturing cost and the fastest schedule. In order to keep up with demand and manufacture the clothing at the required cost, the factories may pay their employees less, force them to work longer hours, and may maintain unsafe conditions. All of those tactics are associated with sweatshop practices (Chan 2019). In response to action from organizations like USAS, many apparel companies have undertaken steps to ensure that the factories they use are treating workers properly, but in reality, it is very difficult to know for sure. Often, the brands work through subcontractors and subsidiaries, and may not know exactly which factories are producing their products.
Members of USAS helped form the Worker Rights Consortium (WRC), which monitors working conditions for a wide array of companies and their affiliated factories. WRC conducts regular reviews of worldwide manufacturing facilities and publishes the results. The WRC also studies and reports on overall economic conditions and their effect on employment. For example, in 2020, as the global economy went through a rapid downturn, apparel companies demanded lower prices while they also reduced their orders, which put workers at risk of exploitation or job loss (Karim 2020).
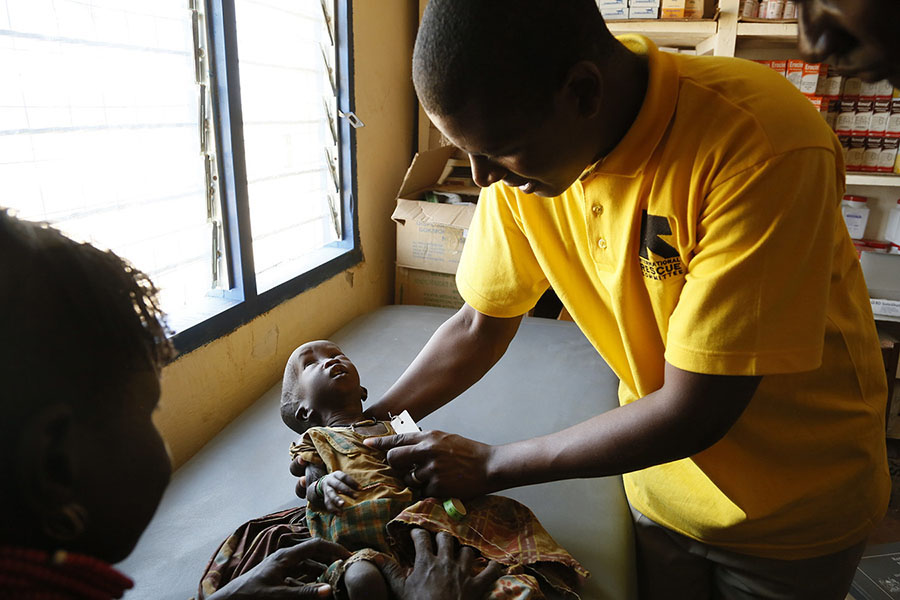
Figure 10.10 For this child, who is being assessed for malnutrition at a clinic in Kenya, risks associated with poverty and lack of food were exacerbated by a massive drought that hit the region. (Credit: DFID - UK Department for International Development/flickr)
Not surprisingly, the consequences of poverty are often also causes. The poor often experience inadequate healthcare, limited education, and the inaccessibility of birth control. But those born into these conditions are incredibly challenged in their efforts to break out since these consequences of poverty are also causes of poverty, perpetuating a cycle of disadvantage.
According to sociologists Neckerman and Torche (2007) in their analysis of global inequality studies, the consequences of poverty are many. Neckerman and Torche have divided them into three areas. The first, termed “the sedimentation of global inequality,” relates to the fact that once poverty becomes entrenched in an area, it is typically very difficult to reverse. As mentioned above, poverty exists in a cycle where the consequences and causes are intertwined. The second consequence of poverty is its effect on physical and mental health. Poor people face physical health challenges, including malnutrition and high infant mortality rates. Mental health is also detrimentally affected by the emotional stresses of poverty, with relative deprivation carrying the most robust effect. Again, as with the ongoing inequality, the effects of poverty on mental and physical health become more entrenched as time goes on. Neckerman and Torche’s third consequence of poverty is the prevalence of crime. Cross-nationally, crime rates are higher, particularly for violent crime, in countries with higher levels of income inequality (Fajnzylber 2002).
Slavery
While most of us are accustomed to thinking of slavery in terms of the antebellum South, modern day slavery goes hand-in-hand with global inequality. In short, slavery refers to any situation in which people are sold, treated as property, or forced to work for little or no pay. Just as in the pre-Civil War United States, these humans are at the mercy of their employers. Chattel slavery, the form of slavery once practiced in the American South, occurs when one person owns another as property. Child slavery, which may include child prostitution, is a form of chattel slavery. In debt bondage, or bonded labor, the poor pledge themselves as servants in exchange for the cost of basic necessities like transportation, room, and board. In this scenario, people are paid less than they are charged for room and board. When travel is required, they can arrive in debt for their travel expenses and be unable to work their way free, since their wages do not allow them to ever get ahead.
The global watchdog group Anti-Slavery International recognizes other forms of slavery: human trafficking (in which people are moved away from their communities and forced to work against their will), child domestic work and child labor, and certain forms of servile marriage, in which women are little more than enslaved people (Anti-Slavery International 2012).
9.4 Theoretical Perspectives on Social Stratification
Basketball is one of the highest-paying professional sports and stratification exists even among teams in the NBA. For example, the Toronto Raptors hands out the lowest annual payroll, while the New York Knicks reportedly pays the highest. Stephen Curry, a Golden State Warriors guard, is one of the highest paid athletes in the NBA, earning around $43 million a year (Sports Illustrated 2020), whereas the lowest paid player earns just over $200,000 (ESPN 2021). Even within specific fields, layers are stratified, members are ranked, and inequality exists.
In sociology, even an issue such as NBA salaries can be seen from various points of view. Functionalists will examine the purpose of such high salaries, conflict theorists will study the exorbitant salaries as an unfair distribution of money, and symbolic interactionists will describe how players display that wealth. Social stratification takes on new meanings when it is examined from different sociological perspectives—functionalism, conflict theory, and symbolic interactionism.
In sociology, the functionalist perspective examines how society’s parts operate. According to functionalism, different aspects of society exist because they serve a vital purpose. What is the function of social stratification?
In 1945, sociologists Kingsley Davis and Wilbert Moore published the Davis-Moore thesis, which argued that the greater the functional importance of a social role, the greater must be the reward. The theory posits that social stratification represents the inherently unequal value of different work. Certain tasks in society are more valuable than others (for example, doctors or lawyers). Qualified people who fill those positions are rewarded more than others.
According to Davis and Moore, a firefighter’s job is more important than, for instance, a grocery store cashier’s job. The cashier position does not require similar skill and training level as firefighting. Without the incentive of higher pay, better benefits, and increased respect, why would someone be willing to rush into burning buildings? If pay levels were the same, the firefighter might as well work as a grocery store cashier and avoid the risk of firefighting. Davis and Moore believed that rewarding more important work with higher levels of income, prestige, and power encourages people to work harder and longer.
Davis and Moore stated that, in most cases, the degree of skill required for a job determines that job’s importance. They noted that the more skill required for a job, the fewer qualified people there would be to do that job. Certain jobs, such as cleaning hallways or answering phones, do not require much skill. Therefore, most people would be qualified for these positions. Other work, like designing a highway system or delivering a baby, requires immense skill limiting the number of people qualified to take on this type of work.
Many scholars have criticized the Davis-Moore thesis. In 1953, Melvin Tumin argued that it does not explain inequalities in the education system or inequalities due to race or gender. Tumin believed social stratification prevented qualified people from attempting to fill roles (Tumin 1953).
Figure 9.13 These people are protesting a decision made by Tennessee Technological University in Cookeville, Tennessee, to lay off custodians and outsource the jobs to a private firm to avoid paying employee benefits. Private job agencies often pay lower hourly wages. Is the decision fair? (Credit: Brian Stansberry/Wikimedia Commons)
Conflict theorists are deeply critical of social stratification, asserting that it benefits only some people, not all of society. For instance, to a conflict theorist, it seems wrong that a basketball player is paid millions for an annual contract while a public school teacher may earn $35,000 a year. Stratification, conflict theorists believe, perpetuates inequality. Conflict theorists try to bring awareness to inequalities, such as how a rich society can have so many poor members.
Many conflict theorists draw on the work of Karl Marx. During the nineteenth-century era of industrialization, Marx believed social stratification resulted from people’s relationship to production. People were divided into two main groups: they either owned factories or worked in them. In Marx’s time, bourgeois capitalists owned high-producing businesses, factories, and land, as they still do today. Proletariats were the workers who performed the manual labor to produce goods. Upper-class capitalists raked in profits and got rich, while working-class proletariats earned skimpy wages and struggled to survive. With such opposing interests, the two groups were divided by differences of wealth and power. Marx believed workers experience deep alienation, isolation and misery resulting from powerless status levels (Marx 1848). Marx argued that proletariats were oppressed by the bourgeoisie.
Today, while working conditions have improved, conflict theorists believe that the strained working relationship between employers and employees still exists. Capitalists own the means of production, and a system is in place to make business owners rich and keep workers poor. According to conflict theorists, the resulting stratification creates class conflict.
Symbolic interactionism uses everyday interactions of individuals to explain society as a whole. Symbolic interactionism examines stratification from a micro-level perspective. This analysis strives to explain how people’s social standing affects their everyday interactions.
In most communities, people interact primarily with others who share the same social standing. It is precisely because of social stratification that people tend to live, work, and associate with others like themselves, people who share their same income level, educational background, class traits and even tastes in food, music, and clothing. The built-in system of social stratification groups people together. This is one of the reasons why it was rare for a royal prince like England’s Prince William to marry a commoner.
Symbolic interactionists also note that people’s appearance reflects their perceived social standing. As discussed above, class traits seen through housing, clothing, and transportation indicate social status, as do hairstyles, taste in accessories, and personal style. Symbolic interactionists also analyze how individuals think of themselves or others interpretation of themselves based on these class traits.
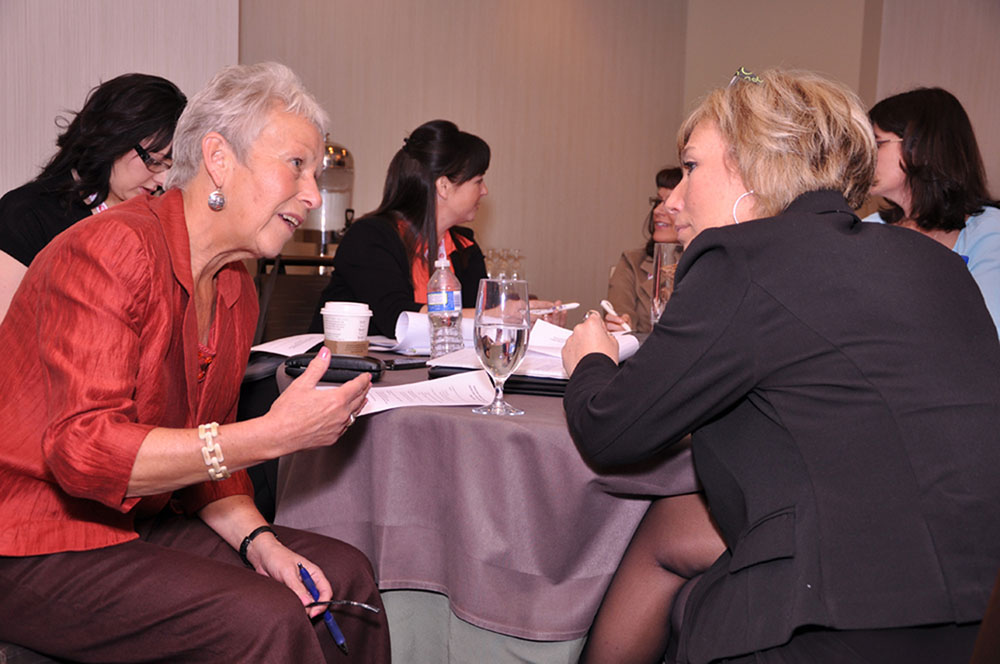
Figure 9.14 (a) A group of construction workers on the job site, and (b) businesspeople in a meeting. What categories of stratification do these construction workers share? How do construction workers differ from executives or custodians? Who is more skilled? Who has greater prestige in society? (Credit: (a) Wikimedia Commons; Photo (b) Chun Kit/flickr)
To symbolically communicate social standing, people often engage in conspicuous consumption, which is the purchase and use of certain products to make a social statement about status. Carrying pricey but eco-friendly water bottles could indicate a person’s social standing, or what they would like others to believe their social standing is. Some people buy expensive trendy sneakers even though they will never wear them to jog or play sports. A $17,000 car provides transportation as easily as a $100,000 vehicle, but the luxury car makes a social statement that the less expensive car can’t live up to. All these symbols of stratification are worthy of examination by an interactionist.
11.4 Intergroup Relationships
OpenStax · 11.4 Intergroup Relationships ↗ Instructional page including learning objectives, examples, figures, source tables and questions. Site navigation and embedded media players are omitted; source media links remain available.
Learning Objectives
By the end of this section, you should be able to:
Explain different intergroup relations in terms of their relative levels of tolerance
Give historical and/or contemporary examples of each type of intergroup relation
Intergroup relations (relationships between different groups of people) range along a spectrum between tolerance and intolerance. The most tolerant form of intergroup relations is pluralism, in which no distinction is made between minority and majority groups, but instead there’s equal standing. At the other end of the continuum are amalgamation, expulsion, and even genocide—stark examples of intolerant intergroup relations.
Pluralism
Pluralism is represented by the ideal of the United States as a “salad bowl”: a great mixture of different cultures where each culture retains its own identity and yet adds to the flavor of the whole. True pluralism is characterized by mutual respect on the part of all cultures, both dominant and subordinate, creating a multicultural environment of acceptance. In reality, true pluralism is a difficult goal to reach. In the United States, the mutual respect required by pluralism is often missing, and the nation’s past model of a melting pot posits a society where cultural differences aren’t embraced as much as erased.
Assimilation describes the process by which a minority individual or group gives up its own identity by taking on the characteristics of the dominantculture. In the United States, which has a history of welcoming and absorbing immigrants from different lands, assimilation has been a function of immigration.
Figure 11.6 — 11.4 Intergroup Relationships
Figure 11.6 For many immigrants to the United States, the Statue of Liberty is a symbol of freedom and a new life. Unfortunately, they often encounter prejudice and discrimination. (Credit: Mark Heard/flickr)
Most people in the United States have immigrant ancestors. In relatively recent history, between 1890 and 1920, the United States became home to around 24 million immigrants. In the decades since then, further waves of immigrants have come to these shores and have eventually been absorbed into U.S. culture, sometimes after facing extended periods of prejudice and discrimination. Assimilation may lead to the loss of the minority group’s cultural identity as they become absorbed into the dominantculture, but assimilation has minimal to no impact on the majority group’s cultural identity.
Some groups may keep only symbolic gestures of their original ethnicity. For instance, many Irish Americans may celebrate Saint Patrick’s Day, many Hindu Americans enjoy a Diwali festival, and many Mexican Americans may celebrate Cinco de Mayo (a May 5 acknowledgment of the Mexican victory over the French Empire at the Battle of Puebla). However, for the rest of the year, other aspects of their originating culture may be forgotten.
Assimilation is antithetical to the “salad bowl” created by pluralism; rather than maintaining their own cultural flavor, subordinate cultures give up their own traditions in order to conform to their new environment. Sociologists measure the degree to which immigrants have assimilated to a new culture with four benchmarks: socioeconomic status, spatial concentration, language assimilation, and intermarriage. When faced with racial and ethnic discrimination, it can be difficult for new immigrants to fully assimilate. Language assimilation, in particular, can be a formidable barrier, limiting employment and educational options and therefore constraining growth in socioeconomic status.
Amalgamation
Amalgamation is the process by which a minority group and a majority group combine to form a new group. Amalgamation creates the classic “melting pot” analogy; unlike the “salad bowl,” in which each culture retains its individuality, the “melting pot” ideal sees the combination of cultures that results in a new culture entirely.
Amalgamation in the form of miscegenation is achieved through intermarriage between races. In the United States, antimiscegenation laws, which criminalized interracial marriage, flourished in the South during the Jim Crow era. It wasn’t until 1967’s Loving v. Virginia that the last antimiscegenation law was struck from the books, making these laws unconstitutional.
Genocide
Genocide, the deliberate annihilation of a targeted (usually subordinate) group, is the most toxic intergroup relationship. Historically, we can see that genocide has included both the intent to exterminate a group and the function of exterminating of a group, intentional or not.
Possibly the most well-known case of genocide is Hitler’s attempt to exterminate the Jewish people in the first part of the twentieth century. Also known as the Holocaust, the explicit goal of Hitler’s “Final Solution” was the eradication of European Jewish people, as well as the destruction of other minority groups such as Catholics, people with disabilities, LGBTQ people, and Romani people, then disparagingly referred to as "gypsies". With forced emigration, concentration camps, and mass executions in gas chambers, Hitler’s Nazi regime was responsible for the deaths of 12 million people, 6 million of whom were Jewish. Hitler’s intent was clear, and the high Jewish death toll certainly indicates that Hitler and his regime committed genocide. But how do we understand genocide that is not so overt and deliberate?
The treatment of the Native Americans by the European colonizers is an example of genocide committed against indigenous people. Some historians estimate that Native American populations dwindled from approximately 12 million people in the year 1500 to barely 237,000 by the year 1900 (Lewy 2004). European settlers coerced American Indians off their own lands, often causing thousands of deaths in forced removals, such as occurred in the Cherokee or Potawatomi Trail of Tears. Settlers also enslaved Native Americans and forced them to give up their religious and cultural practices. But the major cause of Native American death was neither slavery nor war nor forced removal: it was the introduction of European diseases and Native American lack of immunity to them. Smallpox, diphtheria, and measles flourished among indigenous American tribes who had no exposure to the diseases and no ability to fight them. Quite simply, these diseases decimated the tribes. The use of diseases as weapon was most likely unintentional in some cases and intentional in others. For example, during the Seven Years War, the British gave smallpox-infected blankets to the Native tribes in order to "reduce them," and this and similar practices likely continued throughout the centuries-long assault on the Native American people.
Genocide is not a just a historical concept; it is practiced even in the twenty- first century. For example, ethnic and geographic conflicts in the Darfur region of Sudan have led to hundreds of thousands of deaths. As part of an ongoing land conflict, the Sudanese government and their state-sponsored Janjaweed militia have led a campaign of killing, forced displacement, and systematic rape of Darfuri people. Although a treaty was signed in 2011, the peace is fragile.
Expulsion
Expulsion refers to a subordinate group being forced, by a dominant group, to leave a certain area or country. As seen in the examples of the Trail of Tears and the Holocaust, expulsion can be a factor in genocide. However, it can also stand on its own as a destructive group interaction. Expulsion has often occurred historically with an ethnic or racial basis. In the United States, President Franklin D. Roosevelt issued Executive Order 9066 in 1942, after the Japanese government’s attack on Pearl Harbor. The Order authorized the establishment of internment camps for anyone with as little as one-eighth Japanese ancestry (i.e., one great-grandparent who was Japanese). Over 120,000 legal Japanese residents and Japanese U.S. citizens, many of them children, were held in these camps for up to four years, despite the fact that there was never any evidence of collusion or espionage. (In fact, many Japanese Americans continued to demonstrate their loyalty to the United States by serving in the U.S. military during the War.) In the 1990s, the U.S. executive branch issued a formal apology for this expulsion; reparation efforts continue today.
Segregation refers to the physical separation of two groups, particularly in residence, but also in workplace and social functions. It is important to distinguish between de juresegregation (segregation that is enforced by law) and de factosegregation (segregation that occurs without laws but because of other factors). A stark example of de juresegregation is the apartheid movement of South Africa, which existed from 1948 to 1994. Under apartheid, Black South Africans were stripped of their civil rights and forcibly relocated to areas that segregated them physically from their White compatriots. Only after decades of degradation, violent uprisings, and international advocacy was apartheid finally abolished.
De juresegregation occurred in the United States for many years after the Civil War. During this time, many former Confederate states passed Jim Crow laws that required segregated facilities for Black and White people. These laws were codified in 1896’s landmark Supreme Court case Plessy v. Ferguson, which stated that “separate but equal” facilities were constitutional. For the next five decades, Black people were subjected to legalized discrimination, forced to live, work, and go to school in separate—but unequal—facilities. It wasn’t until 1954 and the Brown v. Board of Education case that the Supreme Court declared that “separate educational facilities are inherently unequal,” thus ending de juresegregation in the United States.
Figure 11.7 — 11.4 Intergroup Relationships
Figure 11.7 In the “Jim Crow” South, it was legal to have “separate but equal” facilities for Black people and White people. (Credit: Library of Congress/Wikimedia Commons)
De factosegregation, however, cannot be abolished by any court mandate. Few institutions desegregated as a result of Brown; in fact, government and even military intervention was necessary to enforce the ruling, and it took the Civil Rights Act and other laws to formalize the equality. Segregation is still alive and well in the United States, with different racial or ethnic groups often segregated by neighborhood, borough, or parish. Sociologists use segregation indices to measure racial segregation of different races in different areas. The indices employ a scale from zero to 100, where zero is the most integrated and 100 is the least. In the New York metropolitan area, for instance, the Black-White segregation index was seventy-nine for the years 2005–2009. This means that 79 percent of either Black or White people would have to move in order for each neighborhood to have the same racial balance as the whole metro region (Population Studies Center 2010).