Residential segregation separates groups across neighborhoods through historical and current housing markets, policy, discrimination, and resource differences.
Residential segregation separates groups across neighborhoods through historical and current housing markets, policy, discrimination, and resource differences. Place affects exposure to pollution, heat, violence, unsafe housing, food access, transport, and health services. Neighborhood safety can influence physical activity and chronic stress, while social cohesion and collective efficacy can support mutual protection. Environmental justice examines unequal environmental burdens and unequal participation in decisions about them. A polluted neighborhood is not explained by residents’ preferences alone when choice is constrained by cost or exclusion. Distinguish compositional effects of who lives there from contextual effects of the setting, recognizing that residential selection can confound comparisons.
Worked question. Asthma admissions are higher near a freight corridor. What evidence would help distinguish an environmental mechanism from differences in residents’ baseline characteristics?
Measure pollutant exposure, age, prior health, housing, and care access rather than relying only on neighborhood labels. A change in freight routing or emissions policy can provide a stronger comparison if affected and comparison areas had similar pretrends. Follow movers and stable residents to assess selection. Environmental justice also asks who bears the exposure and who participates in decisions.
Figure 20.10 Percent of U.S. Population. As this chart illustrates, the shift from rural to urban living in the United States has been dramatic and continuous. (Credit: the U.S. Census Bureau)
20.3 The Environment and Society — figures and tables
Figure 20.13 — 20.3 The Environment and Society
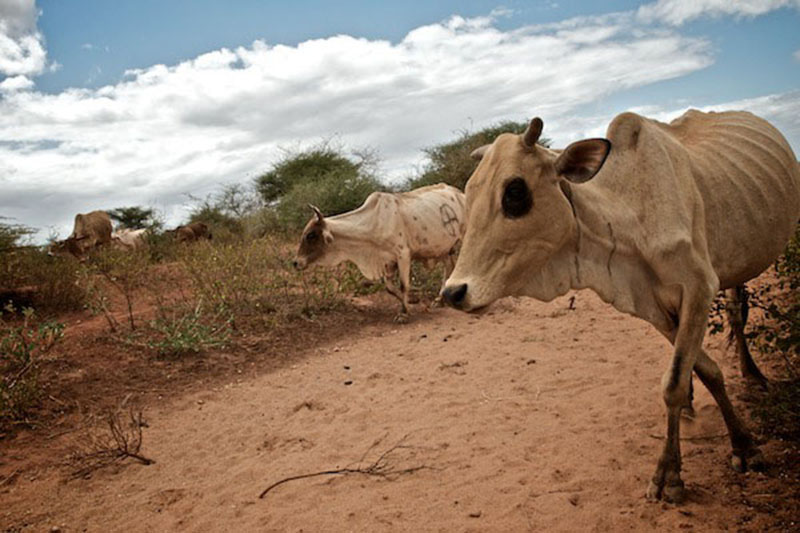
Figure 20.13 Too little land for grazing means starving cattle. (Credit: newbeatphoto/flickr)
Tonja R. Conerly, Kathleen Holmes, and Asha Lal Tamang, Introduction Sociology 3E, OpenStax. · CC BY-NC-SA 4.0
· Original image ↗ · Access for free ↗Figure 20.14 — 20.3 The Environment and Society
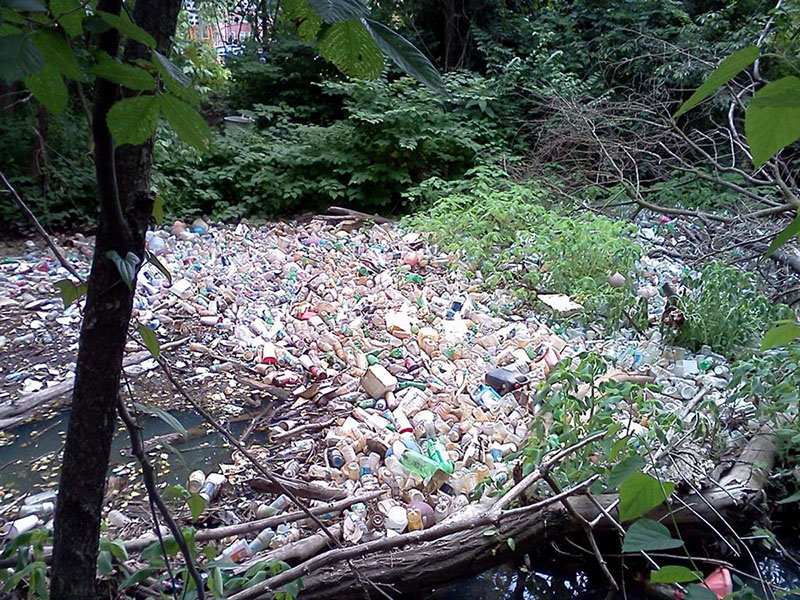
Figure 20.14 Where should garbage go when you’ve run out of room? This is a question that is increasingly pressing the planet. (Credit: Department of Environmental Protection Recycling/flickr)
Tonja R. Conerly, Kathleen Holmes, and Asha Lal Tamang, Introduction Sociology 3E, OpenStax. · CC BY-NC-SA 4.0
· Original image ↗ · Access for free ↗Figure 20.15 — 20.3 The Environment and Society
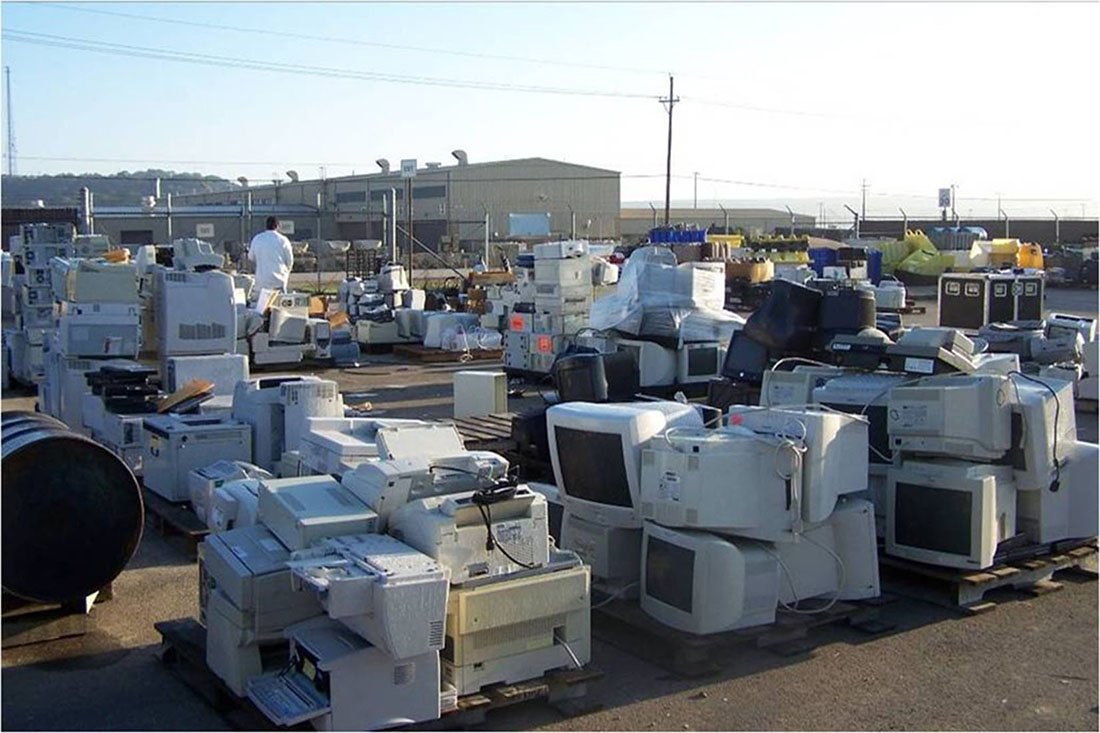
Figure 20.15 A parking lot filled with electronic waste, known as e-waste. (Credit: U.S. Army Environmental Command/flickr)
Tonja R. Conerly, Kathleen Holmes, and Asha Lal Tamang, Introduction Sociology 3E, OpenStax. · CC BY-NC-SA 4.0
· Original image ↗ · Access for free ↗Figure 20.16 — 20.3 The Environment and Society
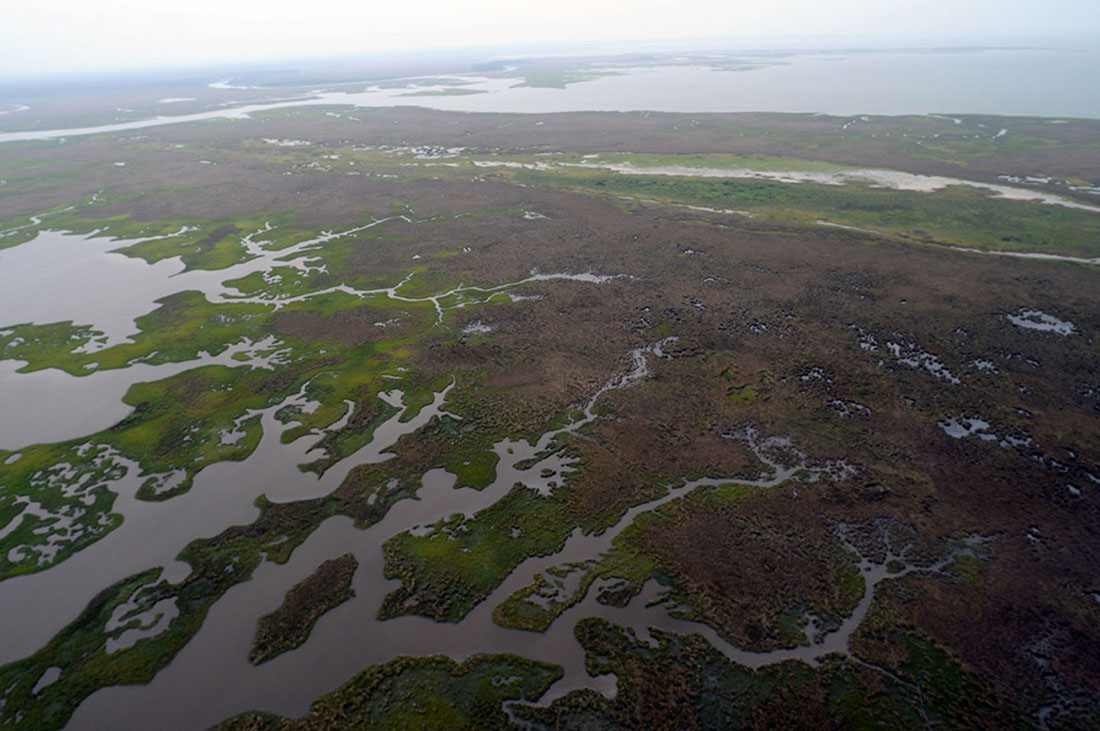
Figure 20.16 An aerial view of the Gulf Coast, taken in May 2010, illustrates the damage done by the BP Deep Water Horizon spill. (Credit: Jeff Warren/flickr)
Tonja R. Conerly, Kathleen Holmes, and Asha Lal Tamang, Introduction Sociology 3E, OpenStax. · CC BY-NC-SA 4.0
· Original image ↗ · Access for free ↗Figure 20.17 — 20.3 The Environment and Society
Figure 20.17 Oil on the gulf shore beaches caused great destruction, killing marine and land animals and devastating local business. (Credit: AV8ter/flickr)
11.4 Intergroup Relationships — figures and tables
Figure 11.6 — 11.4 Intergroup Relationships
Figure 11.6 For many immigrants to the United States, the Statue of Liberty is a symbol of freedom and a new life. Unfortunately, they often encounter prejudice and discrimination. (Credit: Mark Heard/flickr)
Tonja R. Conerly, Kathleen Holmes, and Asha Lal Tamang, Introduction Sociology 3E, OpenStax. · CC BY-NC-SA 4.0
· Original image ↗ · Access for free ↗Figure 11.7 — 11.4 Intergroup Relationships
Figure 11.7 In the “Jim Crow” South, it was legal to have “separate but equal” facilities for Black people and White people. (Credit: Library of Congress/Wikimedia Commons)
19.3 Health in the United States — figures and tables
Figure 19.4 — 19.3 Health in the United States
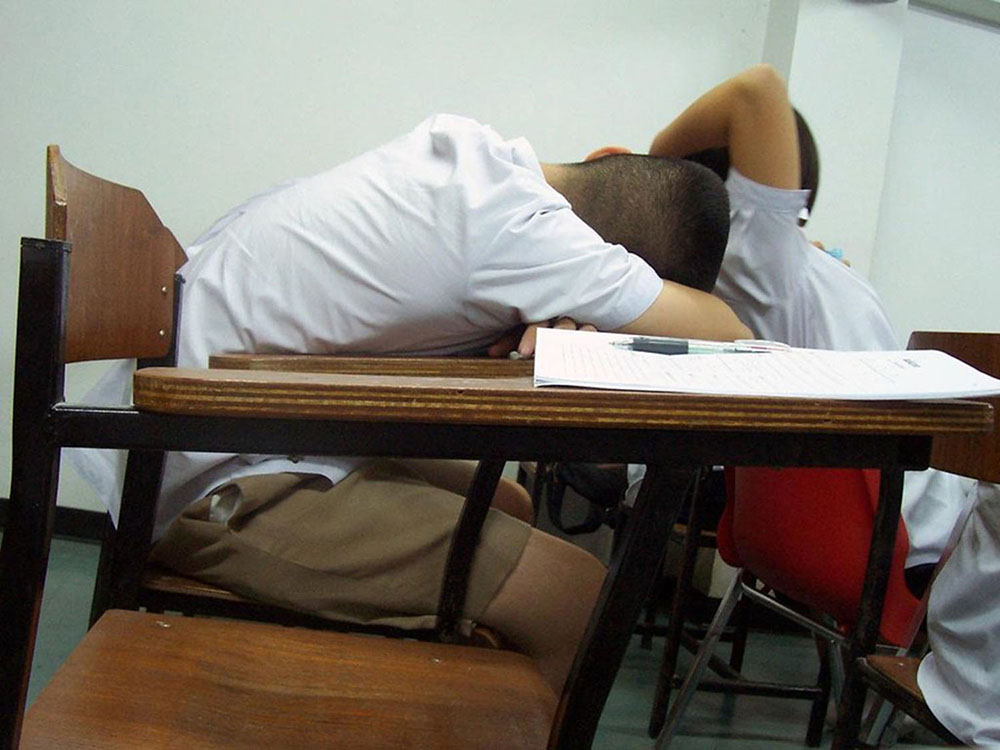
Figure 19.4 Many people fail to get enough sleep. But is insomnia a disease that should be cured with medication? (Credit: Wikimedia Commons)
Tonja R. Conerly, Kathleen Holmes, and Asha Lal Tamang, Introduction Sociology 3E, OpenStax. · CC BY-NC-SA 4.0
· Original image ↗ · Access for free ↗Figure 19.5 — 19.3 Health in the United States
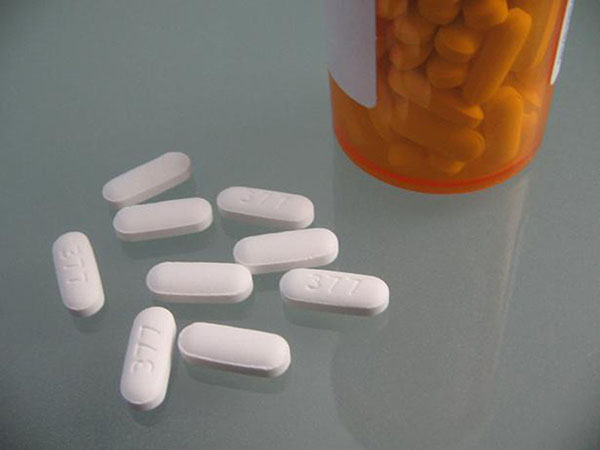
Figure 19.5 Medication is a common option for children with ADHD. (Credit: Deviation56/Wikimedia Commons)
Tonja R. Conerly, Kathleen Holmes, and Asha Lal Tamang, Introduction Sociology 3E, OpenStax. · CC BY-NC-SA 4.0
· Original image ↗ · Access for free ↗Figure 19.6 — 19.3 Health in the United States
Figure 19.6 The accessibility sign indicates that people with disabilities can access the facility. The Americans with Disabilities Act requires that access be provided to everyone. (Credit: Ltljltlj/Wikimedia Commons)
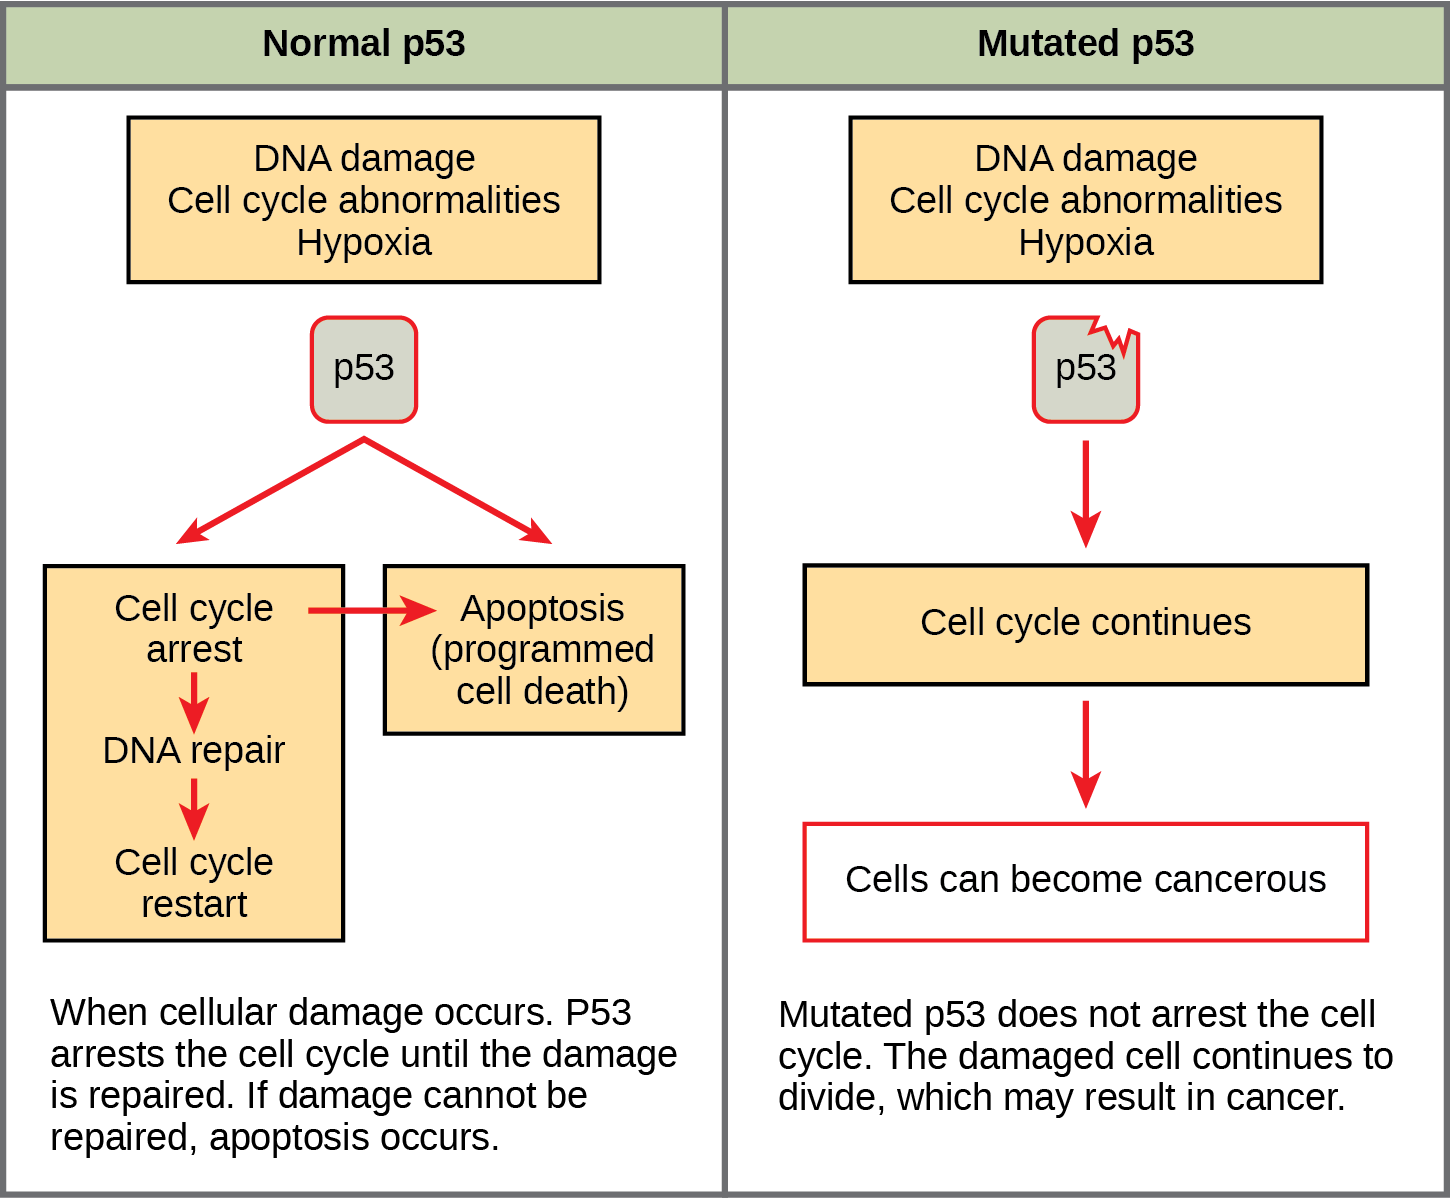
Figure 10.16 The role of normal p53 is to monitor DNA and the supply of oxygen (hypoxia is a condition of reduced oxygen supply). If damage is detected, p53 triggers repair mechanisms. If repairs are unsuccessful, p53 signals apoptosis. A cell with an abnormal p53 protein cannot repair damaged DNA and thus cannot signal apoptosis. Cells with abnormal p53 can become cancerous. (credit: modification of work by Thierry Soussi)
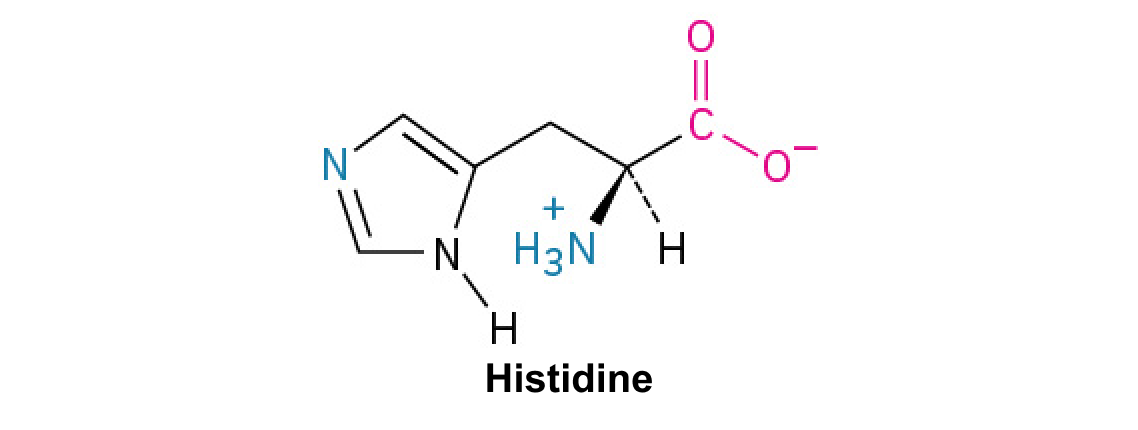
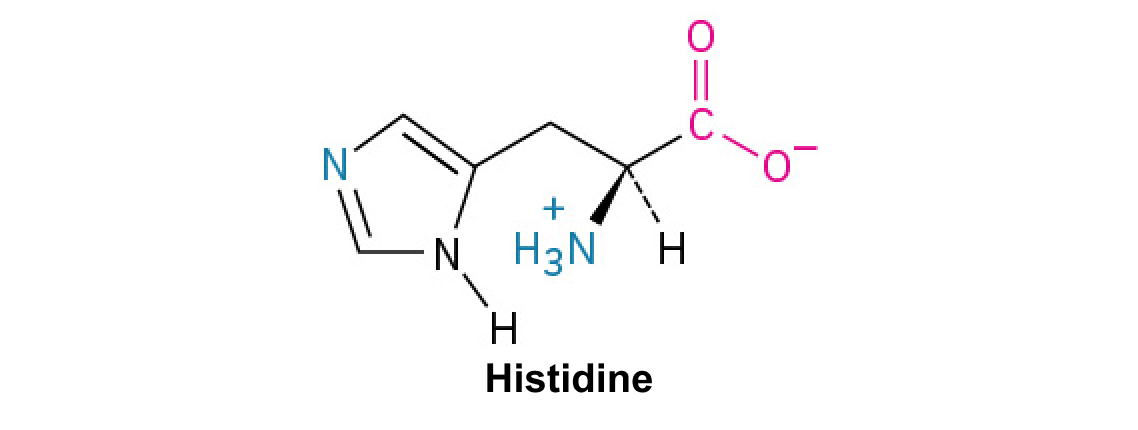
A nitrogen-containing functional group. A free amino acid’s amino group is typically protonated (NH₃⁺) near physiological pH; proline’s ring nitrogen is an exception to this formula.
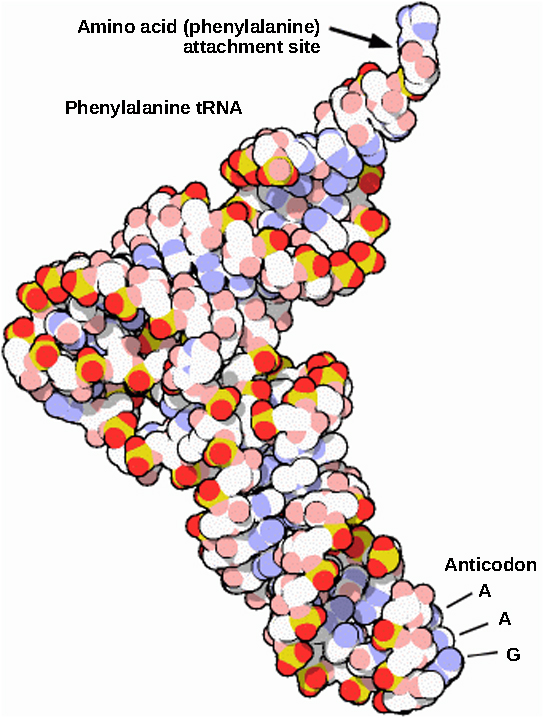
Figure 15.14 This is a space-filling model of a tRNA molecule that adds the amino acid phenylalanine to a growing polypeptide chain. The anticodon AAG binds the Codon UUC on the mRNA. The amino acid phenylalanine is attached to the other end of the tRNA.
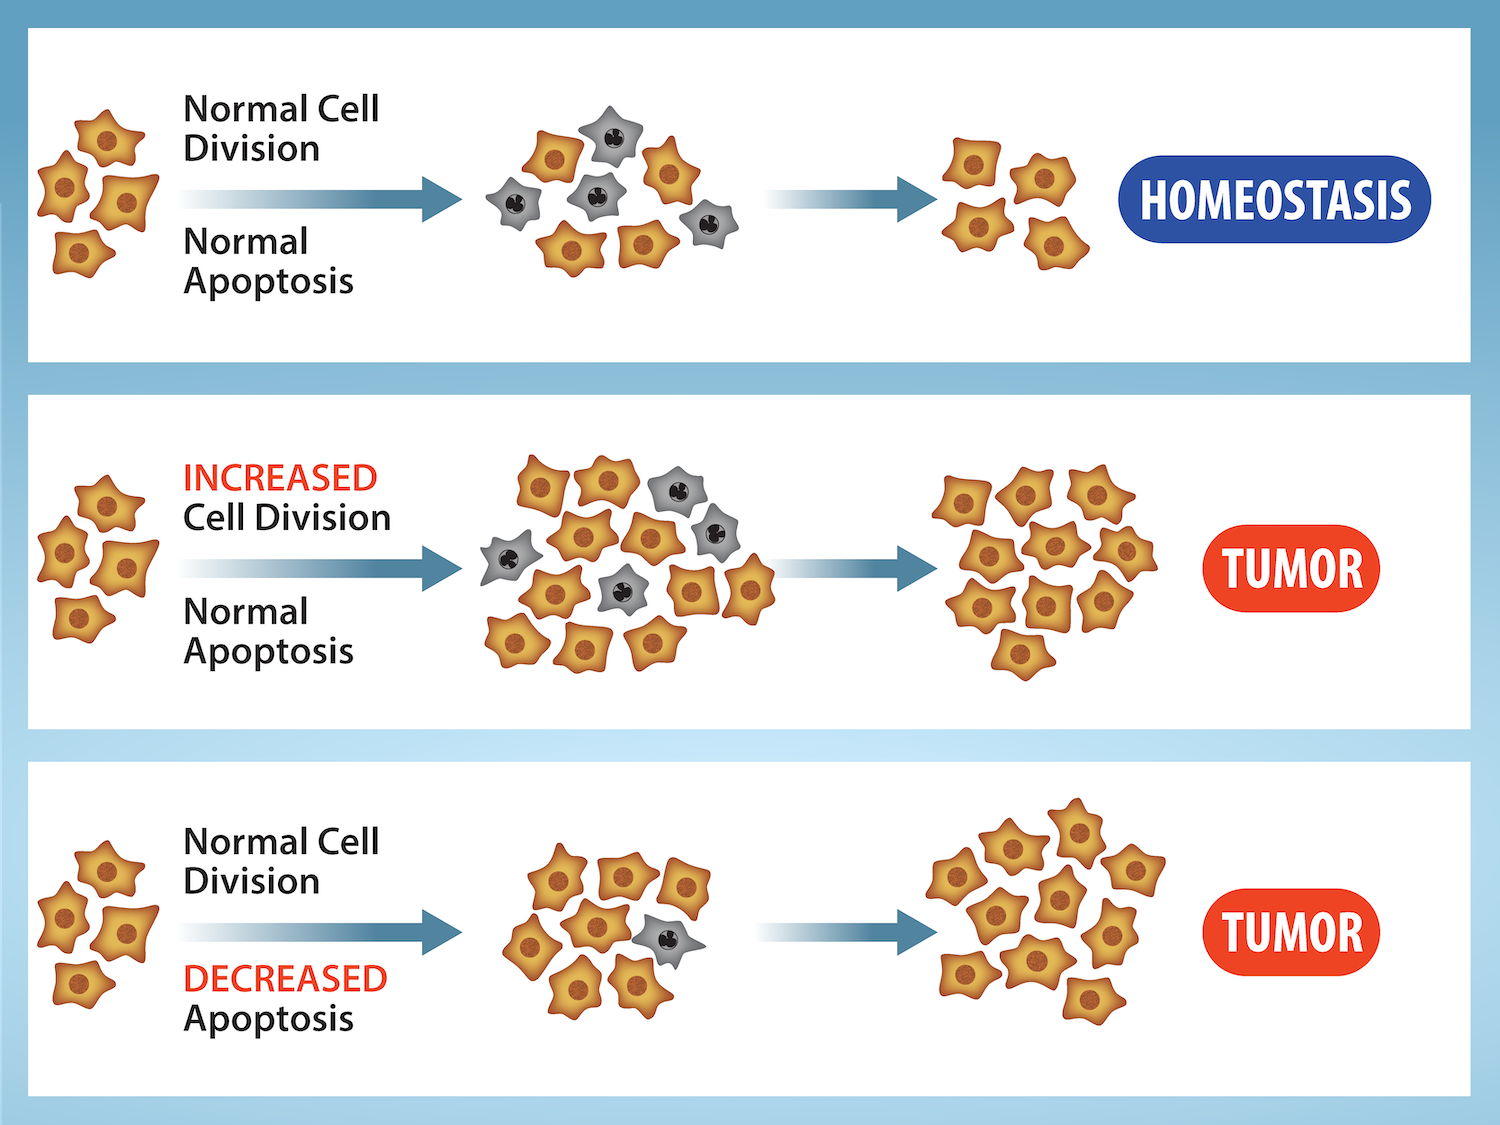
Figure 10.15 Cell Division and Apoptosis. In an adult organism, normal cell division is balanced by apoptosis (programmed cell death) to maintain a constant cell number in homeostasis. Either an increase in cell division or a decrease in apoptosis leads an increase in the number of cells and tumor formation. Credit: Rao, A. and Ryan, K. Department of Biology, Texas A&M University.
Rao, A. and Ryan, K. Department of Biology, Texas A&M University. Mary Ann Clark, Matthew Douglas, and Jung Choi, Biology 2e, OpenStax. · CC BY-NC-SA 4.0
· Original image ↗ · Access for free ↗
Figure 15.4 This figure shows the genetic code for translating each nucleotide triplet in mRNA into an amino acid or a termination signal in a protein. (credit: modification of work by NIH)
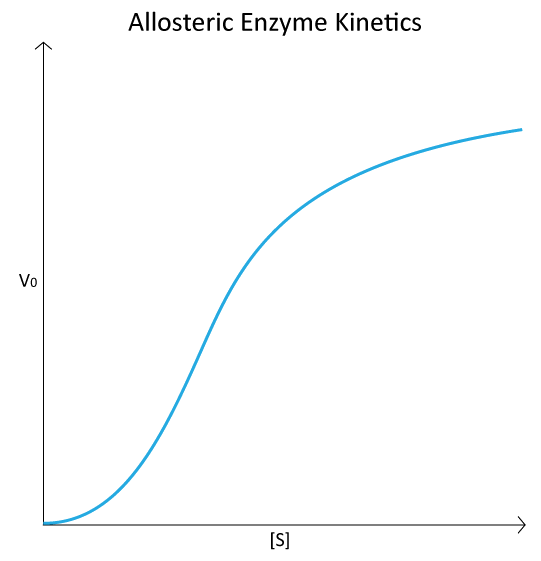
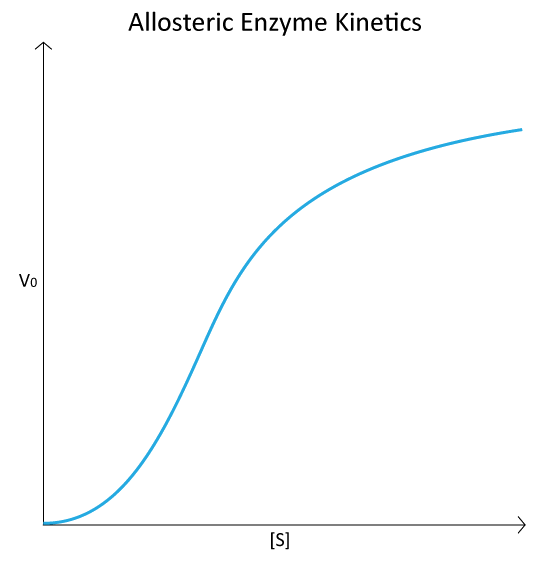
Figure 4.44 - Kinetic profile of an allosteric enzyme whose activity is controlled by a homotropic effector. Image by Aleia Kim
Kevin Ahern, Indira Rajagopal, and Taralyn Tan, Biochemistry Free For All, Oregon State University, via Biology LibreTexts. Image by Aleia Kim · CC BY-NC-SA 4.0
· Original image ↗ · Access for free ↗
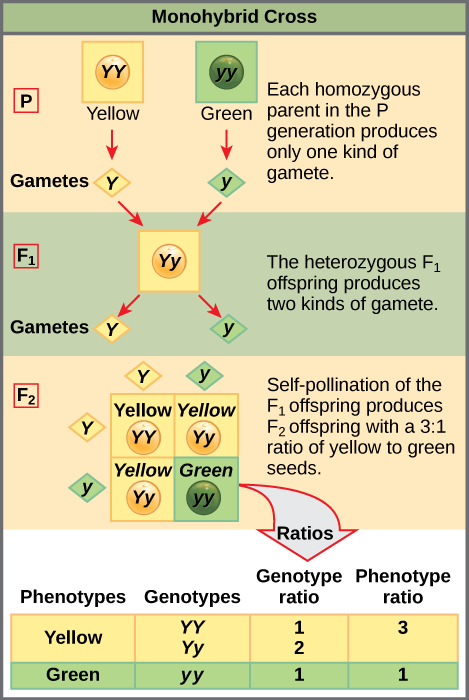
Figure 12.4 In the P generation, pea plants that are true-breeding for the dominant yellow phenotype are crossed with plants with the recessive green phenotype. This cross produces F 1 heterozygotes with a yellow phenotype. Punnett square analysis can be used to predict the genotypes of the F 2 generation.
An electrical property that can be positive or negative. Opposite charges attract and like charges repel; net charge is the sum of all charges on a particle.
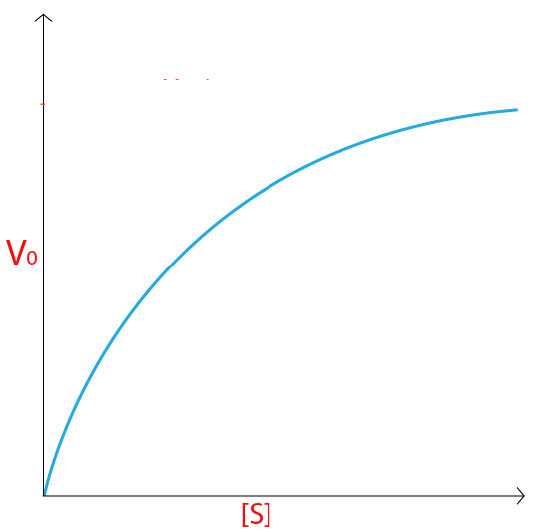
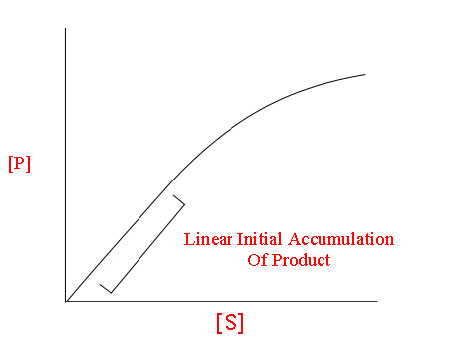
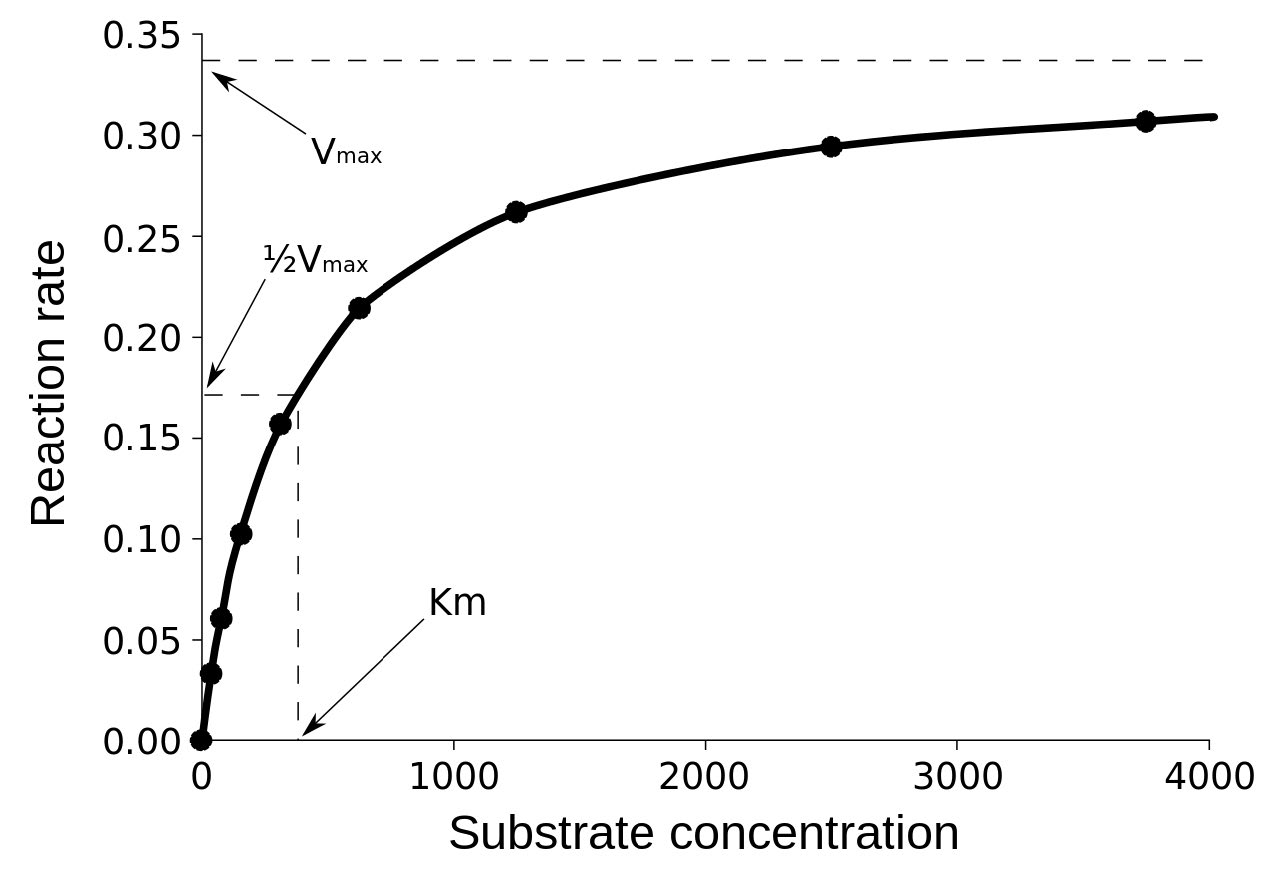
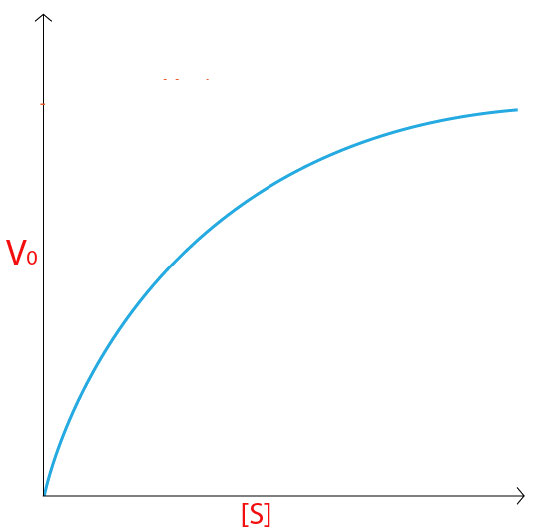
Figure 4.18 - Kinetics of an enzyme obeying Michaelis-Menten kinetics. Image by Aleia Kim
Kevin Ahern, Indira Rajagopal, and Taralyn Tan, Biochemistry Free For All, Oregon State University, via Biology LibreTexts. Image by Aleia Kim · CC BY-NC-SA 4.0
· Original image ↗ · Access for free ↗
ethnicity
Shared cultural history, ancestry, language, or affiliation.
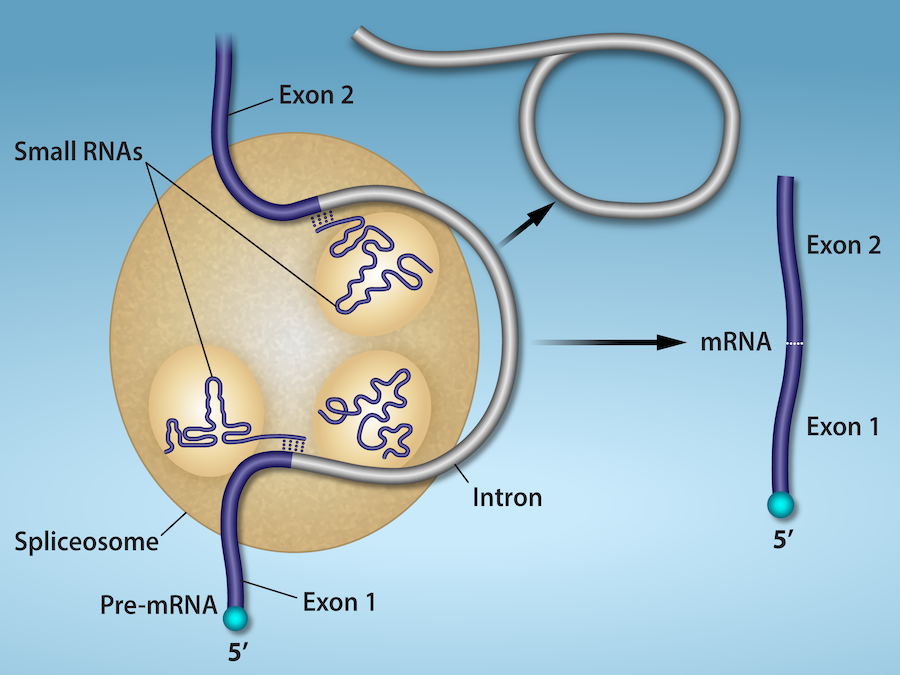
Figure 15.11 Eukaryotic pre-mRNA processing. In addition to 5’ Cap and 3’ Poly-A Tail addition, introns must be precisely removed and exons joined to generate a functional mRNA. Nucleotides upstream (towards the 5’cap) of the translation START codon are part of the 5’ untranslated region (5’ UTR). Nucleotides downstream (towards 3’end) of the STOP codon form the 3’ UTR. Both 5’ and 3’ UTRs are important for regulating translation initiation and mRNA stability. Credit: Rao, A., Ryan, K. Fletcher, S. and Tag, A. Department of Biology, Texas A&M University.
Rao, A., Ryan, K. Fletcher, S. and Tag, A. Department of Biology, Texas A&M University.; Mary Ann Clark, Matthew Douglas, and Jung Choi, Biology 2e, OpenStax. · CC BY-NC-SA 4.0
· Original image ↗ · Access for free ↗
Figure 15.10 A generalized promoter of a gene transcribed by RNA polymerase II is shown. Transcription factors recognize the promoter. RNA polymerase II then binds and forms the transcription initiation complex.
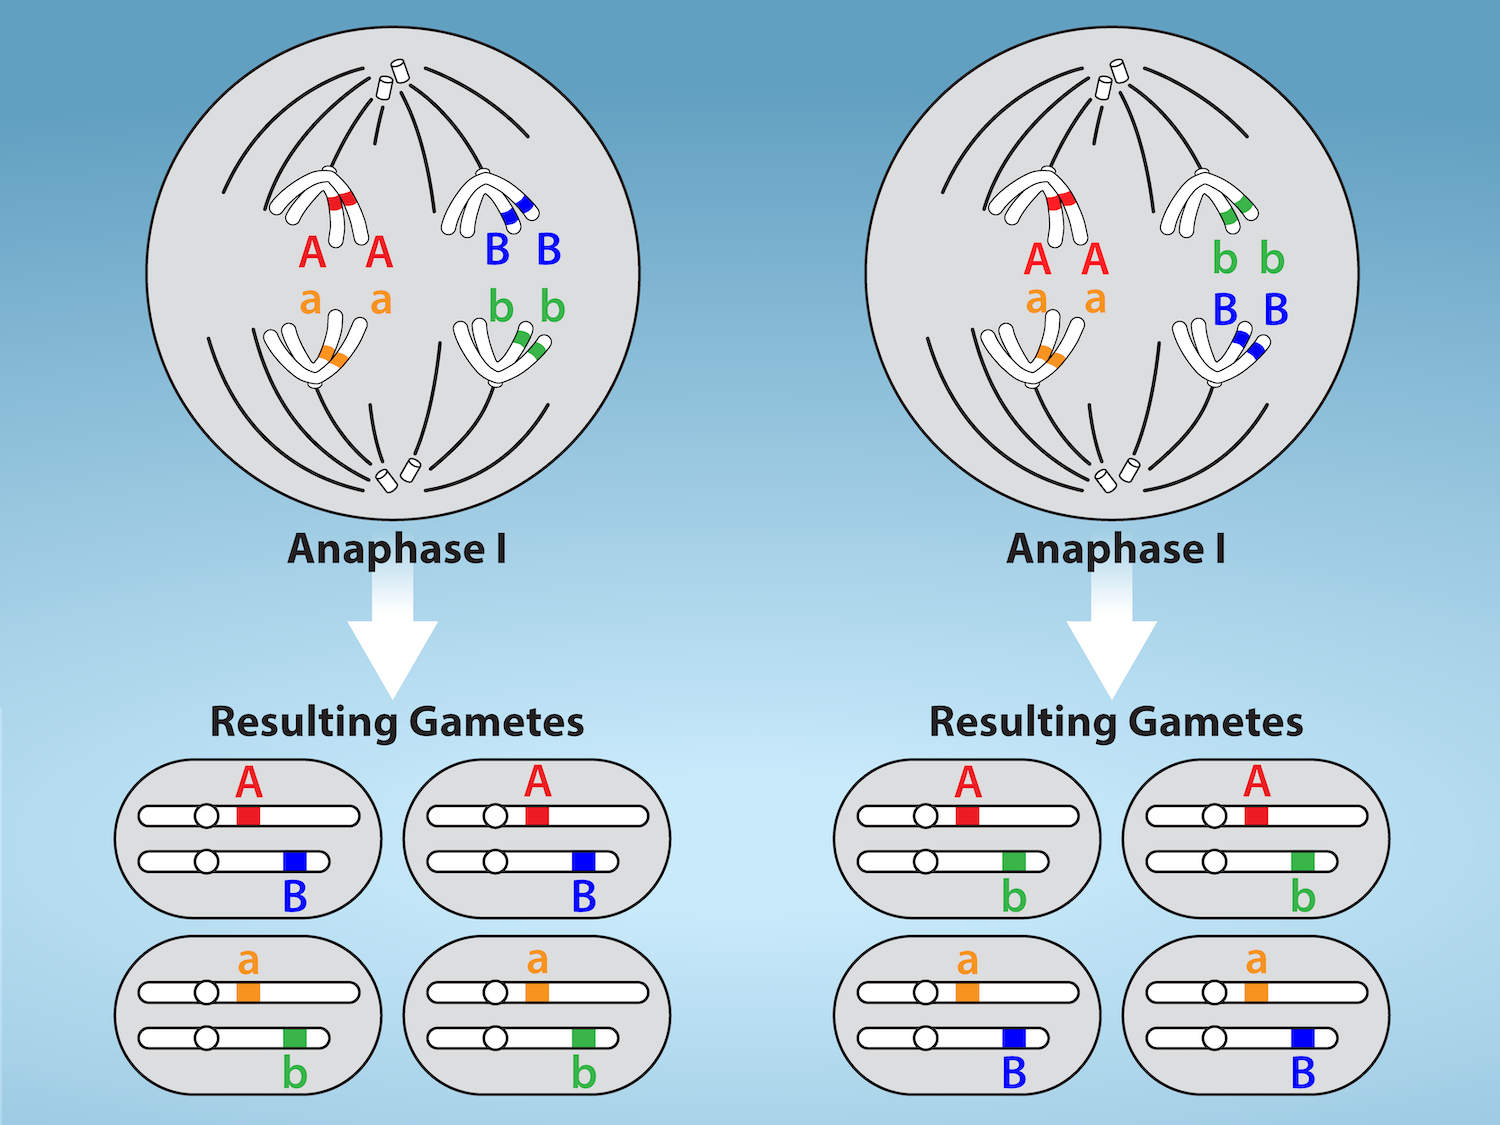
Figure 11.5 Random, independent assortment during metaphase I is demonstrated by considering a cell with a set of two chromosomes (n = 2).
There are two possible homologous chromosome arrangements at the equatorial plane in metaphase I, that are then separated during anaphase I.
The total possible number of different gametes is 2 n , where n equals the number of chromosomes in a set. In this example, there are four possible
genetic combinations for the gametes. With n = 23 in human cells, there are over eight million possible combinations of paternal and maternal
chromosomes. Credit: Rao, A.and Fletcher, S. Department of Biology, Texas A&M University.
Figure 12.4 In the P generation, pea plants that are true-breeding for the dominant yellow phenotype are crossed with plants with the recessive green phenotype. This cross produces F 1 heterozygotes with a yellow phenotype. Punnett square analysis can be used to predict the genotypes of the F 2 generation.
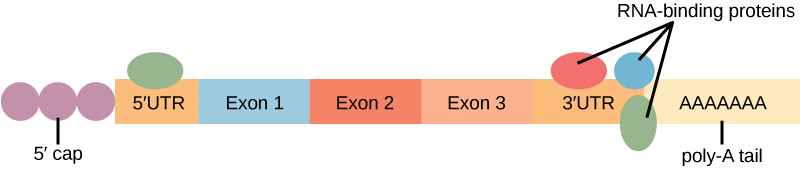
Figure 16.13 RNA-binding proteins. The protein-coding region of this processed mRNA is flanked by 5' and 3' untranslated regions (UTRs). The presence of RNA-binding proteins at the 5' or 3' UTR influences the stability of the RNA molecule.
Figure 12.4 In the P generation, pea plants that are true-breeding for the dominant yellow phenotype are crossed with plants with the recessive green phenotype. This cross produces F 1 heterozygotes with a yellow phenotype. Punnett square analysis can be used to predict the genotypes of the F 2 generation.
Figure 4.18 - Kinetics of an enzyme obeying Michaelis-Menten kinetics. Image by Aleia Kim
Kevin Ahern, Indira Rajagopal, and Taralyn Tan, Biochemistry Free For All, Oregon State University, via Biology LibreTexts. Image by Aleia Kim · CC BY-NC-SA 4.0
· Original image ↗ · Access for free ↗
The early rate of product formation, measured before substantial substrate depletion or product accumulation, usually after the brief binding transient.
Figure 4.18 - Kinetics of an enzyme obeying Michaelis-Menten kinetics. Image by Aleia Kim
Kevin Ahern, Indira Rajagopal, and Taralyn Tan, Biochemistry Free For All, Oregon State University, via Biology LibreTexts. Image by Aleia Kim · CC BY-NC-SA 4.0
· Original image ↗ · Access for free ↗
Figure 15.11 Eukaryotic pre-mRNA processing. In addition to 5’ Cap and 3’ Poly-A Tail addition, introns must be precisely removed and exons joined to generate a functional mRNA. Nucleotides upstream (towards the 5’cap) of the translation START codon are part of the 5’ untranslated region (5’ UTR). Nucleotides downstream (towards 3’end) of the STOP codon form the 3’ UTR. Both 5’ and 3’ UTRs are important for regulating translation initiation and mRNA stability. Credit: Rao, A., Ryan, K. Fletcher, S. and Tag, A. Department of Biology, Texas A&M University.
Rao, A., Ryan, K. Fletcher, S. and Tag, A. Department of Biology, Texas A&M University.; Mary Ann Clark, Matthew Douglas, and Jung Choi, Biology 2e, OpenStax. · CC BY-NC-SA 4.0
· Original image ↗ · Access for free ↗
The exponent needed to obtain a number from a chosen fixed number. For decimal logarithms, log₁₀(100) = 2 because 10² = 100; pH uses the negative decimal logarithm of hydrogen ion activity.
A thin boundary or sheet. Cell membranes are lipid bilayers containing proteins; blotting membranes are synthetic supports that hold proteins or nucleic acids for detection.
Figure 15.11 Eukaryotic pre-mRNA processing. In addition to 5’ Cap and 3’ Poly-A Tail addition, introns must be precisely removed and exons joined to generate a functional mRNA. Nucleotides upstream (towards the 5’cap) of the translation START codon are part of the 5’ untranslated region (5’ UTR). Nucleotides downstream (towards 3’end) of the STOP codon form the 3’ UTR. Both 5’ and 3’ UTRs are important for regulating translation initiation and mRNA stability. Credit: Rao, A., Ryan, K. Fletcher, S. and Tag, A. Department of Biology, Texas A&M University.
Rao, A., Ryan, K. Fletcher, S. and Tag, A. Department of Biology, Texas A&M University.; Mary Ann Clark, Matthew Douglas, and Jung Choi, Biology 2e, OpenStax. · CC BY-NC-SA 4.0
· Original image ↗ · Access for free ↗
Figure 4.18 - Kinetics of an enzyme obeying Michaelis-Menten kinetics. Image by Aleia Kim
Kevin Ahern, Indira Rajagopal, and Taralyn Tan, Biochemistry Free For All, Oregon State University, via Biology LibreTexts. Image by Aleia Kim · CC BY-NC-SA 4.0
· Original image ↗ · Access for free ↗
Figure 12.4 In the P generation, pea plants that are true-breeding for the dominant yellow phenotype are crossed with plants with the recessive green phenotype. This cross produces F 1 heterozygotes with a yellow phenotype. Punnett square analysis can be used to predict the genotypes of the F 2 generation.
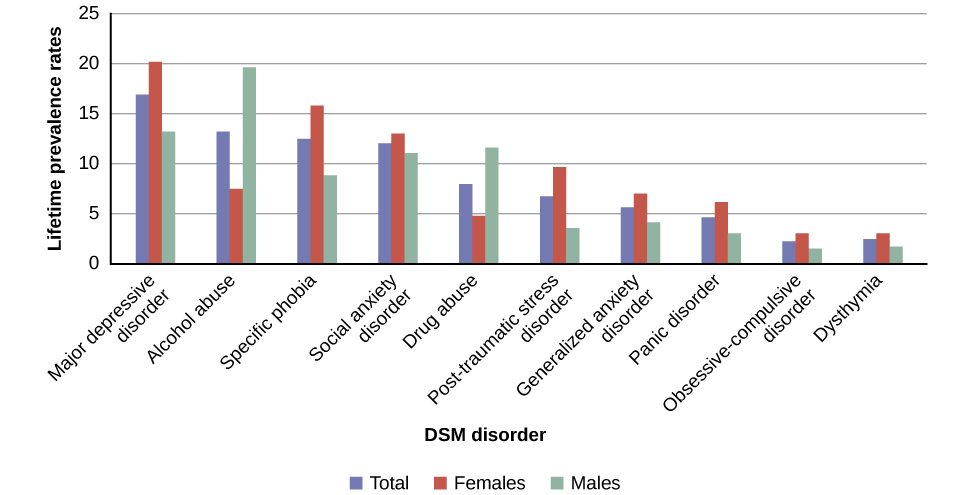
Figure 15.4 The graph shows the breakdown of psychological disorders, comparing the percentage prevalence among adult males and adult females in the United States. Because the data is from 2007, the categories shown here are from the DSM-IV, which has been supplanted by the DSM-5. Most categories remain the same; however, alcohol abuse now falls under a broader Alcohol Use Disorder category.
Figure 12.19 Reaction diagrams for an endothermic process in the absence (red curve) and presence (blue curve) of a catalyst. The catalyzed pathway involves a two-step mechanism (note the presence of two transition states) and an intermediate species (represented by the valley between the two transitions states).
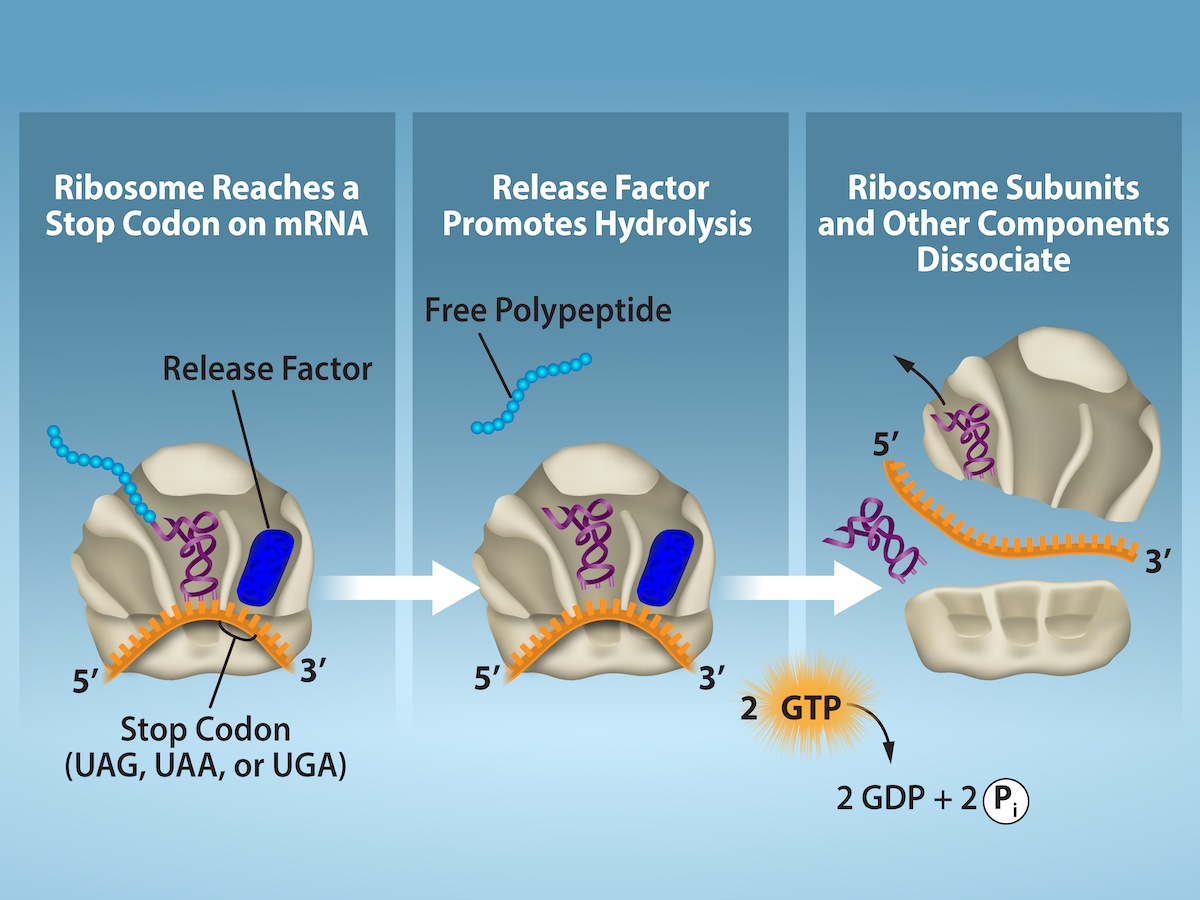
Figure 15.19 Translation Termination is Active. Translation is terminated when a STOP codon is in the A-site of the ribosome. Since there are no tRNAs corresponding to the STOP codons, the Release Factor protein enters and catalyzes the hydrolysis between the last amino acid and its tRNA. This hydrolysis releases the free carboxyl terminus (C-term) of the protein. Additional factors use the energy in GTP hydrolysis to disassemble the large and small ribosomal subunits and mRNA. Credit: Rao, A. and Ryan, K. Department of Biology, Texas A&M University.
Rao, A. and Ryan, K. Department of Biology, Texas A&M University.; Mary Ann Clark, Matthew Douglas, and Jung Choi, Biology 2e, OpenStax. · CC BY-NC-SA 4.0
· Original image ↗ · Access for free ↗
residential segregation
Unequal spatial separation of social groups across residential areas.
Figure 15.13 Pre-mRNA splicing involves the precise removal of introns from the primary RNA transcript. The splicing process is catalyzed by protein complexes called spliceosomes that are composed of proteins and RNA molecules called small nuclear RNAs (snRNAs). Spliceosomes recognize sequences at the 5' and 3' end of the intron. Rao, A. and Ryan, K. Department of Biology, Texas A&M University.
Rao, A. and Ryan, K. Department of Biology, Texas A&M University.; Mary Ann Clark, Matthew Douglas, and Jung Choi, Biology 2e, OpenStax. · CC BY-NC-SA 4.0
· Original image ↗ · Access for free ↗
RNA stability
Persistence of an RNA before degradation; greater stability generally means a longer lifetime or half-life under specified conditions.
Figure 16.13 RNA-binding proteins. The protein-coding region of this processed mRNA is flanked by 5' and 3' untranslated regions (UTRs). The presence of RNA-binding proteins at the 5' or 3' UTR influences the stability of the RNA molecule.
Figure 4.44 - Kinetic profile of an allosteric enzyme whose activity is controlled by a homotropic effector. Image by Aleia Kim
Kevin Ahern, Indira Rajagopal, and Taralyn Tan, Biochemistry Free For All, Oregon State University, via Biology LibreTexts. Image by Aleia Kim · CC BY-NC-SA 4.0
· Original image ↗ · Access for free ↗
Figure 7.45 - Non-homologous end joining (left) versus homologous recombination (right) - Wikipedia
Wikipedia, as credited by Kevin Ahern, Indira Rajagopal, and Taralyn Tan, Biochemistry Free For All, Oregon State University, via Biology LibreTexts. · Source attribution
· Original image ↗ · Access for free ↗
social epidemiology
Study of how social conditions shape the distribution and determinants of health.
The amount of a substance that can dissolve in a solvent under specified conditions. Soluble means able to dissolve; insoluble means only very slightly soluble in that solvent.
Figure 15.4 This figure shows the genetic code for translating each nucleotide triplet in mRNA into an amino acid or a termination signal in a protein. (credit: modification of work by NIH)
Figure 15.7 Messenger RNA is a copy of protein-coding information in the coding strand of DNA, with the substitution of U in the RNA for T in the coding sequence. However, new RNA nucleotides base pair with the nucleotides of the template strand. RNA is synthesized in its 5'-3' direction, using the enzyme RNA polymerase. As the template is read, the DNA unwinds ahead of the polymerase and then rewinds behind it.
Figure 15.14 This is a space-filling model of a tRNA molecule that adds the amino acid phenylalanine to a growing polypeptide chain. The anticodon AAG binds the Codon UUC on the mRNA. The amino acid phenylalanine is attached to the other end of the tRNA.
A fleeting, high-energy arrangement at a reaction barrier. It is an energy maximum along the reaction path, rather than a stable reaction intermediate.
Figure 12.19 Reaction diagrams for an endothermic process in the absence (red curve) and presence (blue curve) of a catalyst. The catalyzed pathway involves a two-step mechanism (note the presence of two transition states) and an intermediate species (represented by the valley between the two transitions states).
Figure 15.18 Translation begins when an initiator tRNA anticodon recognizes a start codon on mRNA bound to a small ribosomal subunit. The large ribosomal subunit joins the small subunit, and a second tRNA is recruited. As the mRNA moves relative to the ribosome, successive tRNAs move through the ribosome and the polypeptide chain is formed. Entry of a release factor into the A site terminates translation and the components dissociate.
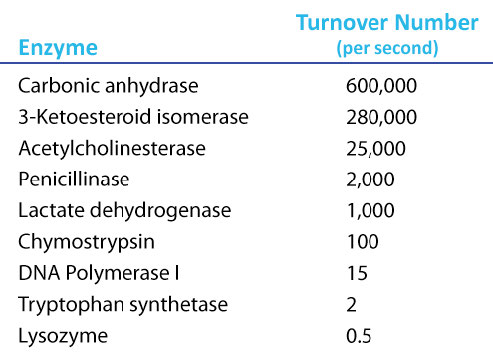
Figure 4.21 - Kcat (turnover number) values for several enzymes. Image by Aleia Kim
Kevin Ahern, Indira Rajagopal, and Taralyn Tan, Biochemistry Free For All, Oregon State University, via Biology LibreTexts. Image by Aleia Kim · CC BY-NC-SA 4.0
· Original image ↗ · Access for free ↗
No matching terms. Try a different name or abbreviation.
20.2 Urbanization
OpenStax · 20.2 Urbanization ↗ Instructional page including learning objectives, examples, figures, source tables and questions. Site navigation and embedded media players are omitted; source media links remain available.
Learning Objectives
By the end of this section, you should be able to:
Describe the process of urbanization in the United States and the growth of urban populations worldwide
Analyze the function of suburbs, exurbs, and concentric zones
Discuss urbanization from various sociological perspectives
Urbanization is the study of the social, political, and economic relationships in cities, and someone specializing in urban sociology studies those relationships. In some ways, cities can be microcosms of universal human behavior, while in others they provide a unique environment that yields its own brand of human behavior. There is no strict dividing line between rural and urban; rather, there is a continuum where one bleeds into the other. However, once a geographically concentrated population has reached approximately 100,000 people, it typically behaves like a city regardless of what its designation might be.
The Growth of Cities
According to sociologist Gideon Sjoberg (1965), there are three prerequisites for the development of a city: First, good environment with fresh water and a favorable climate; second, advanced technology, which will produce a food surplus to support nonfarmers; and third, strong social organization to ensure social stability and a stable economy. Most scholars agree that the first cities were developed somewhere in ancient Mesopotamia, though there are disagreements about exactly where. Most early cities were small by today’s standards, and the largest was most likely Rome, with about 650,000 inhabitants (Chandler and Fox 1974). The factors limiting the size of ancient cities included lack of adequate sewage control, limited food supply, and immigration restrictions. For example, serfs were tied to the land, and transportation was limited and inefficient. Today, the primary influence on cities’ growth is economic forces. Since the recent economic recession reduced housing prices, researchers have been waiting to see what happens to urban migration patterns in response.
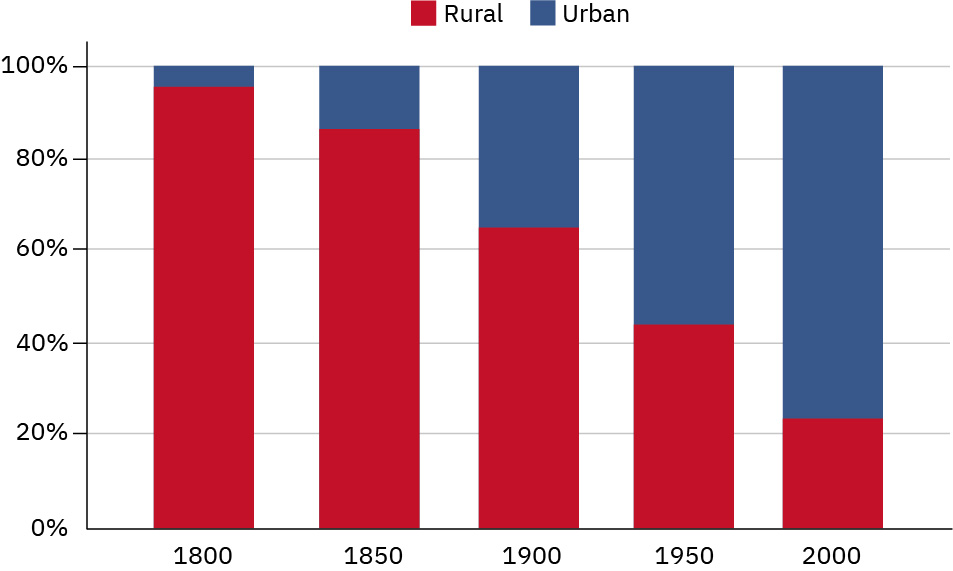
Figure 20.10 Percent of U.S. Population. As this chart illustrates, the shift from rural to urban living in the United States has been dramatic and continuous. (Credit: the U.S. Census Bureau)
Urbanization in the United States proceeded rapidly during the Industrial Era. As more and more opportunities for work appeared in factories, workers left farms (and the rural communities that housed them) to move to the cities. From mill towns in Massachusetts to tenements in New York, the industrial era saw an influx of poor workers into U.S. cities. At various times throughout the country’s history, certain demographic groups, from post-Civil War southern Black people to more recent immigrants, have made their way to urban centers to seek a better life in the city.
Sociology in the Real World
Managing Refugees and Asylum-Seekers in the Modern World
In 2013, the number of refugees, asylum-seekers, and internally displaced people worldwide exceeded 50 million people for the first time since the end of World War II. Half these people were children. A refugee is defined as an individual who has been forced to leave his or her country in order to escape war, persecution, or natural disaster, while asylum-seekers are those whose claim to refugee status has not been validated. An internally displaced person, on the other hand, is neither a refugee nor an asylum-seeker. Displaced persons have fled their homes while remaining inside their country’s borders.
The war in Syria caused most of the 2013 increase, forcing 2.5 million people to seek refugee status while internally displacing an additional 6.5 million. Violence in Central African Republic and South Sudan also contributed a large number of people to the total (The United Nations Refugee Agency 2014).
The refugees need help in the form of food, water, shelter, and medical care, which has worldwide implications for nations contributing foreign aid, the nations hosting the refugees, and the non-government organizations (NGOs) working with individuals and groups on site (The United Nations Refugee Agency 2014). Where will this large moving population, including sick, elderly, children, and people with very few possessions and no long-term plan, go?
Suburbs and Exurbs
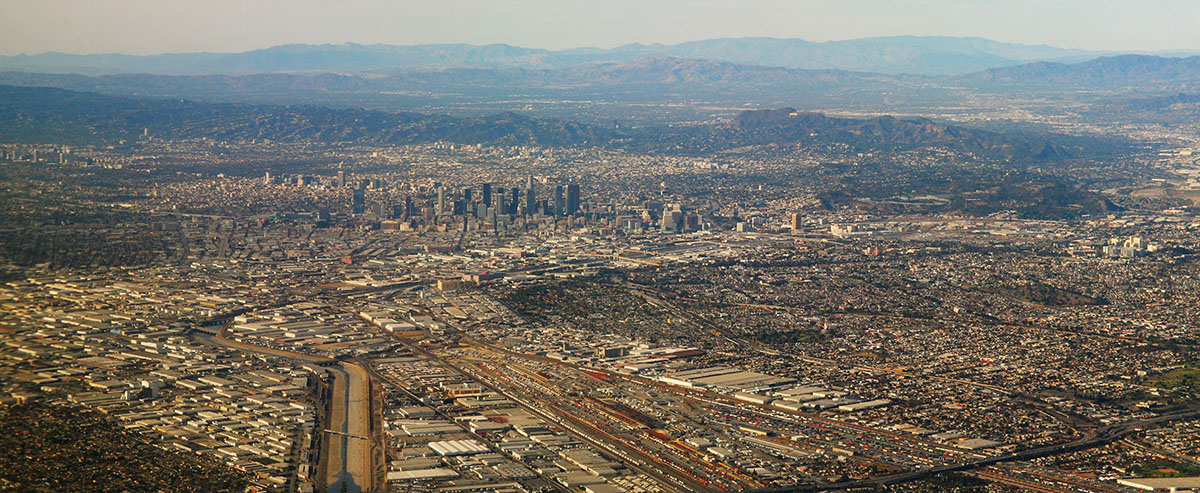
As cities grew more crowded, and often more impoverished and costly, more and more people began to migrate back out of them. But instead of returning to rural small towns (like they’d resided in before moving to the city), these people needed close access to the cities for their jobs. In the 1850s, as the urban population greatly expanded and transportation options improved, suburbs developed. Suburbs are the communities surrounding cities, typically close enough for a daily commute in, but far enough away to allow for more space than city living affords. The bucolic suburban landscape of the early twentieth century has largely disappeared due to sprawl. Suburban sprawl contributes to traffic congestion, which in turn contributes to commuting time. And commuting times and distances have continued to increase as new suburbs developed farther and farther from city centers. Simultaneously, this dynamic contributed to an exponential increase in natural resource use, like petroleum, which sequentially increased pollution in the form of carbon emissions.
As the suburbs became more crowded and lost their charm, those who could afford it turned to the exurbs, communities that exist outside the ring of suburbs and are typically populated by even wealthier families who want more space and have the resources to lengthen their commute. Together, the suburbs, exurbs, and metropolitan areas all combine to form a metropolis. New York was the first U.S. megalopolis, a huge urban corridor encompassing multiple cities and their surrounding suburbs. These metropolises use vast quantities of natural resources and are a growing part of the U.S. landscape.
Suburbs Are Not All White Picket Fences: The Banlieues of Paris
What makes a suburb a suburb? Simply, a suburb is a community surrounding a city. But when you picture a suburb in your mind, your image may vary widely depending on which nation you call home. In the United States, most consider the suburbs home to upper— and middle—class people with private homes. In other countries, like France, the suburbs––or “banlieues”–– are synonymous with housing projects and impoverished communities. In fact, the banlieues of Paris are notorious for their ethnic violence and crime, with higher unemployment and more residents living in poverty than in the city center. Further, the banlieues have a much higher immigrant population, which in Paris is mostly Arabic and African immigrants. This contradicts the clichéd U.S. image of a typical white-picket-fence suburb.
In 2005, serious riots broke out in the banlieue of Clichy-sous-Bois after two boys were electrocuted while hiding from the police. They were hiding, it is believed, because they were in the wrong place at the wrong time, near the scene of a break-in, and they were afraid the police would not believe in their innocence. Only a few days earlier, interior minister Nicolas Sarkozy (who later became president), had given a speech touting new measures against urban violence and referring to the people of the banlieue as “rabble” (BBC 2005). After the deaths and subsequent riots, Sarkozy reiterated his zero-tolerance policy toward violence and sent in more police. Ultimately, the violence spread across more than thirty towns and cities in France. Thousands of cars were burned, many hundreds of people were arrested, and both police and protesters suffered serious injuries.
Then-President Jacques Chirac responded by pledging more money for housing programs, jobs programs, and education programs to help the banlieues solve the underlying problems that led to such disastrous unrest. But none of the newly launched programs were effective. Sarkozy ran for president on a platform of tough regulations toward young offenders, and in 2007 the country elected him. More riots ensued as a response to his election. In 2010, Sarkozy promised “war without mercy” against the crime in the banlieues (France24 2010). Six years after the Clichy-sous-Bois riot, circumstances are no better for those in the banlieues.
As the Social Policy & Debate feature illustrates, the suburbs also have their share of socio-economic problems. In the United States, White flight refers to the migration of economically secure White people from racially mixed urban areas and toward the suburbs. This occurred throughout the twentieth century, due to causes as diverse as the legal end of racial segregation established by Brown v. Board of Education to the Mariel boatlift of people fleeing Cuba for Miami. Current trends include middle-class African-American families following White flight patterns out of cities, while affluent White people return to cities that have historically had a majority of Black people. The result is that the issues of race, socio-economics, neighborhoods, and communities remain complicated and challenging.
During the Industrial Era, there was a growth spurt worldwide. The development of factories brought people from rural to urban areas, and new technology increased the efficiency of transportation, food production, and food preservation. For example, from the mid-1670s to the early 1900s, London's population increased from 550,000 to 7 million (Old Bailey Proceedings Online 2011). Global favorites like New York, London, and Tokyo are all examples of postindustrial cities. As cities evolve from manufacturing-based industrial to service- and information-based postindustrial societies, gentrification becomes more common. Gentrification occurs when members of the middle and upper classes enter and renovate city areas that have been historically less affluent while the urban working poor are forced by resulting price pressures to leave those neighborhoods for increasingly decaying portions of the city.
Globally, 55 percent of the world’s people currently reside in urban areas, with the most urbanized region being North America (82 percent), followed by Latin America/the Caribbean (81 percent), with Europe coming in third (74 percent). In comparison, Africa is only 40 percent urbanized, though one of its nations, Nigeria, is projected to significantly urbanize in the coming years. With 37 million people, Tokyo is the world’s largest city by population, and New Delhi is the second largest with 29 million. The world’s most densely populated cities are now largely concentrated in the global south, a marked change from several decades ago when the biggest cities were found in the global north. In the next forty years, the biggest global challenge for urbanized populations, particularly in less developed countries, will be to achieve development that occurs without depleting or damaging the natural environment, also called sustainable development (United Nations 2018).
The issues of urbanization play significant roles in the study of sociology. Race, economics, and human behavior intersect in cities. Let’s look at urbanization through the sociological perspectives of functionalism and conflict theory. Functional perspectives on urbanization generally focus on the ecology of the city, while conflict perspective tends to focus on political economy.
Human ecology is a functionalist field of study that looks at the relationship between people and their built and natural physical environments (Park 1915). Generally speaking, urban land use and urban population distribution occur in a predictable pattern once we understand how people relate to their living environment. For example, in the United States, we have a transportation system geared to accommodate individuals and families in the form of interstate highways built for cars. In contrast, most parts of Europe emphasize public transportation such as high-speed rail and commuter lines, as well as walking and bicycling. The challenge for a human ecologist working in U.S. urban planning is to design landscapes and waterscapes with natural beauty, while also figuring out how to provide for free-flowing transport of innumerable vehicles, not to mention parking!
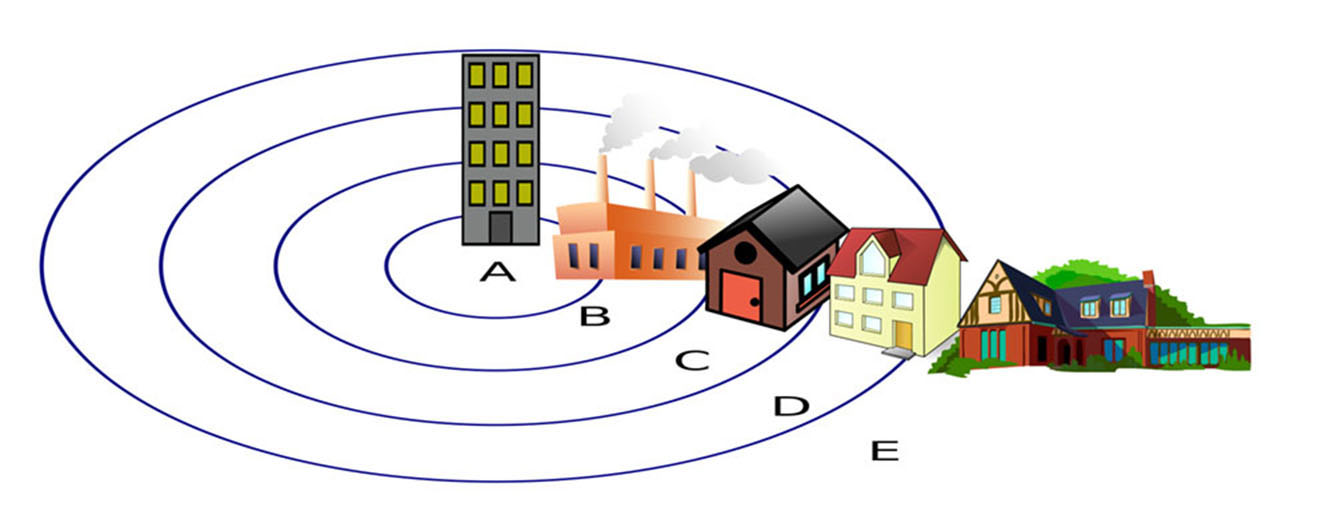
The concentric zone model (Burgess 1925) is perhaps the most famous example of human ecology. This model views a city as a series of concentric circular areas, expanding outward from the center of the city, with various “zones” invading adjacent zones (as new categories of people and businesses overrun the edges of nearby zones) and succeeding (then after invasion, the new inhabitants repurpose the areas they have invaded and push out the previous inhabitants). In this model, Zone A, in the heart of the city, is the center of the business and cultural district. Zone B, the concentric circle surrounding the city center, is composed of formerly wealthy homes split into cheap apartments for new immigrant populations; this zone also houses small manufacturers, pawn shops, and other marginal businesses. Zone C consists of the homes of the working class and established ethnic enclaves. Zone D holds wealthy homes, white-collar workers, and shopping centers. Zone E contains the estates of the upper class (in the exurbs) and the suburbs.
In contrast to the functionalist approach, theoretical models in the conflict perspective focus on the way urban areas change according to specific decisions made by political and economic leaders. These decisions generally benefit the middle and upper classes while exploiting the working and lower classes.
For example, sociologists Feagin and Parker (1990) suggested three factors by which political and economic leaders control urban growth. First, these leaders work alongside each other to influence urban growth and decline, determining where money flows and how land use is regulated. Second, exchange value and use value of land are balanced to favor the middle and upper classes so that, for example, public land in poor neighborhoods may be rezoned for use as industrial land. Finally, urban development is dependent on both structure (groups such as local government) and agency (individuals including businessmen and activists), and these groups engage in a push-pull dynamic that determines where and how land is actually used. For example, Not In My Back Yard (NIMBY) movements are more likely to emerge in middle and upper-class neighborhoods as engaged citizens protest poor environmental practices they fear will affect them, so these groups have more control over the use of local land.
20.3 The Environment and Society
OpenStax · 20.3 The Environment and Society ↗ Instructional page including learning objectives, examples, figures, source tables and questions. Site navigation and embedded media players are omitted; source media links remain available.
Learning Objectives
By the end of this section, you should be able to:
Describe climate change and its importance
Apply the concept of carrying capacity to environmental concerns
Explain the challenges presented by pollution, garbage, e-waste, and toxic hazards
Discuss real-world instances of environmental racism
The subfield of environmental sociology studies the way humans interact with their environments. This field is closely related to human ecology, which focuses on the relationship between people and their built and natural environment. This is an area that is garnering more attention as extreme weather patterns and policy battles over climate change dominate the news. A key factor of environmental sociology is the concept of carrying capacity, which describes the maximum amount of life that can be sustained within a given area. While this concept can refer to grazing lands or to rivers, we can also apply it to the earth as a whole.
Figure 20.13 — 20.3 The Environment and Society
Figure 20.13 Too little land for grazing means starving cattle. (Credit: newbeatphoto/flickr)
You might have heard the expression “the tragedy of the commons.” In 1968, an article of the same title written by Garrett Hardin described how a common pasture was ruined by overgrazing. But Hardin was not the first to notice the phenomenon. Back in the 1800s, Oxford economist William Forster Lloyd looked at the devastated public grazing commons and the unhealthy cattle subject to such limited resources, and saw, in essence, that the carrying capacity of the commons had been exceeded. However, since no one was held responsible for the land (as it was open to all), no one was willing to make sacrifices to improve it. Cattle grazers benefitted from adding more cattle to their herds, but they did not have to take on the responsibility of the lands that were being damaged by overgrazing. So there was an incentive for them to add more head of cattle, and no incentive for restraint.
Satellite photos of Africa taken in the 1970s showed this practice to dramatic effect. The images depicted a dark irregular area of more than 300 square miles. There was a large fenced area, where plenty of grass was growing. Outside the fence, the ground was bare and devastated. The reason was simple: the fenced land was privately owned by informed farmers who carefully rotated their grazing animals and allowed the fields to lie fallow periodically. Outside the fence was land used by nomads. Like the herdsmen in 1800s Oxford, the nomads increased their heads of cattle without planning for its impact on the greater good. The soil eroded, the plants died, then the cattle died, and, ultimately, some of the people died.
How does this lesson affect those of us who don’t need to graze our cattle? Well, like the cows, we all need food, water, and clean air to survive. With the increasing world population and the ever-larger megalopolises with tens of millions of people, the limit of the earth’s carrying capacity is called into question. When too many take while giving too little thought to the rest of the population, whether cattle or humans, the result is usually tragedy.
Climate Change
While you might be more familiar with the phrase “global warming,” climate change is the term now used to refer to long-term shifts in temperatures due to human activity and, in particular, the release of greenhouse gases into the environment. The planet as a whole is warming, but the term climate change acknowledges that the short-term variations in this process can include both higher and lower temperatures, despite the overarching trend toward warmth.
Climate change is a deeply controversial subject, despite decades of scientific research and a high degree of scientific consensus that supports its existence. For example, according to NASA scientists, 2020 essentially tied with 2016 as the warmest year on record, continuing the overall trend of increasing worldwide temperatures (NASA 2021). One effect of climate change is more extreme weather. There are increasingly more record-breaking weather phenomena, from the number of Category 4 hurricanes to the amount of snowfall in a given winter. These extremes, while they make for dramatic television coverage, can cause immeasurable damage to crops, property, and lives.
So why is there a controversy? Until relatively recently, the United States was very divided on the existence of climate change as an immediate threat, as well as whether or not human activity causes or contributes to it. But now it appears that the U.S. has joined the ranks of many countries where citizens are concerned about climate change; the nation is divided on what to do about it.
Research conducted in 2020 and 2021 indicated that at least 60 percent of Americans believe climate change is a real and immediate threat (UNDP 2021 and Global Strategy Group 2021). Citizens are also more supportive of clean energy and taking part in international efforts, such as the Paris Climate Accord, which is intended to engage countries in actions to limit the activity that leads to climate change. What's changed these opinions? It may be that younger people are more represented in these polls, and they tend to support climate change initiatives more consistently. It may be that the continued severity of weather and the costly and widespread impact is more difficult to ignore than it was previously. And part of the changing opinions might be driven by the prevalence of green energy sources, from wind power to solar power to electric cars, which are more evident to people across the country. However, deep divides remain. The addition of clean energy producers, such as offshore wind farms, typically meet stiff local opposition (similar to the "not in my backyard" discussion earlier in the chapter). And any punitive or price-raising methods of controlling emissions are unlikely to be welcome by U.S. citizens. Finally, global agreements like the Paris Accord will have limited impact because they are not strictly enforceable.
World systems analysis suggests that while, historically, core nations (like the United States and Western Europe) were the greatest source of greenhouse gases, they have now evolved into postindustrial societies. Industrialized semi-peripheral and peripheral nations are releasing increasing quantities of greenhouse gases, such as carbon dioxide. The core nations, now post-industrial and less dependent on greenhouse-gas-causing industries, wish to enact strict protocols regarding the causes of global warming, but the semi-peripheral and peripheral nations rightly point out that they only want the same economic chance to evolve their economies. Since they were unduly affected by the progress of core nations, if the core nations now insist on "green" policies, they should pay offsets or subsidies of some kind. There are no easy answers to this conflict. It may well not be "fair" that the core nations benefited from ignorance during their industrial boom.
Pollution
Pollution describes what happens when contaminants are introduced into an environment (water, air, land) at levels that are damaging. Environments can often sustain a limited amount of contaminants without marked change, and water, air, and soil can “heal” themselves to a certain degree. However, once contaminant levels reach a certain point, the results can be catastrophic.
Water
Typhoid, cholera, and diarrhea from unsafe water kill hundreds of thousands of children each year, and over 160 million children suffer from malnutrition and growth issues due to water issues. An estimated 3 billion people do not have access to clean water at home for hand-washing (CDC 2016). Consider the impact of that, knowing that many of those without water for hand-washing live in agricultural societies in which they work with animals or live in cities with many other people.
The water crisis is exacerbated by many of the other issues we've discussed. Global pandemics, pollution, and climate change all have more severe impacts when coupled with lack of access to clean water. Finally, the cost of obtaining that clean water can interfere with other important aspects of survival and social mobility. Children serve as water haulers, traveling long distances on foot to collect potable water for their family. Those same children (as well as those who similarly collect firewood) are less able to focus on their education, either missing school or not completing the associated work (Water.org 2021). Regular water hauling–which for some people involves carrying 20 kilograms (40 pounds) for 30 minutes or more–also has negative effects on people's bodies, especially pregnant women who often undertake the task. The situation is only getting more dire as the global population increases. Water is a key resource battleground in the twenty-first century.
As every child learns in school, 70 percent of earth is made of water. Despite that figure, there is a finite amount of water usable by humans and it is constantly used and reused in a sustainable water cycle. The way we use this abundant natural resource, however, renders much of it unsuitable for consumption and unable to sustain life. Oil and natural gas production, discussed at the beginning of the chapter, require so much water that there's no safe place to put the wastewater other than deep underground. But more common activities use far more water than many people understand. The immense amount of water to produce almonds (8 percent of California's water supply, equating to roughly one gallon per individual almond) has made headlines, as have the 37 gallons that it takes to produce a cup of coffee. But all crops and livestock have a "water footprint." Dairy milk is actually known to take more water to produce than does almond milk, for example. And steak may take up to 900 gallons of water to produce (WaterCalculuator.org 2020).
Those water costs are important to consider, particularly if the crops are produced in a part of the world where access to safe water is also an issue. But reducing irrigation water usage for U.S. crops would have very limited effects in sub-Saharan Africa. Most experts focus on improving water quality and sanitation in general, as well as reducing the distance people need to travel in order to obtain safe water.
Water pollution has always been a byproduct of industrialization, increased population, and urbanization. Cleveland's Cuyahoga River caught fire several times due to pollution, and was part of what inspired the United States' turn to cleaner water. Other countries are currently undergoing the same crises. As a consequence of population concentrations, water close to human settlements is frequently polluted with untreated or partially treated human waste (sewage), chemicals, radioactivity, and levels of heat sufficient to create large “dead zones” incapable of supporting aquatic life. The methods of food production used by many core nations rely on liberal doses of nitrogen and pesticides, which end up back in the water supply. In some cases, water pollution affects the quality of the aquatic life consumed by water and land animals. As we move along the food chain, the pollutants travel from prey to predator. Since humans consume at all levels of the food chain, we ultimately consume the carcinogens, such as mercury, accumulated through several branches of the food web.
Soil
You might have read The Grapes of Wrath in English class at some point in time. Steinbeck’s tale of the Joads, driven out of their home by the Dust Bowl, is still playing out today. In China, as in Depression-era Oklahoma, over-tilling soil in an attempt to expand agriculture has resulted in the disappearance of large patches of topsoil.
Soil erosion and desertification are just two of the many forms of soil pollution. In addition, all the chemicals and pollutants that harm our water supplies can also leach into soil with similar effects. Brown zones where nothing can grow are common results of soil pollution. One demand the population boom makes on the planet is a requirement for more food to be produced. The so-called “Green Revolution” in the 1960s saw chemists and world aid organizations working together to bring modern farming methods, complete with pesticides, to developing countries. The immediate result was positive: food yields went up and burgeoning populations were fed. But as time has gone on, these areas have fallen into even more difficult straits as the damage done by modern methods leave traditional farmers with less than they had to start.
Dredging certain beaches in an attempt to save valuable beachfront property from coastal erosion has resulted in greater storm impact on shorelines, and damage to beach ecosystems (Turneffe Atoll Trust 2008). These dredging projects have damaged reefs, sea grass beds, and shorelines and can kill off large swaths of marine life. Ultimately, this damage threatens local fisheries, tourism, and other parts of the local economy.
Garbage
Figure 20.14 — 20.3 The Environment and Society
Figure 20.14 Where should garbage go when you’ve run out of room? This is a question that is increasingly pressing the planet. (Credit: Department of Environmental Protection Recycling/flickr)
Where is your last cell phone? What about the one before that? Or the huge old television set your family had before flat screens became popular? For most of us, the answer is a sheepish shrug. We don’t pay attention to the demise of old items, and since electronics drop in price and increase in innovation at an incredible clip, we have been trained by their manufacturers to upgrade frequently.
Garbage creation and control are major issues for most core and industrializing nations, and it is quickly becoming one of the most critical environmental issues faced in the United States. People in the United States buy products, use them, and then throw them away. Did you dispose of your old electronics according to government safety guidelines? Chances are good you didn’t even know there are guidelines. Multiply your electronics times a few million, take into account the numerous toxic chemicals they contain, and then imagine either burying those chemicals in the ground or lighting them on fire.
Those are the two primary means of waste disposal in the United States: landfill and incineration. When it comes to getting rid of dangerous toxins, neither is a good choice. Styrofoam and plastics that many of us use every day do not dissolve in a natural way. Burn them, and they release carcinogens into the air. Their improper incineration (intentional or not) adds to air pollution and increases smog. Dump them in landfills, and they do not decompose. As landfill sites fill up, we risk an increase in groundwater contamination.
Big Picture
What Should Apple (and Friends) Do about E-Waste?
Figure 20.15 — 20.3 The Environment and Society
Figure 20.15 A parking lot filled with electronic waste, known as e-waste. (Credit: U.S. Army Environmental Command/flickr)
The mountains of broken plastic and rusty metal that plague the environment are not the most problematic types of garbage. E-waste or obsolete, broken, and worn-out electronics is the fastest growing segment of garbage production in the world. It is made up of household appliances, batteries, control devices, computers, phones, and similar products. Ironically, one of the largest potential e-waste problems will come from expended solar panels, which, although only a fraction of total waste, will require a complex recycling process (Stone 2020). All of these products have toxic chemicals and dangerous metals in them, as well as a significant amount of plastic that does not biodegrade.
So where do they go? Many companies ship their e-waste to developing nations in Africa and Asia to be “recycled.” While they are, in some senses, recycled, the result is not exactly clean. In fact, it is one of the dirtiest jobs around. Overseas, without the benefit of environmental regulation, e-waste dumps become a kind of boomtown for entrepreneurs willing to sort through endless stacks of broken-down electronics for tiny bits of valuable copper, silver, and other precious metals. Unfortunately, in their hunt, these workers are exposed to deadly toxins.
Governments are beginning to take notice of the impending disaster, and the European Union, as well as the state of California, put stricter regulations in place. These regulations both limit the amount of toxins allowed in electronics and address the issue of end-of-life recycling. But not surprisingly, corporations, while insisting they are greening their process, often fight stricter regulations. Meanwhile, many environmental groups, including the activist group Greenpeace, have taken up the cause. Greenpeace states that it is working to get companies to:
measure and reduce emissions with energy efficiency, renewable energy, and energy policy advocacy
make greener, efficient, longer lasting products that are free of hazardous substances
reduce environmental impacts throughout company operations, from choosing production materials and energy sources right through to establishing global take-back programs for old products (Greenpeace 2011). Companies like Amazon, Samsung, Canon, Sprint, and Dell are noted for effective and forward-thinking programs (Sadoff 2019).
Air
China’s fast-growing economy and burgeoning industry have translated into notoriously poor air quality. Smog hangs heavily over the major cities, sometimes grounding aircraft that cannot navigate through it. Pedestrians and cyclists wear air-filter masks to protect themselves. In Beijing, citizens are skeptical that the government-issued daily pollution ratings are trustworthy. Increasingly, they are taking their own pollution measurements in the hopes that accurate information will galvanize others to action. Given that some days they can barely see down the street, they hope action comes soon (Papenfuss 2011).
Humanity, with its growing numbers, use of fossil fuels, and increasingly urbanized society, is putting too much stress on the earth’s atmosphere. The amount of air pollution varies from locale to locale, and you may be more personally affected than you realize. How often do you check air quality reports before leaving your house? Depending on where you live, this question can sound utterly strange or like an everyday matter. Along with oxygen, most of the time we are also breathing in soot, hydrocarbons, carbon, nitrogen, and sulfur oxides.
Much of the pollution in the air comes from human activity. How many college students move their cars across campus at least once a day? Who checks the environmental report card on how many pollutants each company throws into the air before purchasing a cell phone? Many of us are guilty of taking our environment for granted without concern for how everyday decisions add up to a long-term global problem. How many minor adjustments can you think of, like walking instead of driving, that would reduce your overall carbon footprint?
Remember the “tragedy of the commons.” Each of us is affected by air pollution. But like the herder who adds one more head of cattle to realize the benefits of owning more cows but who does not have to pay the price of the overgrazed land, we take the benefit of driving or buying the latest cell phones without worrying about the end result. Air pollution accumulates in the body, much like the effects of smoking cigarettes accumulate over time, leading to more chronic illnesses. And in addition to directly affecting human health, air pollution affects crop quality as well as heating and cooling costs. In other words, we all pay a lot more than the price at the pump when we fill up our tank with gas.
Radioactivity is a form of air pollution. While nuclear energy promises a safe and abundant power source, increasingly it is looked upon as a danger to the environment and to those who inhabit it. We accumulate nuclear waste, which we must then keep track of long term and ultimately figure out how to store the toxic waste material without damaging the environment or putting future generations at risk.
The 2011 earthquake in Japan illustrates the dangers of even safe, government-monitored nuclear energy. When disaster occurs, how can we safely evacuate the large numbers of affected people? Indeed, how can we even be sure how far the evacuation radius should extend? Radiation can also enter the food chain, causing damage from the bottom (phytoplankton and microscopic soil organisms) all the way to the top. Once again, the price paid for cheap power is much greater than what we see on the electric bill.
Figure 20.16 — 20.3 The Environment and Society
Figure 20.16 An aerial view of the Gulf Coast, taken in May 2010, illustrates the damage done by the BP Deep Water Horizon spill. (Credit: Jeff Warren/flickr)
The enormous oil disaster that hit the Louisiana Gulf Coast in 2010 is just one of a high number of environmental crises that have led to toxic residue. They include the pollution of the Love Canal neighborhood of the 1970s to the Exxon Valdez oil tanker crash of 1989, the Chernobyl disaster of 1986, and Japan’s Fukushima nuclear plant incident following the earthquake in 2011. Often, the stories are not newsmakers, but simply an unpleasant part of life for the people who live near toxic sites such as Centralia, Pennsylvania and Hinkley, California. In many cases, people in these neighborhoods can be part of a cancer cluster without realizing the cause.
Figure 20.17 — 20.3 The Environment and Society
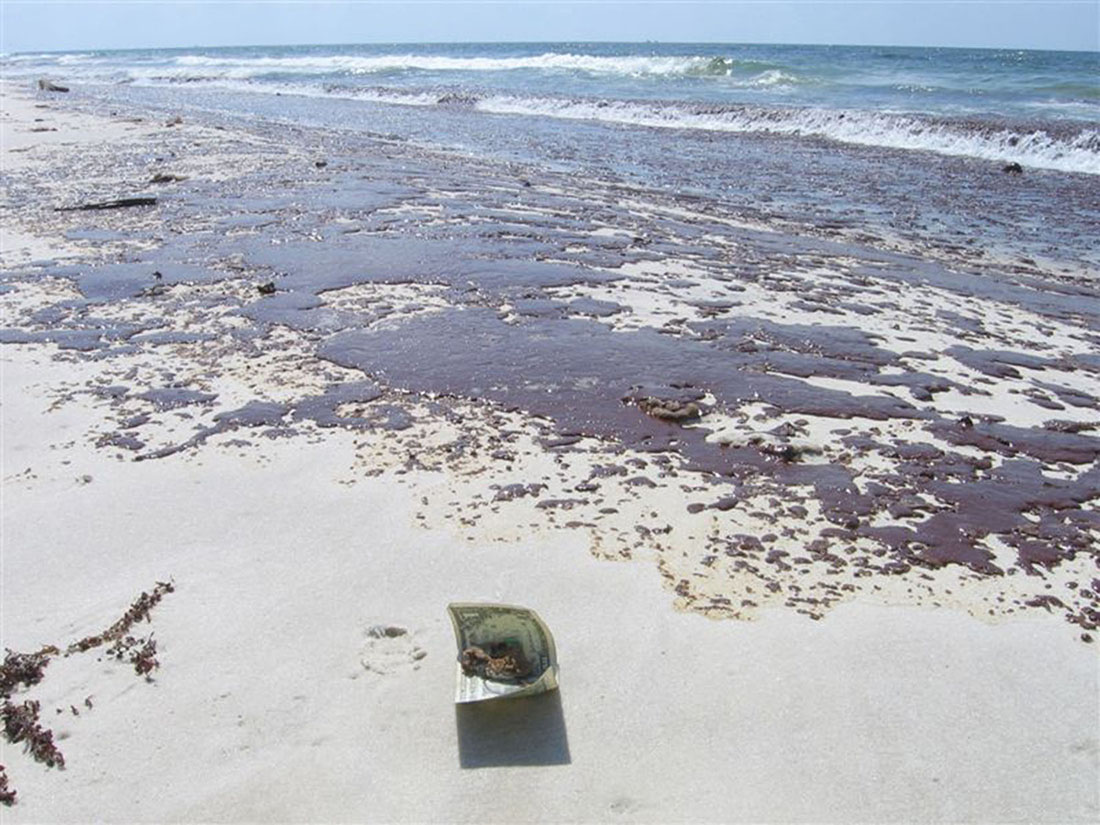
Figure 20.17 Oil on the gulf shore beaches caused great destruction, killing marine and land animals and devastating local business. (Credit: AV8ter/flickr)
There used to be a place called Centralia, Pennsylvania. The town incorporated in the 1860s and once had several thousand residents, largely coal workers. But the story of its demise begins a century later in 1962. That year, a trash-burning fire was lit in the pit of the old abandoned coal mine outside of town. The fire moved down the mineshaft and ignited a vein of coal. It is still burning.
For more than twenty years, people tried to extinguish the underground fire, but no matter what they did, it returned. There was little government action, and people had to abandon their homes as toxic gases engulfed the area and sinkholes developed. The situation drew national attention when the ground collapsed under twelve-year-old Todd Domboski in 1981. Todd was in his yard when a sinkhole four feet wide and 150 feet deep opened beneath him. He clung to exposed tree roots and saved his life; if he had fallen a few feet farther, the heat or carbon monoxide would have killed him.
In 1983, engineers studying the fire concluded that it could burn for another century or more and could spread over nearly 4,000 acres. At this point, the government offered to buy out the town’s residents and wanted them to relocate to nearby towns. A few determined Centralians refused to leave, even though the government bought their homes, and they are the only ones who remain. In one field, signs warn people to enter at their own risk, because the ground is hot and unstable. And the fire burns on (DeKok 1986).
Environmental Racism
Environmental racism refers to the way in which minority group neighborhoods (populated primarily by people of color and members of low socioeconomic groups) are burdened with a disproportionate number of hazards, including toxic waste facilities, garbage dumps, and other sources of environmental pollution and foul odors that lower the quality of life. All around the globe, members of minority groups bear a greater burden of the health problems that result from higher exposure to waste and pollution. This can occur due to unsafe or unhealthy work conditions where no regulations exist (or are enforced) for poor workers, or in neighborhoods that are uncomfortably close to toxic materials.
The statistics on environmental racism are shocking. Research shows that it pervades all aspects of African Americans' lives: environmentally unsound housing, schools with asbestos problems, facilities and playgrounds with lead paint. A twenty-year comparative study led by sociologist Robert Bullard determined “race to be more important than socioeconomic status in predicting the location of the nation’s commercial hazardous waste facilities” (Bullard et al. 2007). His research found, for example, that Black children are five times more likely to have lead poisoning (the leading environmental health threat for children) than their White counterparts, and that a disproportionate number of people of color reside in areas with hazardous waste facilities (Bullard et al. 2007). Sociologists with the project are examining how environmental racism is addressed in the long-term cleanup of the environmental disasters caused by Hurricane Katrina.
Sociology in the Real World
Native American Tribes and Environmental Racism
Native Americans are unquestionably victims of environmental racism. The Commission for Racial Justice found that about 50 percent of all Native Americans live in communities with uncontrolled hazardous waste sites (Asian Pacific Environmental Network 2002). There’s no question that, worldwide, indigenous populations are suffering from similar fates.
For Native American tribes, the issues can be complicated—and their solutions hard to attain—because of the complicated governmental issues arising from a history of institutionalized disenfranchisement. Unlike other racial minorities in the United States, Native American tribes are sovereign nations. However, much of their land is held in “trust,” meaning that “the federal government holds title to the land in trust on behalf of the tribe” (Bureau of Indian Affairs 2012). Some instances of environmental damage arise from this crossover, where the U.S. government’s title has meant it acts without approval of the tribal government. Other significant contributors to environmental racism as experienced by tribes are forcible removal and burdensome red tape to receive the same reparation benefits afforded to non-Indians.
To better understand how this happens, let’s consider a few example cases. The home of the Skull Valley Band of Goshute Indians was targeted as the site for a high-level nuclear waste dumping ground, amid allegations of a payoff of as high as $200 million (Kamps 2001). Keith Lewis, an indigenous advocate for Native American rights, commented on this buyout, after his people endured decades of uranium contamination, saying that “there is nothing moral about tempting a starving man with money” (Kamps 2001). In another example, the Western Shoshone’s Yucca Mountain area has been pursued by mining companies for its rich uranium stores, a threat that adds to the existing radiation exposure this area suffers from U.S. and British nuclear bomb testing (Environmental JusticeCase Studies 2004). In the “four corners” area where Colorado, Utah, Arizona, and New Mexico meet, a group of Hopi and Navajo families have been forcibly removed from their homes so the land could be mined by the Peabody Mining Company for coal valued at $10 billion (American Indian Cultural Support 2006). Years of uranium mining on the lands of the Navajo of New Mexico have led to serious health consequences, and reparations have been difficult to secure; in addition to the loss of life, people’s homes and other facilities have been contaminated (Frosch 2009). In yet another case, members of the Chippewa near White Pine, Michigan, were unable to stop the transport of hazardous sulfuric acid across reservation lands, but their activism helped bring an end to the mining project that used the acid (Environmental JusticeCase Studies 2004).
These examples are only a few of the hundreds of incidents that Native American tribes have faced and continue to battle against. Sadly, the mistreatment of the land’s original inhabitants continues via this institution of environmental racism. How might the work of sociologists help draw attention to—and eventually mitigate—this social problem?
Why does environmental racism exist? The reason is simple. Those with resources can raise awareness, money, and public attention to ensure that their communities are unsullied. This has led to an inequitable distribution of environmental burdens. Another method of keeping this inequity alive is NIMBY protests. Chemical plants, airports, landfills, and other municipal or corporate projects are often the subject of NIMBY demonstrations. And equally often, the NIMBYists win, and the objectionable project is moved closer to those who have fewer resources to fight it.
11.4 Intergroup Relationships
OpenStax · 11.4 Intergroup Relationships ↗ Instructional page including learning objectives, examples, figures, source tables and questions. Site navigation and embedded media players are omitted; source media links remain available.
Learning Objectives
By the end of this section, you should be able to:
Explain different intergroup relations in terms of their relative levels of tolerance
Give historical and/or contemporary examples of each type of intergroup relation
Intergroup relations (relationships between different groups of people) range along a spectrum between tolerance and intolerance. The most tolerant form of intergroup relations is pluralism, in which no distinction is made between minority and majority groups, but instead there’s equal standing. At the other end of the continuum are amalgamation, expulsion, and even genocide—stark examples of intolerant intergroup relations.
Pluralism
Pluralism is represented by the ideal of the United States as a “salad bowl”: a great mixture of different cultures where each culture retains its own identity and yet adds to the flavor of the whole. True pluralism is characterized by mutual respect on the part of all cultures, both dominant and subordinate, creating a multicultural environment of acceptance. In reality, true pluralism is a difficult goal to reach. In the United States, the mutual respect required by pluralism is often missing, and the nation’s past model of a melting pot posits a society where cultural differences aren’t embraced as much as erased.
Assimilation describes the process by which a minority individual or group gives up its own identity by taking on the characteristics of the dominantculture. In the United States, which has a history of welcoming and absorbing immigrants from different lands, assimilation has been a function of immigration.
Figure 11.6 — 11.4 Intergroup Relationships
Figure 11.6 For many immigrants to the United States, the Statue of Liberty is a symbol of freedom and a new life. Unfortunately, they often encounter prejudice and discrimination. (Credit: Mark Heard/flickr)
Most people in the United States have immigrant ancestors. In relatively recent history, between 1890 and 1920, the United States became home to around 24 million immigrants. In the decades since then, further waves of immigrants have come to these shores and have eventually been absorbed into U.S. culture, sometimes after facing extended periods of prejudice and discrimination. Assimilation may lead to the loss of the minority group’s cultural identity as they become absorbed into the dominantculture, but assimilation has minimal to no impact on the majority group’s cultural identity.
Some groups may keep only symbolic gestures of their original ethnicity. For instance, many Irish Americans may celebrate Saint Patrick’s Day, many Hindu Americans enjoy a Diwali festival, and many Mexican Americans may celebrate Cinco de Mayo (a May 5 acknowledgment of the Mexican victory over the French Empire at the Battle of Puebla). However, for the rest of the year, other aspects of their originating culture may be forgotten.
Assimilation is antithetical to the “salad bowl” created by pluralism; rather than maintaining their own cultural flavor, subordinate cultures give up their own traditions in order to conform to their new environment. Sociologists measure the degree to which immigrants have assimilated to a new culture with four benchmarks: socioeconomic status, spatial concentration, language assimilation, and intermarriage. When faced with racial and ethnic discrimination, it can be difficult for new immigrants to fully assimilate. Language assimilation, in particular, can be a formidable barrier, limiting employment and educational options and therefore constraining growth in socioeconomic status.
Amalgamation
Amalgamation is the process by which a minority group and a majority group combine to form a new group. Amalgamation creates the classic “melting pot” analogy; unlike the “salad bowl,” in which each culture retains its individuality, the “melting pot” ideal sees the combination of cultures that results in a new culture entirely.
Amalgamation in the form of miscegenation is achieved through intermarriage between races. In the United States, antimiscegenation laws, which criminalized interracial marriage, flourished in the South during the Jim Crow era. It wasn’t until 1967’s Loving v. Virginia that the last antimiscegenation law was struck from the books, making these laws unconstitutional.
Genocide
Genocide, the deliberate annihilation of a targeted (usually subordinate) group, is the most toxic intergroup relationship. Historically, we can see that genocide has included both the intent to exterminate a group and the function of exterminating of a group, intentional or not.
Possibly the most well-known case of genocide is Hitler’s attempt to exterminate the Jewish people in the first part of the twentieth century. Also known as the Holocaust, the explicit goal of Hitler’s “Final Solution” was the eradication of European Jewish people, as well as the destruction of other minority groups such as Catholics, people with disabilities, LGBTQ people, and Romani people, then disparagingly referred to as "gypsies". With forced emigration, concentration camps, and mass executions in gas chambers, Hitler’s Nazi regime was responsible for the deaths of 12 million people, 6 million of whom were Jewish. Hitler’s intent was clear, and the high Jewish death toll certainly indicates that Hitler and his regime committed genocide. But how do we understand genocide that is not so overt and deliberate?
The treatment of the Native Americans by the European colonizers is an example of genocide committed against indigenous people. Some historians estimate that Native American populations dwindled from approximately 12 million people in the year 1500 to barely 237,000 by the year 1900 (Lewy 2004). European settlers coerced American Indians off their own lands, often causing thousands of deaths in forced removals, such as occurred in the Cherokee or Potawatomi Trail of Tears. Settlers also enslaved Native Americans and forced them to give up their religious and cultural practices. But the major cause of Native American death was neither slavery nor war nor forced removal: it was the introduction of European diseases and Native American lack of immunity to them. Smallpox, diphtheria, and measles flourished among indigenous American tribes who had no exposure to the diseases and no ability to fight them. Quite simply, these diseases decimated the tribes. The use of diseases as weapon was most likely unintentional in some cases and intentional in others. For example, during the Seven Years War, the British gave smallpox-infected blankets to the Native tribes in order to "reduce them," and this and similar practices likely continued throughout the centuries-long assault on the Native American people.
Genocide is not a just a historical concept; it is practiced even in the twenty- first century. For example, ethnic and geographic conflicts in the Darfur region of Sudan have led to hundreds of thousands of deaths. As part of an ongoing land conflict, the Sudanese government and their state-sponsored Janjaweed militia have led a campaign of killing, forced displacement, and systematic rape of Darfuri people. Although a treaty was signed in 2011, the peace is fragile.
Expulsion
Expulsion refers to a subordinate group being forced, by a dominant group, to leave a certain area or country. As seen in the examples of the Trail of Tears and the Holocaust, expulsion can be a factor in genocide. However, it can also stand on its own as a destructive group interaction. Expulsion has often occurred historically with an ethnic or racial basis. In the United States, President Franklin D. Roosevelt issued Executive Order 9066 in 1942, after the Japanese government’s attack on Pearl Harbor. The Order authorized the establishment of internment camps for anyone with as little as one-eighth Japanese ancestry (i.e., one great-grandparent who was Japanese). Over 120,000 legal Japanese residents and Japanese U.S. citizens, many of them children, were held in these camps for up to four years, despite the fact that there was never any evidence of collusion or espionage. (In fact, many Japanese Americans continued to demonstrate their loyalty to the United States by serving in the U.S. military during the War.) In the 1990s, the U.S. executive branch issued a formal apology for this expulsion; reparation efforts continue today.
Segregation refers to the physical separation of two groups, particularly in residence, but also in workplace and social functions. It is important to distinguish between de juresegregation (segregation that is enforced by law) and de factosegregation (segregation that occurs without laws but because of other factors). A stark example of de juresegregation is the apartheid movement of South Africa, which existed from 1948 to 1994. Under apartheid, Black South Africans were stripped of their civil rights and forcibly relocated to areas that segregated them physically from their White compatriots. Only after decades of degradation, violent uprisings, and international advocacy was apartheid finally abolished.
De juresegregation occurred in the United States for many years after the Civil War. During this time, many former Confederate states passed Jim Crow laws that required segregated facilities for Black and White people. These laws were codified in 1896’s landmark Supreme Court case Plessy v. Ferguson, which stated that “separate but equal” facilities were constitutional. For the next five decades, Black people were subjected to legalized discrimination, forced to live, work, and go to school in separate—but unequal—facilities. It wasn’t until 1954 and the Brown v. Board of Education case that the Supreme Court declared that “separate educational facilities are inherently unequal,” thus ending de juresegregation in the United States.
Figure 11.7 — 11.4 Intergroup Relationships
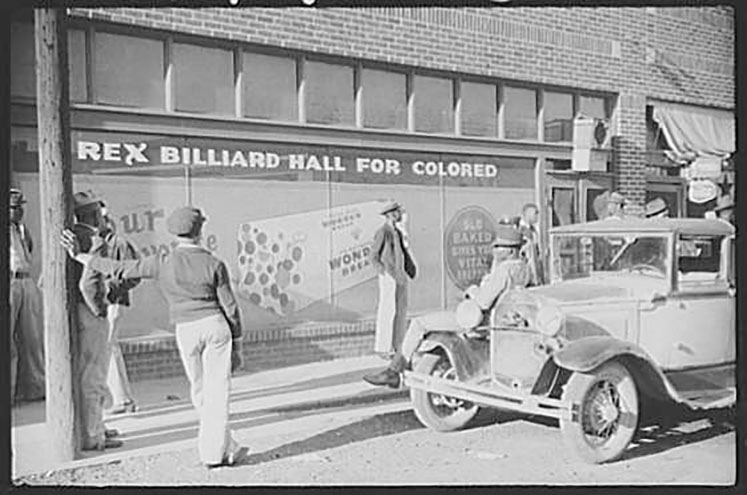
Figure 11.7 In the “Jim Crow” South, it was legal to have “separate but equal” facilities for Black people and White people. (Credit: Library of Congress/Wikimedia Commons)
De factosegregation, however, cannot be abolished by any court mandate. Few institutions desegregated as a result of Brown; in fact, government and even military intervention was necessary to enforce the ruling, and it took the Civil Rights Act and other laws to formalize the equality. Segregation is still alive and well in the United States, with different racial or ethnic groups often segregated by neighborhood, borough, or parish. Sociologists use segregation indices to measure racial segregation of different races in different areas. The indices employ a scale from zero to 100, where zero is the most integrated and 100 is the least. In the New York metropolitan area, for instance, the Black-White segregation index was seventy-nine for the years 2005–2009. This means that 79 percent of either Black or White people would have to move in order for each neighborhood to have the same racial balance as the whole metro region (Population Studies Center 2010).
19.3 Health in the United States
OpenStax · 19.3 Health in the United States ↗ Instructional page including learning objectives, examples, figures, source tables and questions. Site navigation and embedded media players are omitted; source media links remain available.
Learning Objectives
By the end of this section, you should be able to:
Health in the United States is a complex and often contradictory issue. On the one hand, as one of the wealthiest nations, the United States fares well in health comparisons with the rest of the world. However, the United States also lags behind almost every industrialized country in terms of providing care to all its citizens. The following sections look at different aspects of health in the United States.
When looking at the social epidemiology of the United States, it is hard to miss the disparities among races. The discrepancy between Black and White Americans shows the gap clearly; in 2018, the average life expectancy for White males was approximately five years longer than for Black males: 78.8 compared to 74.7 (Wamsley 2021). (Note that in 2020 life expectancies of all races declined further, though the unprecedented COVID-19 pandemic was a significant cause.) Other indicates show a similar disparity. The 2018 infant mortality rates for different races and ethnicities are as follows:
Non-Hispanic Black people: 10.8
Native Hawaiian people or other Pacific Islanders: 9.4
Native American/Alaska Native people: 8.2
Hispanic people: 4.9
Non-Hispanic White people: 4.6
Asian and Asian American people: 3.6 (Centers for Disease Control 2021)
According to a report from the Henry J. Kaiser Foundation (2007), African Americans also have higher incidence of several diseases and causes of mortality, from cancer to heart disease to diabetes. In a similar vein, it is important to note that ethnic minorities, including Mexican Americans and Native Americans, also have higher rates of these diseases and causes of mortality than White people.
Lisa Berkman (2009) notes that this gap started to narrow during the Civil Rights movement in the 1960s, but it began widening again in the early 1980s. What accounts for these perpetual disparities in health among different ethnic groups? Much of the answer lies in the level of healthcare that these groups receive. The National Healthcare Disparities Report shows that even after adjusting for insurance differences, racial and ethnic minority groups receive poorer quality of care and less access to care than dominant groups. The Report identified these racial inequalities in care:
Black people, Native Americans, and Alaska Native people received worse care than Whites for about 40 percent of quality measures.
Hispanic people, Native Hawaiian people, and Pacific Islanders received worse care than White people for more than 30 percent of quality measures.
Asian people received worse care than White people for nearly 30 percent of quality measures but better care for nearly 30 percent of quality measures (Agency for Healthcare Research and Quality 2020).
Discussions of health by race and ethnicity often overlap with discussions of health by socioeconomic status, since the two concepts are intertwined in the United States. As the Agency for Health Research and Quality (2010) notes, “racial and ethnic minorities are more likely than non-Hispanic whites to be poor or near poor,” so much of the data pertaining to subordinate groups is also likely to be pertinent to low socioeconomic groups. Marilyn Winkleby and her research associates (1992) state that “one of the strongest and most consistent predictors of a person's morbidity and mortality experience is that person's socioeconomic status (SES). This finding persists across all diseases with few exceptions, continues throughout the entire lifespan, and extends across numerous risk factors for disease.” Morbidity is the incidence of disease.
It is important to remember that economics are only part of the SES picture; research suggests that education also plays an important role. Phelan and Link (2003) note that many behavior-influenced diseases like lung cancer (from smoking), coronary artery disease (from poor eating and exercise habits), and AIDS initially were widespread across SES groups. However, once information linking habits to disease was disseminated, these diseases decreased in high SES groups and increased in low SES groups. This illustrates the important role of education initiatives regarding a given disease, as well as possible inequalities in how those initiatives effectively reach different SES groups.
Health by Gender
Women are affected adversely both by unequal access to and institutionalized sexism in the healthcare industry. According to a recent report from the Kaiser Family Foundation, women experienced a decline in their ability to see needed specialists between 2001 and 2008. In 2008, one quarter of women questioned the quality of their healthcare (Ranji and Salganico 2011). Quality is partially indicated by access and cost. In 2018, roughly one in four (26%) women—compared to one in five (19%) men—reported delaying healthcare or letting conditions go untreated due to cost. Because of costs, approximately one in five women postponed preventive care, skipped a recommended test or treatment, or reduced their use of medication due to cost (Kaiser Family Foundation 2018).
We can see an example of institutionalized sexism in the way that women are more likely than men to be diagnosed with certain kinds of mental disorders. Psychologist Dana Becker notes that 75 percent of all diagnoses of Borderline Personality Disorder (BPD) are for women according to the Diagnostic Statistical Manual of Mental Disorders. This diagnosis is characterized by instability of identity, of mood, and of behavior, and Becker argues that it has been used as a catch-all diagnosis for too many women. She further decries the pejorative connotation of the diagnosis, saying that it predisposes many people, both within and outside of the profession of psychotherapy, against women who have been so diagnosed (Becker).
Many critics also point to the medicalization of women’s issues as an example of institutionalized sexism. Medicalization refers to the process by which previously normal aspects of life are redefined as deviant and needing medical attention to remedy. Historically and contemporaneously, many aspects of women’s lives have been medicalized, including menstruation, premenstrual syndrome, pregnancy, childbirth, and menopause. The medicalization of pregnancy and childbirth has been particularly contentious in recent decades, with many women opting against the medical process and choosing a more natural childbirth. Fox and Worts (1999) find that all women experience pain and anxiety during the birth process, but that social support relieves both as effectively as medical support. In other words, medical interventions are no more effective than social ones at helping with the difficulties of pain and childbirth. Fox and Worts further found that women with supportive partners ended up with less medical intervention and fewer cases of postpartum depression. Of course, access to quality birth care outside the standard medical models may not be readily available to women of all social classes.
How is your “sleep hygiene?” Sleep hygiene refers to the lifestyle and sleep habits that contribute to sleeplessness. Bad habits that can lead to sleeplessness include inconsistent bedtimes, lack of exercise, late-night employment, napping during the day, and sleep environments that include noise, lights, or screen time (National Institutes of Health 2011a).
According to the National Institute of Health, examining sleep hygiene is the first step in trying to solve a problem with sleeplessness.
For many people in the United States, however, making changes in sleep hygiene does not seem to be enough. According to a 2006 report from the Institute of Medicine, sleeplessness is an underrecognized public health problem affecting up to 70 million people. It is interesting to note that in the months (or years) after this report was released, advertising by the pharmaceutical companies behind Ambien, Lunesta, and Sepracor (three sleep aids) averaged $188 million weekly promoting these drugs (Gellene 2009).
According to a study in the American Journal of Public Health (2011), prescriptions for sleep medications increased dramatically from 1993 to 2007. While complaints of sleeplessness during doctor’s office visits more than doubled during this time, insomnia diagnoses increased more than sevenfold, from about 840,000 to 6.1 million. The authors of the study conclude that sleeplessness has been medicalized as insomnia, and that “insomnia may be a public health concern, but potential overtreatment with marginally effective, expensive medications with nontrivial side effects raises definite population health concerns” (Moloney, Konrad, and Zimmer 2011). Indeed, a study published in 2004 in the Archives of Internal Medicine shows that cognitive behavioral therapy, not medication, was the most effective sleep intervention (Jacobs, Pace-Schott, Stickgold, and Otto 2004).
A century ago, people who couldn’t sleep were told to count sheep. Now they pop a pill, and all those pills add up to a very lucrative market for the pharmaceutical industry. Is this industry behind the medicalization of sleeplessness, or is it just responding to a need?
Mental Health and Disability
The treatment received by those defined as mentally ill or disabled varies greatly from country to country. In the post-millennial United States, those of us who have never experienced such a disadvantage take for granted the rights our society guarantees for each citizen. We do not think about the relatively recent nature of the protections, unless, of course, we know someone constantly inconvenienced by the lack of accommodations or misfortune of suddenly experiencing a temporary disability.
Mental Health
People with mental disorders (a condition that makes it more difficult to cope with everyday life) and people with mental illness (a severe, lasting mental disorder that requires long-term treatment) experience a wide range of effects. According to the National Institute of Mental Health (NIMH), the United States has over 50 million adults with mental illness or mental disorder, or 20 percent of the total adult population. Of these, 13 million have what is considered serious mental illness or mental disorder (5 percent of the adult population); serious mental illness is that which causes impairment or disability (National Institute of Mental Health 2021). Finally, 16.5 percent of children aged 6-17 experienced mental illness or disorder (National Alliance on Mental Illness 2021).
The most common mental disorders in the United States are anxiety disorders. Almost 18 percent of U.S. adults are likely to be affected in a single year, and 28 percent are likely to be affected over the course of a lifetime (Anxiety and Depression Institute of America 2021). It is important to distinguish between occasional feelings of anxiety and a true anxiety disorder. Anxiety is a normal reaction to stress that we all feel at some point, but anxiety disorders are feelings of worry and fearfulness that last for months at a time. Anxiety disorders include obsessive compulsive disorder (OCD), panic disorders, posttraumatic stress disorder (PTSD), and both social and specific phobias.
The second most common mental disorders in the United States are mood disorders; roughly 10 percent of U.S. adults are likely to be affected yearly, while 21 percent are likely to be affected over the course of a lifetime (National Institute of Mental Health 2005). Mood disorders are the most common causes of illness-related hospitalization in the U.S. (Agency for Healthcare Research and Quality 2021). Major mood disorders are depression and dysthymic disorder. Like anxiety, depression might seem like something that everyone experiences at some point, and it is true that most people feel sad or “blue” at times in their lives. A true depressive episode, however, is more than just feeling sad for a short period. It is a long-term, debilitating illness that usually needs treatment to cure. Bipolar disorder is characterized by dramatic shifts in energy and mood, often affecting the individual’s ability to carry out day-to-day tasks. Bipolar disorder used to be called manic depression because of the way people would swing between manic and depressive episodes.
Depending on what definition is used, there is some overlap between mood disorders and personality disorders, which affect 9 percent of people in the United States yearly. A personality disorder is an enduring and inflexible pattern of long duration leading to significant distress or impairment, that is not due to use of substances or another medical condition. In other words, personality disorders cause people to behave in ways that are seen as abnormal to society but seem normal to them.
The diagnosis and classification regarding personality disorders has been evolving and is somewhat controversial. To guide diagnosis and potential treatments of mental disorders, the American Psychiatric Association publishes the Diagnostic and Statistical Manual on Mental Disorders (DSM). Experts working on the latest version initially proposed changing the categories of personality disorders. However, the final publication retains the original ten categories, but contains an alternate/emerging approach for classifying them. This evolution demonstrates the challenges and the wide array of treating conditions, and also represents areas of difference between theorists, practitioners, governing bodies, and other stakeholders. As discussed in the Sociological Research chapter, study and investigation is a diligent and multi-dimensional process. As the diagnostic application evolves, we will see how their definitions help scholars across disciplines understand the intersection of health issues and how they are defined by social institutions and cultural norms.
Figure 19.5 — 19.3 Health in the United States
Figure 19.5 Medication is a common option for children with ADHD. (Credit: Deviation56/Wikimedia Commons)
Another commonly diagnosed mental disorder is Attention-Deficit/Hyperactivity Disorder (ADHD), which affects 9 percent of U.S. children and 4 percent of adults on a lifetime basis (Danielson 2018). Since ADHD is one of the most common childhood disorders, it is often incorrectly considered only a disease found in children. But ADHD can be a serious issue for adults who either had been diagnosed as children or who are diagnosed as adults. ADHD is marked by difficulty paying attention, difficulty controlling behavior, and hyperactivity. As a result, it can lead to educational and behavioral issues in children, success issues in college, and challenges in workplace and family life. However, there is some social debate over whether such drugs are being overprescribed (American Psychological Association). A significant difficulty in diagnosis, treatment, and societal understanding of ADHD is that it changes in expression based on a wide range of factors, including age (CHADD 2020).
Autism Spectrum Disorders (ASD) encompass a group of developmental brain disorders that are characterized by "deficits in social interaction, verbal and nonverbal communication, and engagement in repetitive behaviors or interests” (National Institute of Mental Health). As of 2021, the CDC estimates that 1 in 54 children has an autism spectrum disorder. Beyond the very high incidence, the rate of diagnosis has been increasing steadily as awareness became more widespread. In 2005, the rate was 1 in 166 children; in 2012 it was 1 in 88 children. The rate of increase and awareness has assisted diagnosis and treatment, but autism is a cause of significant fear among parents and families. Because of its impact on relationships and especially verbal communication, children with autism (and their parents) can be shunned, grossly misunderstood, and mistreated. For example, people with an autism spectrum disorder who cannot verbalize are often assumed to be unintelligent, or are sometimes left out of conversations or activities because others feel they cannot participate. Parents may be reluctant to let their children play with or associate with children with ASD. Adults with ASD go through many of the same misconceptions and mistreatments, such as being denied opportunities or being made to feel unwelcome (Applied Behavior Analysis).
Disability
Figure 19.6 — 19.3 Health in the United States
Figure 19.6 The accessibility sign indicates that people with disabilities can access the facility. The Americans with Disabilities Act requires that access be provided to everyone. (Credit: Ltljltlj/Wikimedia Commons)
Disability refers to a reduction in one’s ability to perform everyday tasks. The World Health Organization makes a distinction between the various terms used to describe disabilities. They use the term impairment to describe the physical limitations, while reserving the term disability to refer to the social limitation.
Before the passage of the Americans with Disabilities Act (ADA) in 1990, people in the United States with disabilities were often excluded from opportunities and social institutions many of us take for granted. This occurred not only through employment and other kinds of discrimination but also through casual acceptance by most people in the United States of a world designed for the convenience of the able-bodied. Imagine being in a wheelchair and trying to use a sidewalk without the benefit of wheelchair-accessible curbs. Imagine as a blind person trying to access information without the widespread availability of Braille. Imagine having limited motor control and being faced with a difficult-to-grasp round door handle. Issues like these are what the ADA tries to address. Ramps on sidewalks, Braille instructions, and more accessible door levers are all accommodations to help people with disabilities.
People with disabilities can be stigmatized by their illnesses. Stigmatization means their identity is spoiled; they are labeled as different, discriminated against, and sometimes even shunned. They are labeled (as an interactionist might point out) and ascribed a master status (as a functionalist might note), becoming “the blind girl” or “the boy in the wheelchair” instead of someone afforded a full identity by society. This can be especially true for people who are disabled due to mental illness or disorders.
As discussed in the section on mental health, many mental health disorders can be debilitating and can affect a person’s ability to cope with everyday life. This can affect social status, housing, and especially employment. According to the Bureau of Labor Statistics (2011), people with a disability had a higher rate of unemployment than people without a disability in 2010: 14.8 percent to 9.4 percent. This unemployment rate refers only to people actively looking for a job. In fact, eight out of ten people with a disability are considered “out of the labor force;” that is, they do not have jobs and are not looking for them. The combination of this population and the high unemployment rate leads to an employment-population ratio of 18.6 percent among those with disabilities. The employment-population ratio for people without disabilities was much higher, at 63.5 percent (U.S. Bureau of Labor Statistics 2011).
Many people who see a person with obesity may make negative assumptions about them based on their size. According to a study from the Yale Rudd Center for Food Policy and Obesity, large people are the object of “widespread negative stereotypes that overweight and obese persons are lazy, unmotivated, lacking in self-discipline, less competent, noncompliant, and sloppy” (Puhl and Heuer 2009).
Historically, both in the United States and elsewhere, it was considered acceptable to discriminate against people based on prejudiced opinions. Even after slavery was abolished through the 13th Amendment in 1865, institutionalized racism and prejudice against Black people persisted. In an example of stereotype interchangeability, the same insults that are flung today at the overweight and obese population (lazy, for instance) have been flung at various racial and ethnic groups in earlier history.
Why is it considered acceptable to feel prejudice toward—even to hate—people with obesity? Puhl and Heuer suggest that these feelings stem from the perception that obesity is preventable through self-control, better diet, and more exercise. Highlighting this contention is the fact that studies have shown that people’s perceptions of obesity are more positive when they think the obesity was caused by non-controllable factors like biology (a thyroid condition, for instance) or genetics.
Health experts emphasize that obesity is a disease, and that it is not the result of simple overeating. There are often a number of contributing factors that make it more difficult to avoid. Even with some understanding of non-controllable factors that might affect obesity, people with obesity are still subject to stigmatization. Puhl and Heuer’s study is one of many that document discrimination at work, in the media, and even in the medical profession. Large people are less likely to get into college than thinner people, and they are less likely to succeed at work.
Stigmatization of people with obesity comes in many forms, from the seemingly benign to the potentially illegal. In movies and television shows, overweight people are often portrayed negatively, or as stock characters who are the butt of jokes. One study found that in children’s movies “obesity was equated with negative traits (evil, unattractive, unfriendly, cruel) in 64 percent of the most popular children's videos. In 72 percent of the videos, characters with thin bodies had desirable traits, such as kindness or happiness” (Hines and Thompson 2007). In movies and television for adults, the negative portrayal is often meant to be funny. Think about the way you have seen obese people portrayed in movies and on television; now think of any other subordinate group being openly denigrated in such a way. It is difficult to find a parallel example.