Foundation 10 · 10A · Stratification and access to resources

Class, capital, , and inequality

Sources ↗

organizes unequal resources, opportunities, and status into durable patterns.

Distinguish social class, , , and

organizes unequal resources, opportunities, and status into durable patterns. Social class concerns economic position, including relation to property and work; commonly combines income, education, and occupation. Income is a flow over time, whereas is accumulated assets minus debts. Marxist involves recognizing shared class interests and relations; describes beliefs that obscure those interests within that theoretical framework. Weber distinguished class, status, and political rather than treating one economic dimension as sufficient. A high income can coexist with low , unstable employment, or limited , so the chosen measure changes the interpretation.

Source: 9.1 What Is Social Stratification? · 9.2 Social Stratification and Mobility in the United States · 9.4 Theoretical Perspectives on Social Stratification · 10.1 Global Stratification and Classification · 19.3 Health in the United States

Explain cultural and , , , , and

includes valued knowledge, styles, credentials, and familiarity with institutional expectations; involves resources accessible through relationships and networks. Economic capital can purchase opportunities that develop both. describes processes through which advantage or disadvantage persists across generations through families, schools, neighborhoods, and institutions. enables decisions, provides often taken-for-granted advantages, and confers esteem; they can reinforce one another without being identical. A hiring process that rewards familiarity with elite interaction styles may reproduce class differences even without explicitly testing income. Specify the institutional pathway rather than treating capital as a vague synonym for talent.

Source: 9.1 What Is Social Stratification? · 9.2 Social Stratification and Mobility in the United States · 9.4 Theoretical Perspectives on Social Stratification · 10.1 Global Stratification and Classification · 19.3 Health in the United States

Use intersecting social positions to interpret socioeconomic health and global inequality

Socioeconomic are patterned health differences across the social hierarchy, often extending beyond a simple poor-versus-not-poor contrast. Material conditions, occupational exposure, chronic stress, , and can contribute. examines how race, gender, class, disability, and other positions combine within institutions; effects need not be simply additive. Global inequality concerns unequal resources and across and within countries, shaped by historical, political, and economic relationships. National averages can hide large internal inequalities. Avoid attributing a group difference to or genetics without directly testing those mechanisms and accounting for structural conditions.

Source: 9.1 What Is Social Stratification? · 9.2 Social Stratification and Mobility in the United States · 9.4 Theoretical Perspectives on Social Stratification · 10.1 Global Stratification and Classification · 19.3 Health in the United States

Apply the ideas

Worked question. Two applicants have similar test scores, but one knows alumni who explain interview conventions and provide referrals. Which forms of capital are involved? Does this establish that the applicant lacks merit?

The network supplies and knowledge of valued conventions supplies . The mechanism can reproduce advantage without implying that the applicant has no skill. Compare access to information and referrals while measuring qualifications. A claim of requires examining opportunity and selection rules, not merely observing that successful people worked hard.

Source: 9.1 What Is Social Stratification? · 9.2 Social Stratification and Mobility in the United States · 9.4 Theoretical Perspectives on Social Stratification · 10.1 Global Stratification and Classification · 19.3 Health in the United States

9.1 What Is ? — figures and tables

A man and a woman, both wearing business suits, are shown from behind at the top of an escalator
Figure 9.2 — 9.1 What Is ?

Figure 9.2 In the upper echelons of the working world, people with the most power reach the top. These people make the decisions and earn the most money. The majority of Americans will never see the view from the top. (Credit: Alex Proimos/flickr)

Tonja R. Conerly, Kathleen Holmes, and Asha Lal Tamang, Introduction Sociology 3E, OpenStax. · CC BY-NC-SA 4.0 · Original image ↗ · Access for free ↗

A rock formation showing various layers is shown.
Figure 9.3 — 9.1 What Is ?

Figure 9.3 Strata in rock illustrate social stratification. People are sorted, or layered, into social categories. Many factors determine a person’s social standing, such as wealth, income, education, family background, and power. (Credit: Just a Prairie Boy/flickr)

Tonja R. Conerly, Kathleen Holmes, and Asha Lal Tamang, Introduction Sociology 3E, OpenStax. · CC BY-NC-SA 4.0 · Original image ↗ · Access for free ↗
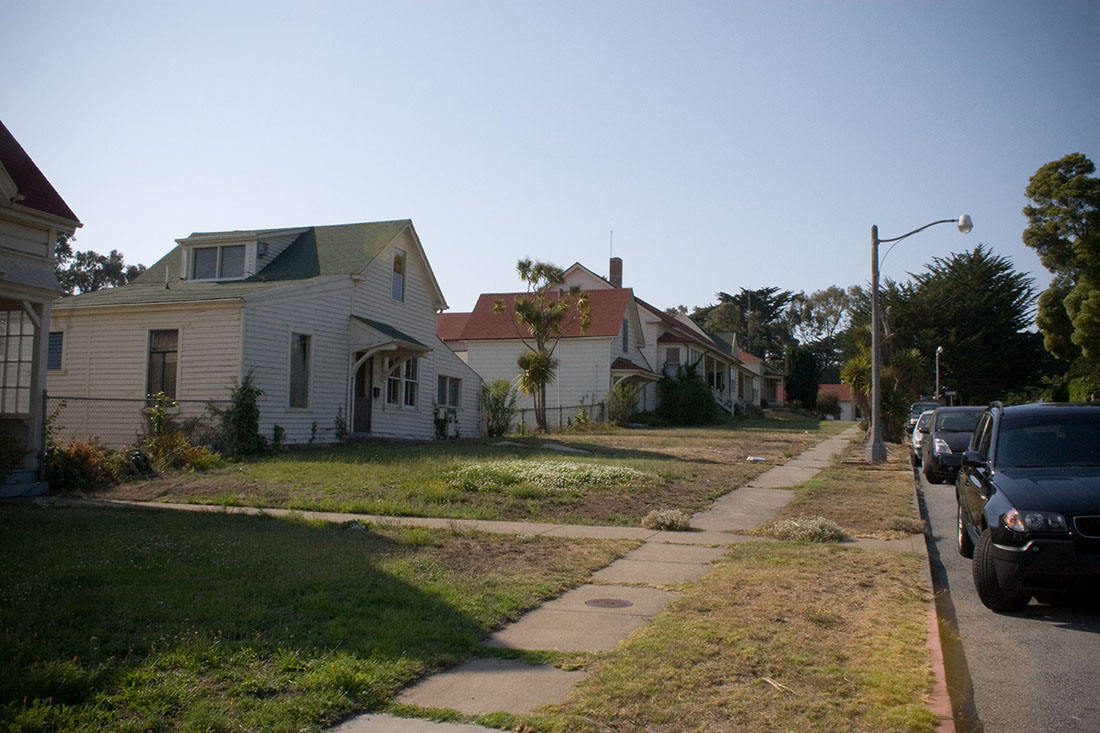
One side of a block of rowhouses and cars covered in snow is shown.
Figure 9.4 — 9.1 What Is ?

Figure 9.4 The people who live in these houses most likely share similar levels of income and education. Neighborhoods often house people of the same social standing. Wealthy families do not typically live next door to poorer families, though this varies depending on the particular city and country. (Credit: Orin Zebest/flickr)

Tonja R. Conerly, Kathleen Holmes, and Asha Lal Tamang, Introduction Sociology 3E, OpenStax. · CC BY-NC-SA 4.0 · Original image ↗ · Access for free ↗
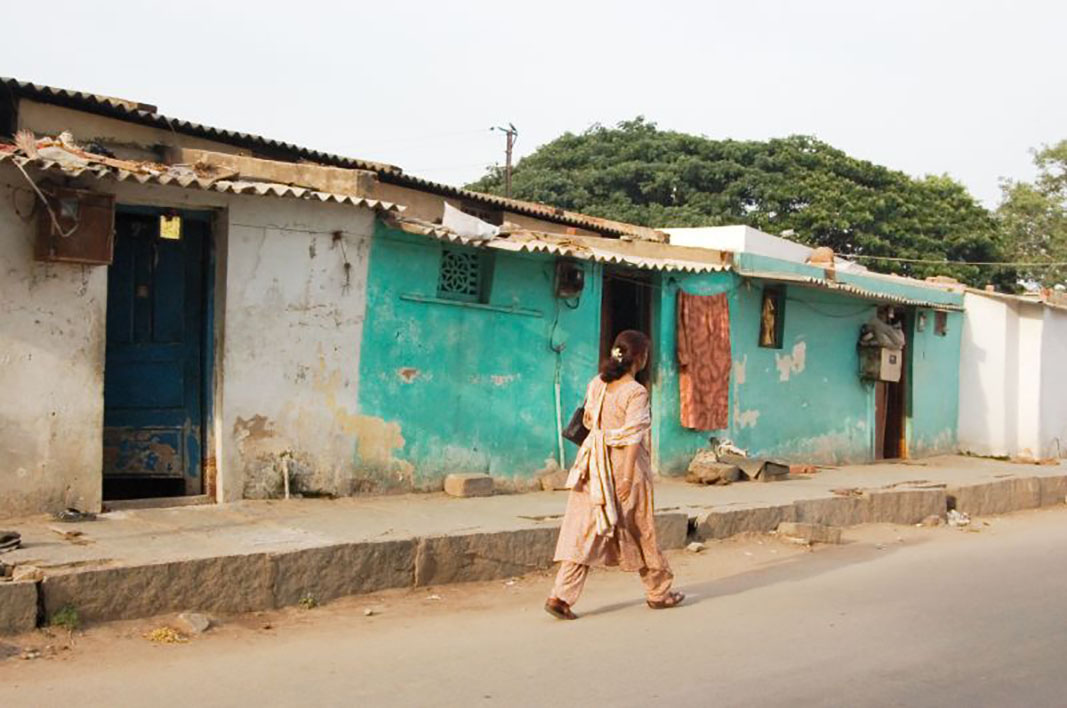
A woman in India is shown from behind walking down the street.
Figure 9.5 — 9.1 What Is ?

Figure 9.5 India used to have a rigid caste system. The people in the lowest caste suffered from extreme poverty and were shunned by society. Some aspects of India’s defunct caste system remain socially relevant. (Credit: Elessar/flickr)

Tonja R. Conerly, Kathleen Holmes, and Asha Lal Tamang, Introduction Sociology 3E, OpenStax. · CC BY-NC-SA 4.0 · Original image ↗ · Access for free ↗

Meghan Markle and Prince Harry stand next to each other with Catherine, Duchess of Cambridge. People take pictures of them.
Figure 9.6 — 9.1 What Is ?

Figure 9.6 Prince Harry and Meghan Markle with other members of the Royal family, in 2017. One year later, the couple would wed and the American-born actress and fashion-designer would immediately become Her Royal Highness The Duchess of Sussex, a position and title that bestows significant benefits of social class (Credit: Mark Jones/Wikimedia Commons)

Tonja R. Conerly, Kathleen Holmes, and Asha Lal Tamang, Introduction Sociology 3E, OpenStax. · CC BY-NC-SA 4.0 · Original image ↗ · Access for free ↗

Source: 9.1 What Is Social Stratification?

9.2 and Mobility in the United States — figures and tables

Two people with extremely spiked hair stand at a table in what looks like a studio.
Figure 9.7 — 9.2 and Mobility in the United States

Figure 9.7 Does taste or fashion sense indicate class? Is there any way to tell if these people come from an upper-, middle-, or lower-class background? (Credit: Kelly Bailey/flickr)

Tonja R. Conerly, Kathleen Holmes, and Asha Lal Tamang, Introduction Sociology 3E, OpenStax. · CC BY-NC-SA 4.0 · Original image ↗ · Access for free ↗

A luxurious house and grounds.
Figure 9.8 — 9.2 and Mobility in the United States

Figure 9.8 Members of the upper class can afford to live, work, and play in exclusive places, such as country clubs and gated communities, designed for luxury, safety, and comfort. (Credit: PrimeImageMedia.com/flickr)

Tonja R. Conerly, Kathleen Holmes, and Asha Lal Tamang, Introduction Sociology 3E, OpenStax. · CC BY-NC-SA 4.0 · Original image ↗ · Access for free ↗
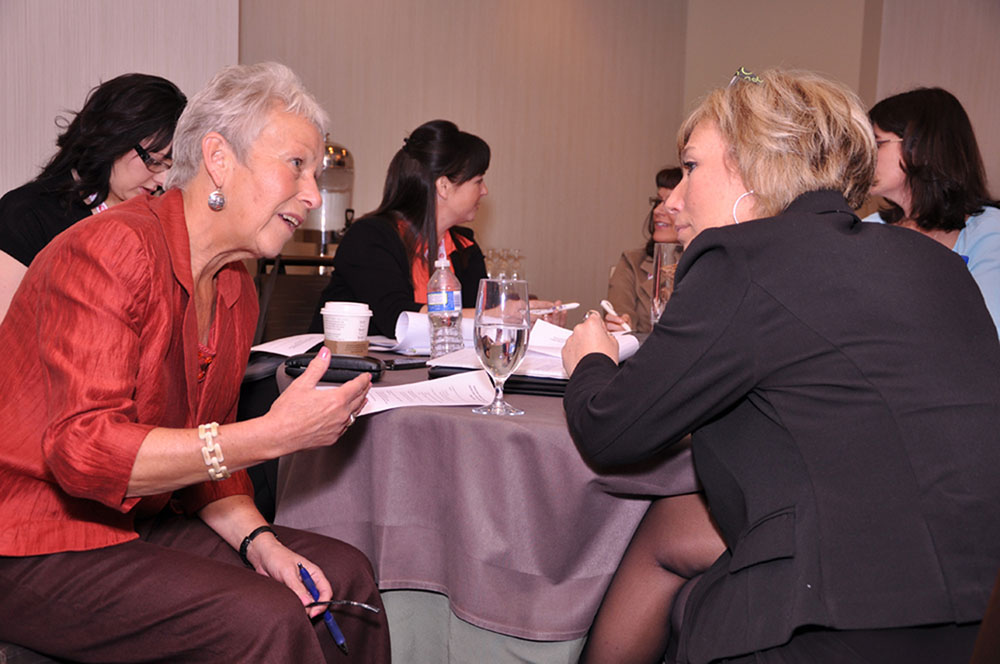
A group of women are shown talking and eating.
Figure 9.9 — 9.2 and Mobility in the United States

Figure 9.9 These members of a club likely consider themselves middle class, as do many Americans. (Credit: United Way Canada-Centraide Canada/flickr)

Tonja R. Conerly, Kathleen Holmes, and Asha Lal Tamang, Introduction Sociology 3E, OpenStax. · CC BY-NC-SA 4.0 · Original image ↗ · Access for free ↗
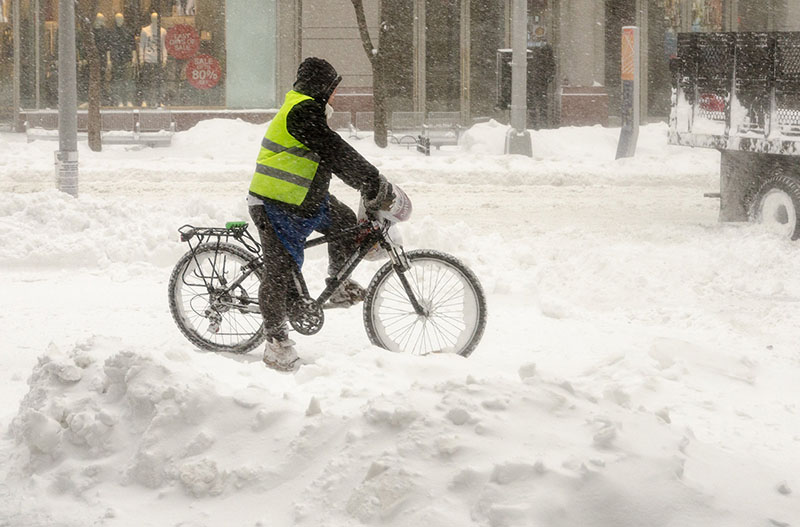
A bicycle messenger or delivery person stands with their bike still on a snowy street while a truck drives in front of them.
Figure 9.10 — 9.2 and Mobility in the United States

Figure 9.10 Bike messengers and bike delivery people are often considered members of the working class. They endure difficult and dangerous conditions to do their work, and they are not always well represented by government agencies and in regulations designed for safety or fairness. (Credit: edwardhblake/flickr)

Tonja R. Conerly, Kathleen Holmes, and Asha Lal Tamang, Introduction Sociology 3E, OpenStax. · CC BY-NC-SA 4.0 · Original image ↗ · Access for free ↗
Source: 9.2 Social Stratification and Mobility in the United States

9.4 Theoretical Perspectives on — figures and tables

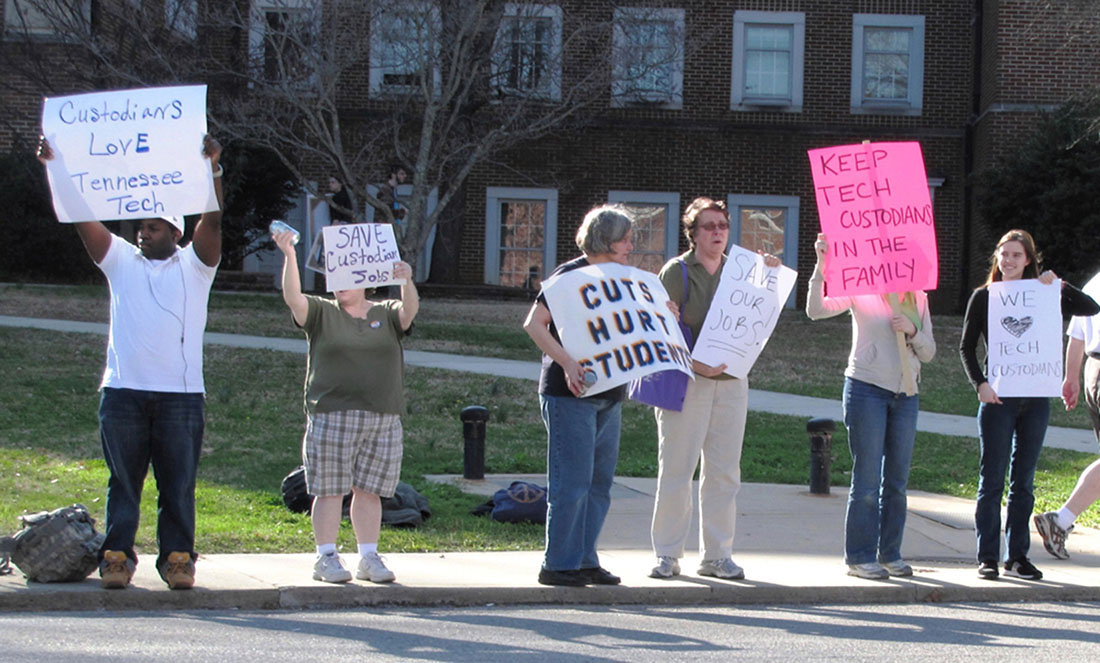
A group of people are shown standing on a sidewalk holding protest signs.
Figure 9.13 — 9.4 Theoretical Perspectives on

Figure 9.13 These people are protesting a decision made by Tennessee Technological University in Cookeville, Tennessee, to lay off custodians and outsource the jobs to a private firm to avoid paying employee benefits. Private job agencies often pay lower hourly wages. Is the decision fair? (Credit: Brian Stansberry/Wikimedia Commons)

Tonja R. Conerly, Kathleen Holmes, and Asha Lal Tamang, Introduction Sociology 3E, OpenStax. · CC BY-NC-SA 4.0 · Original image ↗ · Access for free ↗
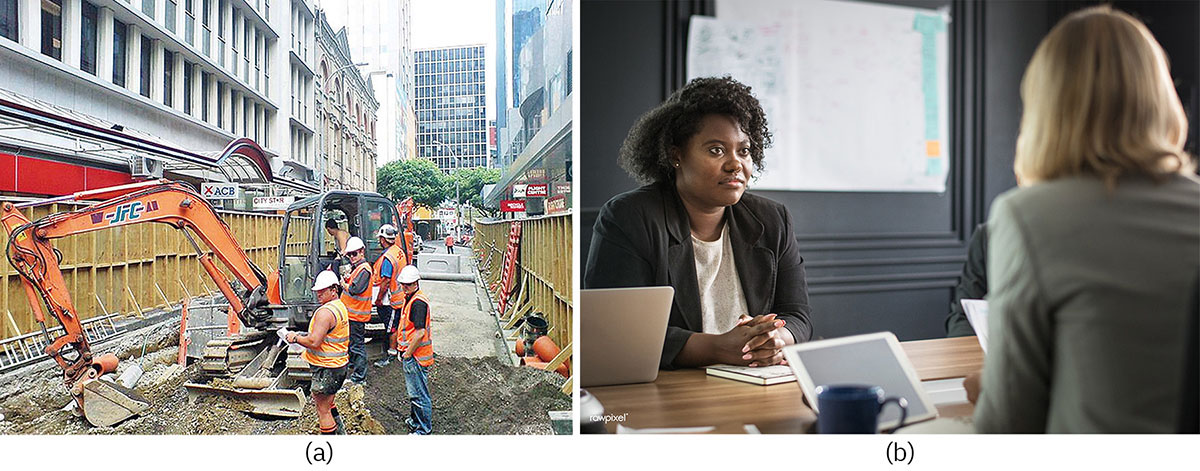
Figure a shows workers at a construction site. Figure B shows two people in business attire at a meeting in what appears to be a conference room.
Figure 9.14 — 9.4 Theoretical Perspectives on

Figure 9.14 (a) A group of construction workers on the job site, and (b) businesspeople in a meeting. What categories of stratification do these construction workers share? How do construction workers differ from executives or custodians? Who is more skilled? Who has greater prestige in society? (Credit: (a) Wikimedia Commons; Photo (b) Chun Kit/flickr)

Tonja R. Conerly, Kathleen Holmes, and Asha Lal Tamang, Introduction Sociology 3E, OpenStax. · CC BY-NC-SA 4.0 · Original image ↗ · Access for free ↗

Source: 9.4 Theoretical Perspectives on Social Stratification

10.1 Global Stratification and Classification — figures and tables
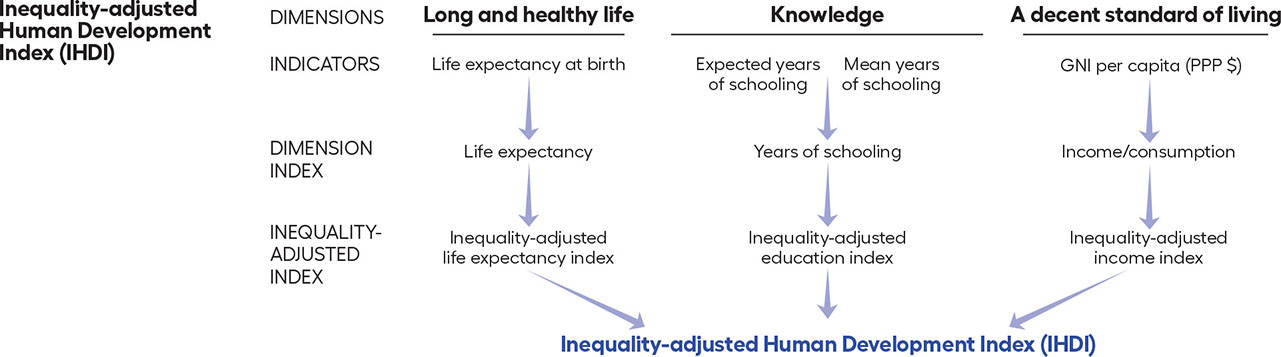
The Inequality-adjusted human development index (H D I) is shown. It has three dimensions. The first dimension is long and healthy life, which is measured by life expectancy. The second dimension is knowledge, which consists of expected years of schooling and mean years of schooling. The third dimension is a decent standard of living, which is measured by income per capita. All three produce indices, and then they are averaged, at the bottom, to produce the final index.
Figure 10.2 — 10.1 Global Stratification and Classification

Figure 10.2 The Human Development Index and its derivative, and extensions like the Inequality-adjusted Human Development Index (IHDI), were developed to center people—not just finances—as the core determinants of a nation's or region's discussions about economic opportunities, support, and policies. The index considers three main dimension (categories)—which are health, knowledge, and standard of living (income)—to calculate an individual value for each dimension, which is then averaged to produce the final value. (Under decent standard of living, GNI stands for gross national income, and PPP stands for purchasing power parity, both of which are key indicators of income and relative wealth.) (Credit: United Nations Development Programme)

Tonja R. Conerly, Kathleen Holmes, and Asha Lal Tamang, Introduction Sociology 3E, OpenStax. · CC BY-NC-SA 4.0 · Original image ↗ · Access for free ↗
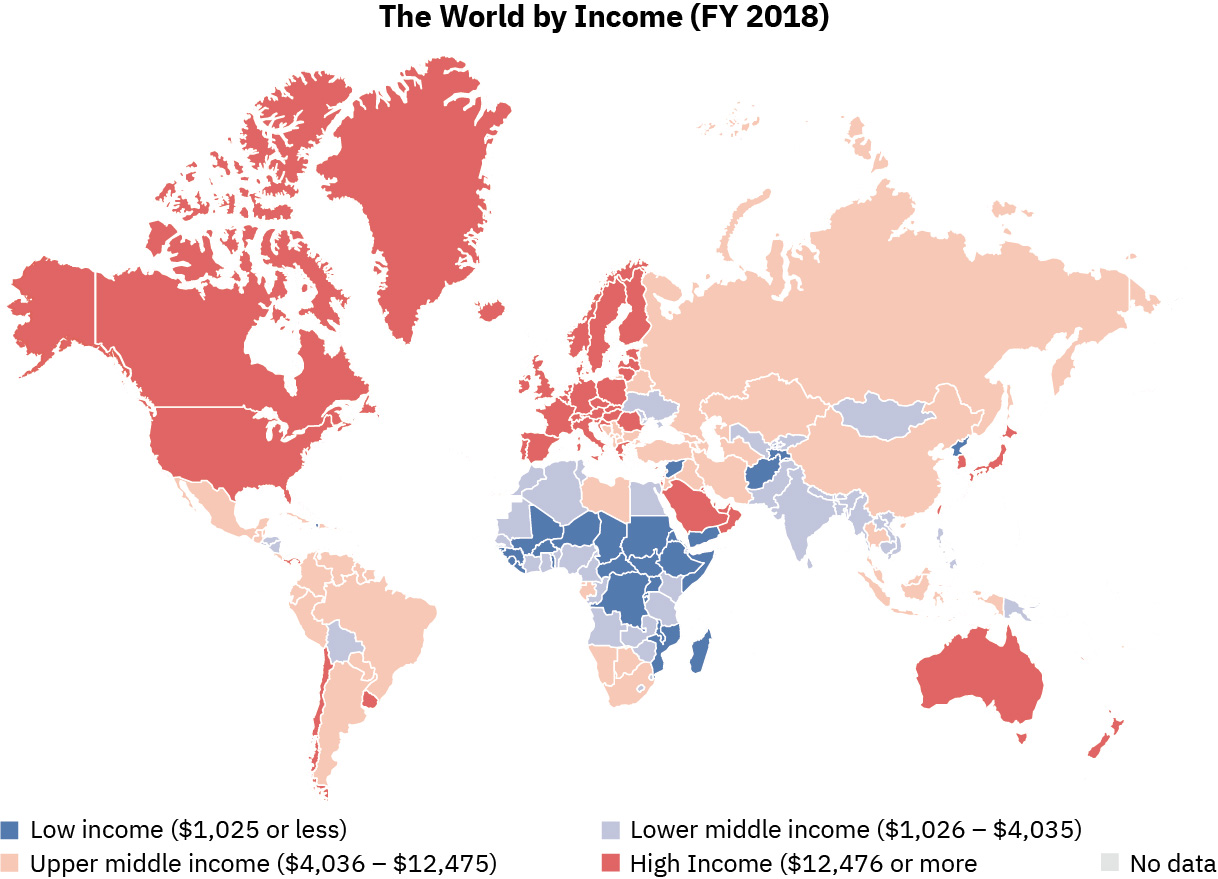
This world map shows advanced, transitioning, less, and least developed countries. Low income countries are those with an annual income of $1025 or less per capita, and include Afghanistan, Syria, Yemen, Madagascar, and many central African nations. Lower middle income countries have an annual income between $1026 and $4035 per capita, and include India, Pakistan, Vietnam, Burma, Papua New Guinea, Ukraine, Moldova, Bolivia, and many countries on the African coastal areas. Upper middle income countries have an income between $4036 and $12075, and include Russia, China, Kazakstan, Romania, Iran, Iraq, Libya, Mexico, and most South American countries as well as the nations in the very south of Africa. High income countries have an income over $12076 per capita and include Saudi Arabia, Oman, Australia, Japan, South Korea, most of Europe, Chile, Uruguay, The United States, and Canada.
Figure 10.3 — 10.1 Global Stratification and Classification

Figure 10.3 This world map shows advanced, transitioning, less, and least developed countries. Note that the data in this map is one year older than the data presented in the text below. (Credit: Sbw01f, data obtained from the CIA World Factbook/Wikimedia Commons)

Tonja R. Conerly, Kathleen Holmes, and Asha Lal Tamang, Introduction Sociology 3E, OpenStax. · CC BY-NC-SA 4.0 · Original image ↗ · Access for free ↗
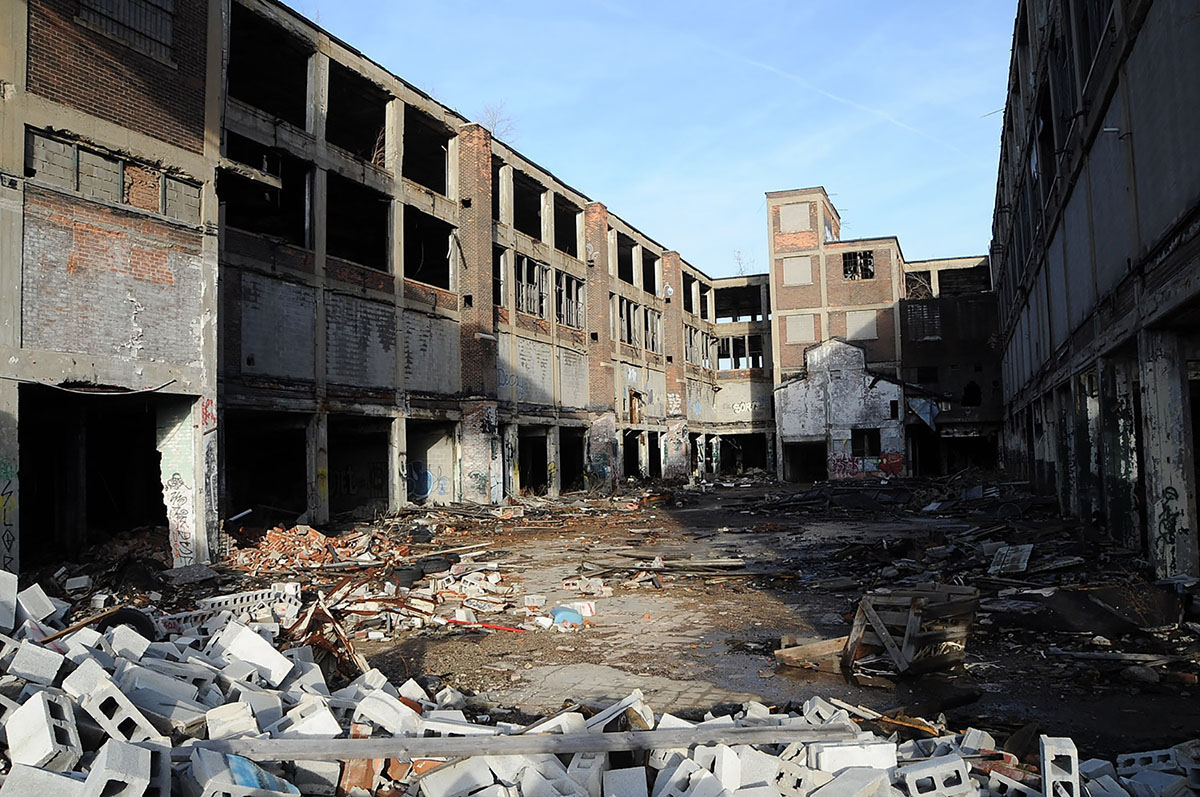
A large open space within a factory complex is littered with discarded cinder blocks, garbage, and pieces that have broken off the buildings. The structures all have broken windows and eroding concrete.
Figure 10.4 — 10.1 Global Stratification and Classification

Figure 10.4 Factories and stores in places like the Detroit metro area have been closed and abandoned as companies go out of business. (Credit: Joe Nuxoll/flickr)

Tonja R. Conerly, Kathleen Holmes, and Asha Lal Tamang, Introduction Sociology 3E, OpenStax. · CC BY-NC-SA 4.0 · Original image ↗ · Access for free ↗
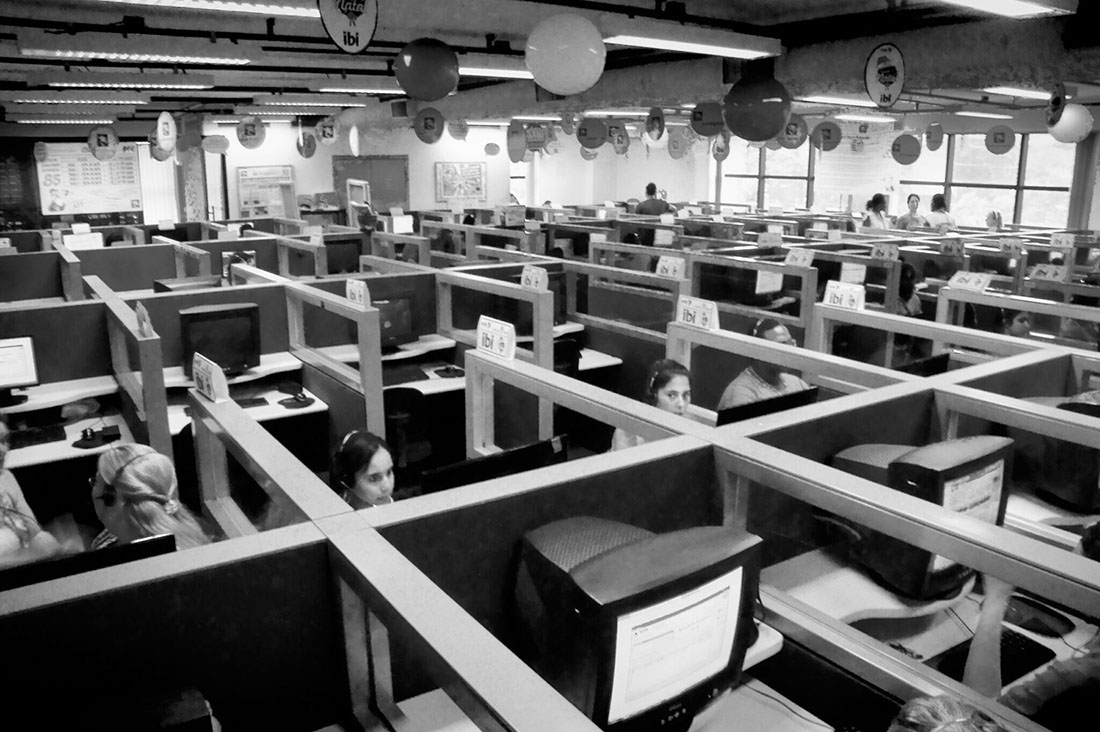
Many people at workstations in a call center are shown here.
Figure 10.5 — 10.1 Global Stratification and Classification

Figure 10.5 Outsourcing was initially a practice for manufacturing and related work. But as more technically skilled people become more available in other countries, customer service and other services are being moved out of the United States as well? (Credit: Carlos Ebert/flickr)

Tonja R. Conerly, Kathleen Holmes, and Asha Lal Tamang, Introduction Sociology 3E, OpenStax. · CC BY-NC-SA 4.0 · Original image ↗ · Access for free ↗
Country Percentage of people living on less than $1.90 Percentage of people living on less than $3.90 Percentage of people living on less than $5.50
Colombia 4.1 10.9 27.8
Costa Rica 1.4 3.6 10.9
Georgia 4.5 15.7 42.9
Kyrgyzstan 0.9 15.5 61.3
Sierra Leone 40.1 74.4 92.1
Angola 51.8 73.2 89.3
Lithuania 0.7 1.0 3.8
Ukraine 0.0 0.4 4.0
Vietnam 1.9 7.0 23.6
Indonesia 3.6 9.6 53.2

Table 10.1 The differences among countries is clear when considering their extreme poverty rates. For the most part, the selected countries show disparities even within countries from the same regions. All data is from 2018. (World Bank 2020). Tonja R. Conerly, Kathleen Holmes, and Asha Lal Tamang, Introduction Sociology 3E, OpenStax.

Source: 10.1 Global Stratification and Classification

19.3 Health in the United States — figures and tables
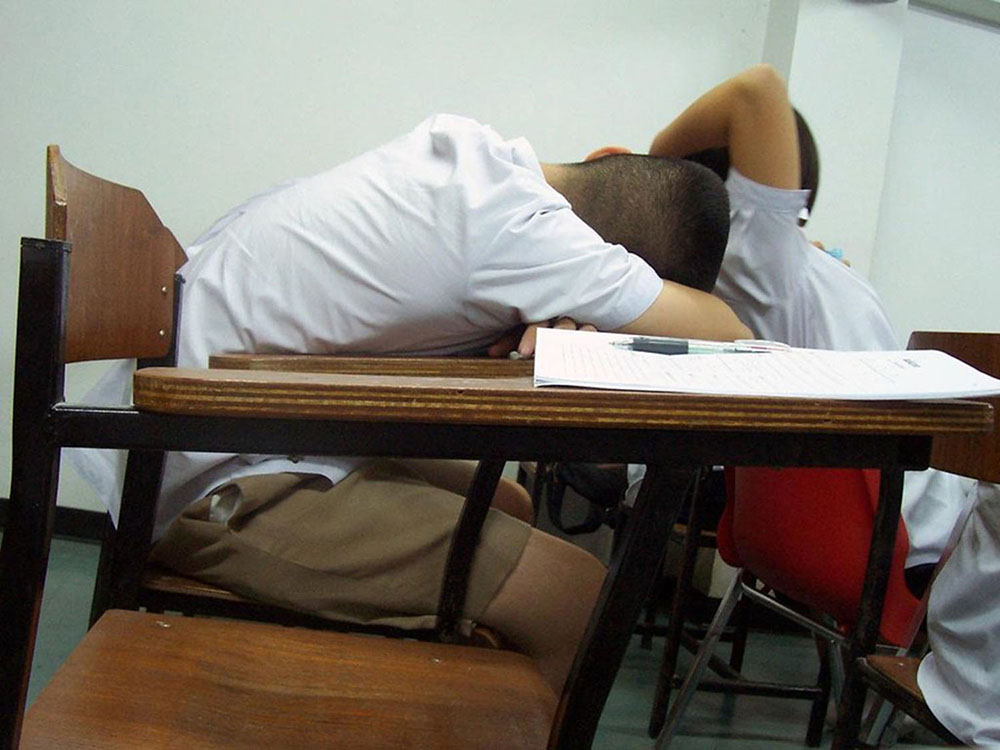
A child asleep at his desk is shown here.
Figure 19.4 — 19.3 Health in the United States

Figure 19.4 Many people fail to get enough sleep. But is insomnia a disease that should be cured with medication? (Credit: Wikimedia Commons)

Tonja R. Conerly, Kathleen Holmes, and Asha Lal Tamang, Introduction Sociology 3E, OpenStax. · CC BY-NC-SA 4.0 · Original image ↗ · Access for free ↗
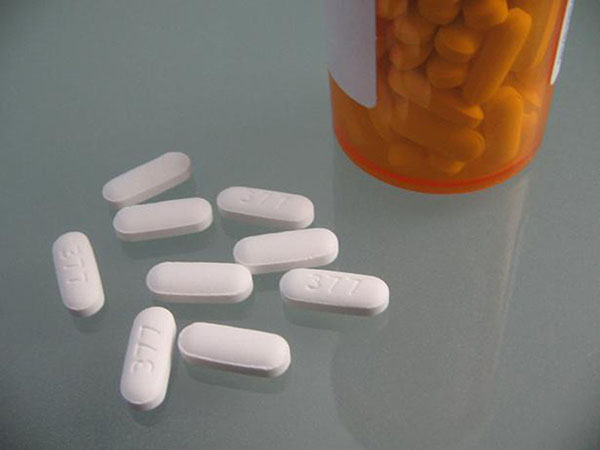
White pills next to a pill bottle are shown here.
Figure 19.5 — 19.3 Health in the United States

Figure 19.5 Medication is a common option for children with ADHD. (Credit: Deviation56/Wikimedia Commons)

Tonja R. Conerly, Kathleen Holmes, and Asha Lal Tamang, Introduction Sociology 3E, OpenStax. · CC BY-NC-SA 4.0 · Original image ↗ · Access for free ↗

A blue handicapped accessible sign is shown here.
Figure 19.6 — 19.3 Health in the United States

Figure 19.6 The accessibility sign indicates that people with disabilities can access the facility. The Americans with Disabilities Act requires that access be provided to everyone. (Credit: Ltljltlj/Wikimedia Commons)

Tonja R. Conerly, Kathleen Holmes, and Asha Lal Tamang, Introduction Sociology 3E, OpenStax. · CC BY-NC-SA 4.0 · Original image ↗ · Access for free ↗

Source: 19.3 Health in the United States

185 terms, alphabetically ordered

absolute poverty

Insufficient resources to meet a specified basic-needs standard.

Read explanation · OpenStax ↗
access to care

Practical opportunity to obtain needed health services.

Read explanation · OpenStax ↗
Acid · ·

In the Brønsted–Lowry model, a substance that can donate a . Acidic have a higher activity than water.

Read explanation · OpenStax ↗
Activation energy ·

The energy barrier that must overcome to reach a and undergo .

Read explanation · OpenStax ↗
Adenosine triphosphate

An energy-carrying ; its powers many cellular processes, including cycles.

Read explanation · OpenStax ↗
Allele

One version or copy of a at a ; a typical cell carries two copies of an autosomal .

Read explanation · NCBI Bookshelf / Sinauer Associates ↗
Alpha carbon · ·

The central carbon next to the carboxyl carbon. In a standard it binds an , hydrogen, and .

Read explanation · OpenStax ↗
Alpha helix · · · · · ·

A helical stabilized by between a oxygen and an hydrogen four later.

Read explanation · OpenStax ↗
Amide · · ·

A group containing a carbon bonded to nitrogen. are amide linkages.

Read explanation · OpenStax ↗
Amino acid

A building block containing amino and and a characteristic .

Read explanation · OpenStax ↗
Amino acid residue · ·

The part of an incorporated into a chain. Residue can also describe another building block within a larger .

Read explanation · OpenStax ↗
Amino group · · ·

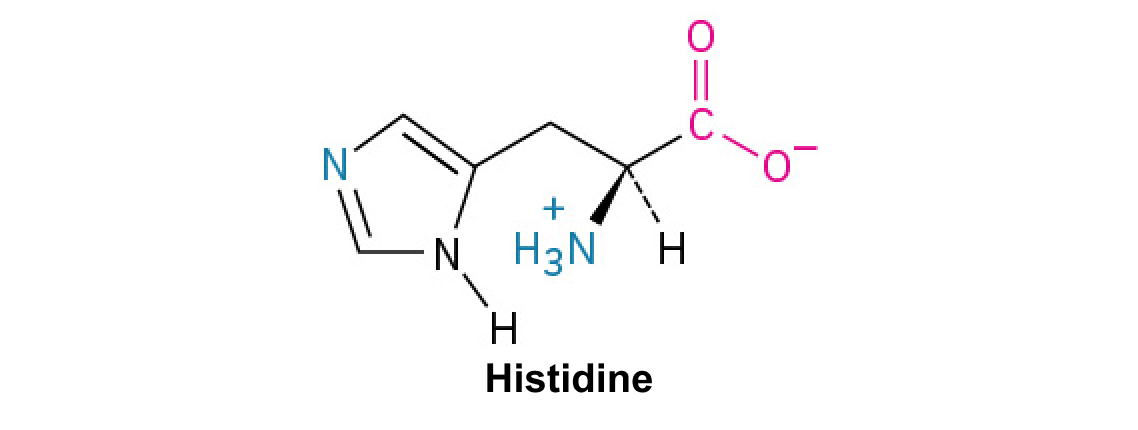
A nitrogen-containing . A free ’s amino group is typically (NH₃⁺) near physiological ; ’s ring nitrogen is an exception to this formula.

Read explanation · OpenStax ↗
Amphipathic

Having both a region and a region, as in a or .

Read explanation · OpenStax ↗
Analytical standard ·

A material with a known identity or amount used to compare or calibrate measurements.

Read explanation · Agilent ↗
Antiparallel

Running in opposite directions, as with two strands or neighboring strands in some .

Read explanation · OpenStax ↗
Aqueous solution ·

A in which water is the .

Read explanation · OpenStax ↗
Aromatic

Containing a cyclic, with . , , and have aromatic .

Read explanation · OpenStax ↗
Atom

The smallest unit of an element that retains its chemical identity; it has a surrounded by .

Read explanation · OpenStax ↗
attitude

Evaluation of an object, person, issue, or behavior.

Read explanation · OpenStax ↗
Benzene ring

A six-carbon ring with .

Read explanation · OpenStax ↗
Benzyl group

A attached through a –CH₂– group; part of ’s .

Read explanation · OpenStax ↗
Beta sheet · · · · · ·

A made of aligned segments connected by ; strands may be parallel or .

Read explanation · OpenStax ↗
Biomolecule

A made by or involved in living systems, including , , , and .

Read explanation · OpenStax ↗
Blotting ·

Transfer of separated or to a so a specific target can be detected.

Read explanation · Thermo Fisher ↗
Brønsted–Lowry base · · · · · · · · · · ·

In the Brønsted–Lowry model, a substance that can accept a . Basic solutions have lower activity than water.

Read explanation · OpenStax ↗
Calibration

Establishing the relation between a measured signal and known values or .

Read explanation · Agilent ↗
Cancer

A group of diseases involving abnormal cells that can proliferate without normal restraints and invade tissues.

Read explanation · OpenStax ↗
Carbohydrate

A class of including sugars and their , used for energy storage, structure, and recognition.

Read explanation · OpenStax ↗
Carbonyl group · ·

A carbon double-bonded to oxygen, C=O; present in and many other .

Read explanation · OpenStax ↗
Carboxyl group · ·

An , COOH. In free it is usually to COO⁻ near physiological .

Read explanation · OpenStax ↗
Catalyst · ·

A substance that speeds a by providing a pathway with lower and is regenerated rather than consumed overall.

Read explanation · OpenStax ↗
Chemical element

A substance defined by having the same number of , such as carbon or oxygen.

Read explanation · OpenStax ↗
Chemical reaction ·

A process that rearranges and chemical bonds, converting into .

Read explanation · OpenStax ↗
Chromatin

The complex of and associated , including , in .

Read explanation · OpenStax ↗
Chromosome ·

An organized with associated that carries . A replicated chromosome has two .

Read explanation · OpenStax ↗
class consciousness

Recognition of shared class position and interests in Marxist theory.

Read explanation · OpenStax ↗
Codon

A sequence of three that specifies an or a stop signal.

Read explanation · OpenStax ↗
competence

A cell’s capacity to take up extracellular in transformation.

Read explanation · OpenStax ↗
Concentration

The amount of a substance in a specified volume or mass of mixture.

Read explanation · OpenStax ↗
conflict theory

Perspective emphasizing inequality, competition, and over resources.

Read explanation · OpenStax ↗
Conjugated system ·

Adjacent orbitals that allow to be distributed across several , often through alternating single and multiple bonds.

Read explanation · OpenStax ↗
Copy number ·

The number of copies of a segment in a defined sample or ; it is distinct from or abundance.

Read explanation · NHGRI / NIH ↗
Covalent bond · ·

A bond in which share pairs. and are covalent.

Read explanation · OpenStax ↗
cultural capital

Valued knowledge, credentials, styles, and familiarity that facilitate institutional advantage.

Read explanation · OpenStax ↗
culture

Learned and shared meanings, practices, values, and artifacts.

Read explanation · OpenStax ↗
Cysteine ·

An with a . Two cysteines can form a .

Read explanation · OpenStax ↗
deindustrialization

Decline of industrial employment or production in a region.

Read explanation · OpenStax ↗
Deoxyribonucleic acid

The that stores genetic information used to specify and sequences.

Read explanation · OpenStax ↗
Deprotonation

Removal of a from a or group; this changes its by minus one.

Read explanation · OpenStax ↗
Detergent

An substance that can associate with both water and material; detergents can disrupt or interactions.

Read explanation · Thermo Fisher ↗
Diagnostic and Statistical Manual of Mental Disorders

Diagnostic classification manual describing patterns and criteria for mental disorders.

Read explanation · OpenStax ↗
Diploid

Having two sets; comparisons of must account for and sample composition.

Read explanation · NHGRI / NIH ↗
discrimination

Unequal treatment linked to social category or group membership.

Read explanation · OpenStax ↗
Disulfide bond · · ·

A covalent sulfur–sulfur bond formed by of two , which can stabilize structure.

Read explanation · NCBI Bookshelf ↗
DNA replication

Copying so genetic information can be passed to daughter cells. Each guides a complementary new strand.

Read explanation · OpenStax ↗
dominant

Describing an whose specified is expressed in a ; dominance does not imply greater frequency or .

Read explanation · OpenStax ↗
Electric charge · · ·

An electrical property that can be positive or negative. Opposite charges attract and like charges repel; net charge is the sum of all charges on a particle.

Read explanation · OpenStax ↗
Electron

A negatively subatomic particle. Electron sharing and transfer determine much of chemical bonding.

Read explanation · OpenStax ↗
Electron delocalization ·

Distribution of across several rather than confinement to one or bond.

Read explanation · OpenStax ↗
Electronegativity ·

An ’s tendency to attract shared in a chemical bond. Unequal attraction can make a bond .

Read explanation · OpenStax ↗
ethnicity

Shared cultural history, ancestry, language, or affiliation.

Read explanation · OpenStax ↗
Eukaryote ·

An organism whose cells have a -enclosed ; animals, plants, fungi, and protists are eukaryotes.

Read explanation · OpenStax ↗
FACT complex ·

A -associated complex that helps machinery traverse and supports reorganization.

Read explanation · OpenStax ↗
false consciousness

Beliefs interpreted in Marxist theory as obscuring underlying class interests or relations.

Read explanation · OpenStax ↗
fitness

Relative reproductive contribution of a or organism in a particular environment.

Read explanation · OpenStax ↗
Fraction · ·

A portion of a sample collected during a separation, such as the fluid leaving a column during a time interval.

Read explanation · Waters ↗
Functional group

A group of whose chemical behavior gives a characteristic and properties.

Read explanation · OpenStax ↗
functionalism

Perspective examining how social institutions contribute to stability and functioning.

Read explanation · OpenStax ↗
gender identity

A person’s internal sense of their gender.

Read explanation · OpenStax ↗
Gene

A sequence that contributes to a functional or , together with the information needed to express it.

Read explanation · OpenStax ↗
Gene expression

Production of a functional from a , including and, for -coding , .

Read explanation · NCBI Bookshelf ↗
Genome

The complete genetic material of an organism or cell.

Read explanation · OpenStax ↗
genotype

The allelic composition of an organism at one or more specified .

Read explanation · OpenStax ↗
Gradient

A change in a quantity, such as , , or density, across a distance or over time.

Read explanation · Thermo Fisher ↗
heterozygote ·

An individual with two different at a specified .

Read explanation · OpenStax ↗
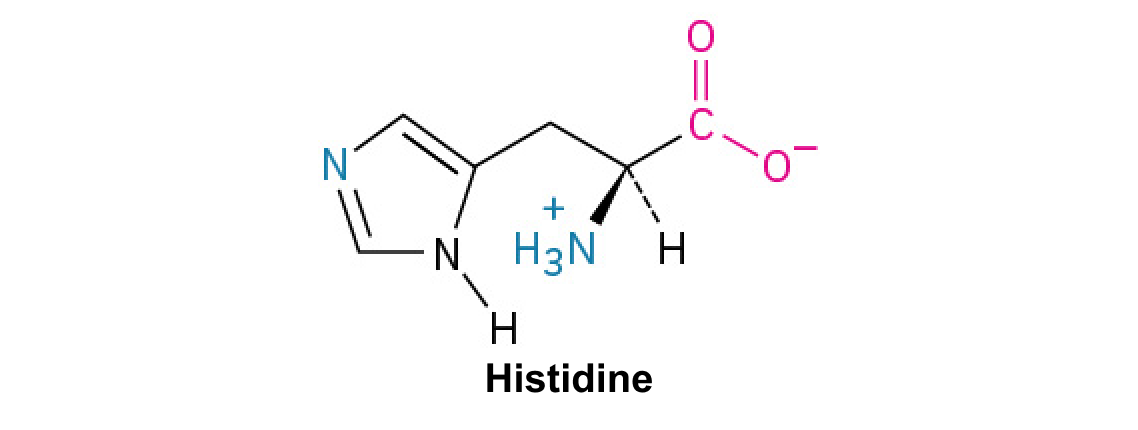
Histidine ·

A with an . Mostly uncharged near physiological , it can accept or donate .

Read explanation · OpenStax ↗
Histone

A -associated rich in . Core histones form the around which nucleosomal wraps.

Read explanation · OpenStax ↗
Hydrogen bond ·

An attraction between a hydrogen bonded to an and another . hydrogen bonds stabilize .

Read explanation · OpenStax ↗
Hydrogen ion · ·

A positively hydrogen species. H⁺ denotes a , which is hydrated in water; its activity determines .

Read explanation · OpenStax ↗
Hydrolysis

Breaking a chemical bond by adding water. hydrolysis separates .

Read explanation · OpenStax ↗
Hydrophilic

Interacting favorably with water, typically because a group is or .

Read explanation · OpenStax ↗
Hydrophobic

Interacting poorly with water. often gather in a ’s interior.

Read explanation · OpenStax ↗
Hydroxide ion ·

The negatively OH⁻. Basic contain a higher hydroxide ion activity than water at the same temperature.

Read explanation · OpenStax ↗
Hydroxyl group ·

An oxygen bonded to hydrogen, –OH. Hydroxyl groups can and often increase .

Read explanation · OpenStax ↗
Imidazole

A five-membered ring containing two nitrogens; ’s contains this ring.

Read explanation · OpenStax ↗
incentive

External outcome or cue that attracts or discourages behavior.

Read explanation · OpenStax ↗
incidence

Occurrence of new cases in a defined population over a specified period.

Read explanation · OpenStax ↗
Indole

A fused six-membered and five-membered ring system containing nitrogen; found in .

Read explanation · OpenStax ↗
intergenerational mobility

Change in social position between parents and children.

Read explanation · OpenStax ↗
intersectionality

Framework examining how interacting social positions and systems of shape experience.

Read explanation · OpenStax ↗
intragenerational mobility

Change in social position during one person’s lifetime.

Read explanation · OpenStax ↗
Ion · ·

An or with a net because its numbers of and do not balance.

Read explanation · OpenStax ↗
linkage

A tendency of nearby on the same to be inherited together.

Read explanation · OpenStax ↗
Lipid

A broad class of largely or , including fats, , and steroids.

Read explanation · OpenStax ↗
locus

The specific position of a or other feature.

Read explanation · OpenStax ↗
Logarithm · · ·

The exponent needed to obtain a number from a chosen fixed number. For decimal logarithms, log₁₀(100) = 2 because 10² = 100; uses the negative decimal logarithm of activity.

Read explanation · OpenStax ↗
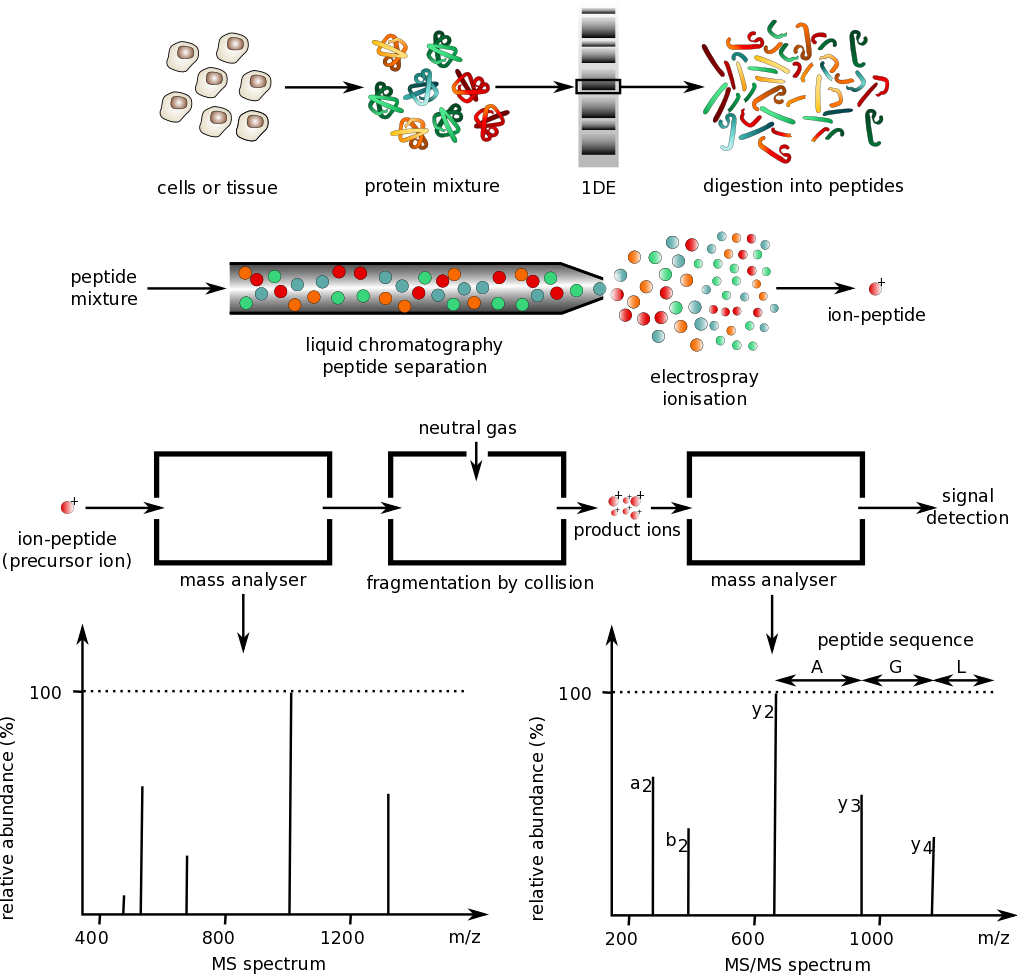
Mass spectrometry ·

Analysis of according to their mass-to- ratios, used to identify and or .

Read explanation · Thermo Fisher ↗
Mass-to-charge ratio

The mass of an divided by its number; this is the quantity measured by a .

Read explanation · Thermo Fisher ↗
master status

Status that strongly dominates others’ interpretations of a person.

Read explanation · OpenStax ↗
medicalization

Process of defining and managing a condition or behavior as a medical problem.

Read explanation · OpenStax ↗
Membrane · · · ·

A thin boundary or sheet. Cell membranes are bilayers containing ; membranes are synthetic supports that hold or for detection.

Read explanation · OpenStax ↗
meritocracy

Ideal in which rewards and positions are allocated by talent and effort.

Read explanation · OpenStax ↗
Messenger RNA ·

An that carries coding information used by to synthesize a .

Read explanation · OpenStax ↗
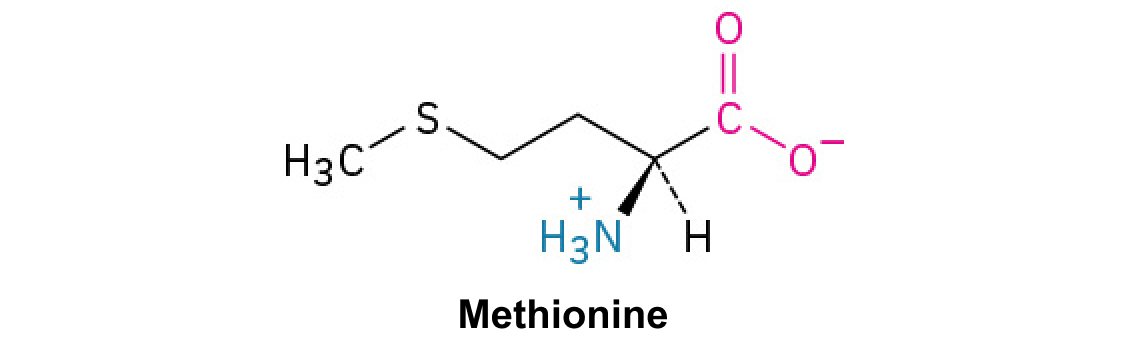
Methionine ·

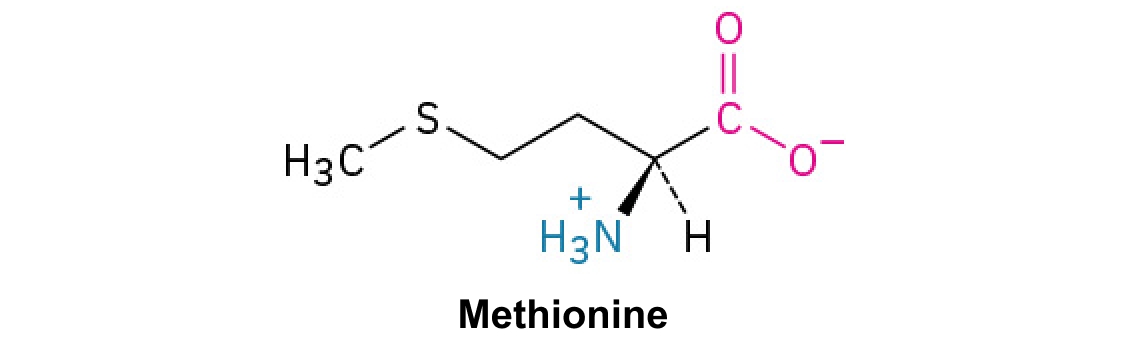
A with sulfur in a . Unlike , it does not form .

Read explanation · OpenStax ↗
Molecular chaperone · ·

A that assists other in folding or prevents , without specifying their sequence.

Read explanation · NCBI Bookshelf ↗
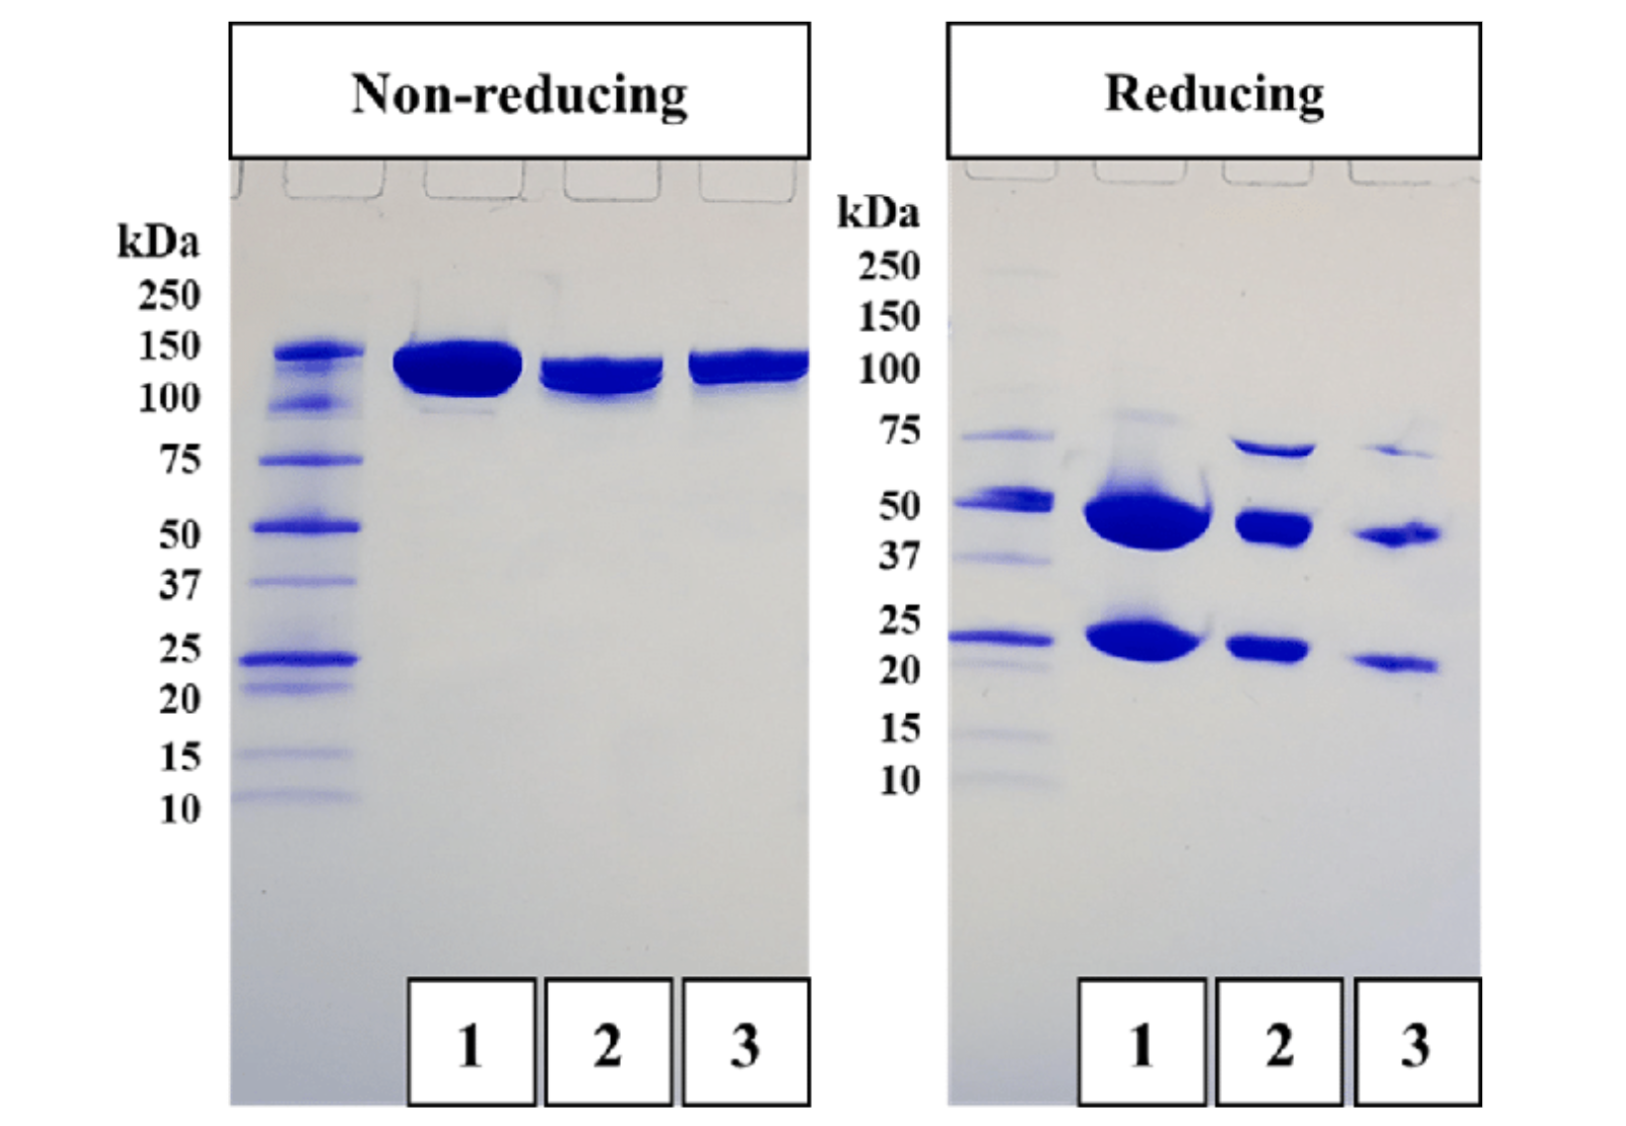
Molecular mass ladder ·

A mixture of of known masses, run beside samples to estimate their apparent sizes.

Read explanation · Thermo Fisher ↗
Molecule

Two or more joined by . A molecule may be electrically or carry a .

Read explanation · OpenStax ↗
mores

Norm with strong moral significance.

Read explanation · OpenStax ↗
Neutral

Having no net . For a , neutral instead means equal and activities; its is about 7 at 25 °C.

Read explanation · OpenStax ↗
Nitrogenous base · · ·

A nitrogen-containing ring component of ; its pairing interactions help specify sequences.

Read explanation · OpenStax ↗
Nonpolar ·

Lacking a substantial separation of . Nonpolar groups generally interact poorly with water.

Read explanation · OpenStax ↗
Nucleic acid

A of , such as or , used in information storage, expression, and other cellular functions.

Read explanation · OpenStax ↗
Nucleosome

The basic unit of : wrapped around a .

Read explanation · OpenStax ↗
Nucleotide

A joined to a sugar and one or more .

Read explanation · OpenStax ↗
Nucleus ·

A -enclosed compartment containing most of a cell’s .

Read explanation · OpenStax ↗
Octamer

A complex made of eight . A core contains eight .

Read explanation · OpenStax ↗
Oxidation ·

Loss of or an increase in oxidation state. Oxidizing two can form a .

Read explanation · OpenStax ↗
Peptide

A chain of joined by ; the term commonly describes chains shorter than a typical .

Read explanation · OpenStax ↗
Peptide bond ·

A covalent between the carboxyl carbon of one and the amino nitrogen of the next.

Read explanation · OpenStax ↗
personality disorder

Enduring maladaptive pattern of experience and behavior associated with impairment or distress.

Read explanation · OpenStax ↗
pH

A measure of , defined as the negative of activity. Lower pH means greater ; pH influences .

Read explanation · OpenStax ↗
phenotype

A measurable trait produced by interacting with development and environment.

Read explanation · OpenStax ↗
Phenylalanine ·

A with an .

Read explanation · OpenStax ↗
Phosphate group ·

A phosphorus-containing group bonded to oxygens; phosphate groups occur in , , and modified .

Read explanation · OpenStax ↗
Phospholipid

An with a -containing region and tails; a major component of cellular .

Read explanation · OpenStax ↗
photon

Quantum of electromagnetic radiation with energy hf.

Read explanation · OpenStax ↗
ploidy

The number of complete sets in a cell.

Read explanation · OpenStax ↗
Polar

Having an uneven distribution of . Polar groups often interact favorably with water.

Read explanation · OpenStax ↗
Polymer

A large made from many linked molecular building blocks.

Read explanation · OpenStax ↗
Polypeptide

A chain of connected by . A functional can contain one or several such chains.

Read explanation · OpenStax ↗
posttraumatic stress disorder

Trauma-related condition involving intrusion, avoidance, negative cognition or mood, and arousal changes.

Read explanation · OpenStax ↗
prejudice

Evaluative toward people based on perceived group membership.

Read explanation · OpenStax ↗
prestige

Social esteem or respect associated with a person or position.

Read explanation · OpenStax ↗
privilege

Advantage attached to social position that may be taken for granted by its holders.

Read explanation · OpenStax ↗
Proline ·

An whose loops back to the nitrogen, restricting rotation and often creating bends.

Read explanation · OpenStax ↗
Protein

One or more folded chains that perform biological roles such as , transport, signaling, or structural support.

Read explanation · OpenStax ↗
Protein aggregation · ·

Association of into larger clusters, often when exposed surfaces of unfolded stick together.

Read explanation · NCBI Bookshelf ↗
Protein backbone ·

The repeating nitrogen–alpha-carbon– chain of a , excluding its variable .

Read explanation · OpenStax ↗
Proton

A positively subatomic particle. In – chemistry, donating a proton means transferring a .

Read explanation · OpenStax ↗
Protonation

Addition of a to an , , or ; this changes its by plus one.

Read explanation · OpenStax ↗
quality of care

Degree to which services are safe, effective, timely, and responsive to appropriate needs.

Read explanation · OpenStax ↗
Quantification · ·

Estimating the amount or of a substance from measured signals and suitable or .

Read explanation · Waters ↗
R group · ·

The variable side chain attached to an ’s . It determines identity, , , and chemical behavior.

Read explanation · OpenStax ↗
Reactant

A starting substance transformed during a .

Read explanation · OpenStax ↗
Reaction intermediate · ·

A species formed in one step and consumed in another. It occupies a local energy minimum between .

Read explanation · OpenStax ↗
Reaction product ·

A substance formed by a .

Read explanation · OpenStax ↗
Reduction

Gain of or a decrease in state. Reducing a restores two .

Read explanation · OpenStax ↗
relative poverty

Resources substantially below the prevailing standard in a society.

Read explanation · OpenStax ↗
Ribonucleic acid ·

A with roles in , regulation, and ; carries -coding information.

Read explanation · OpenStax ↗
Ribosome ·

A complex of and that translates into a .

Read explanation · OpenStax ↗
Secondary structure

Local folding, such as and , stabilized mainly by .

Read explanation · OpenStax ↗
sexual orientation

Pattern of sexual or romantic attraction and associated identity.

Read explanation · OpenStax ↗
shaping

Reinforcing successive approximations toward a target behavior.

Read explanation · OpenStax ↗
Sister chromatid

One of the two copies of a produced by . An intact sister chromatid can supply a template for accurate repair.

Read explanation · Biology LibreTexts / Oregon State University ↗
social capital

Resources available through social relationships and networks.

Read explanation · OpenStax ↗
social epidemiology

Study of how social conditions shape the distribution and determinants of health.

Read explanation · OpenStax ↗
social power

Capacity to influence outcomes or act despite resistance.

Read explanation · OpenStax ↗
social reproduction

Processes sustaining social advantage or disadvantage across generations.

Read explanation · OpenStax ↗
social stratification

Structured inequality in resources, opportunities, and social position.

Read explanation · OpenStax ↗
social support

Emotional, informational, or practical assistance available through relationships.

Read explanation · OpenStax ↗
socialization

Lifelong learning and negotiation of social norms, roles, skills, and identities.

Read explanation · OpenStax ↗
socioeconomic gradient

Systematic variation in outcomes across levels of socioeconomic position.

Read explanation · OpenStax ↗
socioeconomic status

Social and economic position commonly measured through income, education, and occupation.

Read explanation · OpenStax ↗
Solubility ·

The amount of a substance that can dissolve in a under specified conditions. Soluble means able to dissolve; insoluble means only very slightly soluble in that .

Read explanation · OpenStax ↗
Solute

A dissolved component of a .

Read explanation · OpenStax ↗
Solution

A homogeneous mixture in which are dissolved in a .

Read explanation · OpenStax ↗
Solvent

The component of a that dissolves other substances, usually the component present in the greatest amount.

Read explanation · OpenStax ↗
Spectrum ·

A distribution of measured signal over a variable such as or .

Read explanation · Thermo Fisher ↗
stereotype

Generalized belief about characteristics of members of a group.

Read explanation · OpenStax ↗
stigma

Socially discrediting meaning attached to an attribute or identity.

Read explanation · OpenStax ↗
structural mobility

Mobility produced by changes in the distribution of positions or opportunities.

Read explanation · OpenStax ↗
Subunit ·

An individual chain within a containing multiple chains.

Read explanation · OpenStax ↗
symbolic interactionism

Perspective examining meaning created and negotiated through interaction.

Read explanation · OpenStax ↗
Template strand · · ·

A preexisting strand whose sequence guides complementary nucleic- synthesis.

Read explanation · OpenStax ↗
Thioether

A sulfur bonded to two carbon groups, as in ’s . It has no hydrogen.

Read explanation · OpenStax ↗
Thiol group · · · ·

A sulfur bonded to hydrogen, –SH. thiols can form through .

Read explanation · OpenStax ↗
tracking

Placement of students into differentiated educational pathways or ability groups.

Read explanation · OpenStax ↗
Transcription

Synthesis of using a template.

Read explanation · OpenStax ↗
Transition state

A fleeting, high-energy arrangement at a barrier. It is an energy maximum along the path, rather than a stable .

Read explanation · OpenStax ↗
Translation ·

Synthesis of a on a using the sequence of in .

Read explanation · OpenStax ↗
Tryptophan ·

An with a bulky ; commonly grouped as .

Read explanation · OpenStax ↗
Tyrosine ·

An with a phenolic . Usually uncharged near physiological .

Read explanation · OpenStax ↗
Wavelength

The distance between repeating points of a wave, such as neighboring crests; light wavelength determines energy.

Read explanation · JASCO ↗
wealth

Stock of assets minus liabilities at a point in time.

Read explanation · OpenStax ↗
withdrawal

Symptoms emerging when exposure to an adapted-to substance is reduced or stopped.

Read explanation · OpenStax ↗

9.1 What Is Social Stratification?

OpenStax · 9.1 What Is Social Stratification? ↗
Instructional page including learning objectives, examples, figures, source tables and questions. Site navigation and embedded media players are omitted; source media links remain available.

Learning Objectives

By the end of this section, you should be able to:

  • Differentiate between open and closed stratification systems
  • Distinguish between caste and class systems
  • Explain why is considered an ideal system of stratification
A man and a woman, both wearing business suits, are shown from behind at the top of an escalator
Figure 9.2 — 9.1 What Is ?

Figure 9.2 In the upper echelons of the working world, people with the most power reach the top. These people make the decisions and earn the most money. The majority of Americans will never see the view from the top. (Credit: Alex Proimos/flickr)

Tonja R. Conerly, Kathleen Holmes, and Asha Lal Tamang, Introduction Sociology 3E, OpenStax. · CC BY-NC-SA 4.0 · Original image ↗ · Access for free ↗

Sociologists use the term to describe the system of social standing. refers to a society’s categorization of its people into rankings based on factors like , income, education, family background, and .

Geologists also use the word “stratification” to describe the distinct vertical layers found in rock. Typically, society’s layers, made of people, represent the uneven distribution of society’s resources. Society views the people with more resources as the top layer of the social structure of stratification. Other groups of people, with fewer and fewer resources, represent the lower layers. An individual’s place within this stratification is called ().

A rock formation showing various layers is shown.
Figure 9.3 — 9.1 What Is ?

Figure 9.3 Strata in rock illustrate social stratification. People are sorted, or layered, into social categories. Many factors determine a person’s social standing, such as wealth, income, education, family background, and power. (Credit: Just a Prairie Boy/flickr)

Tonja R. Conerly, Kathleen Holmes, and Asha Lal Tamang, Introduction Sociology 3E, OpenStax. · CC BY-NC-SA 4.0 · Original image ↗ · Access for free ↗

Most people and institutions in the United States indicate that they value equality, a belief that everyone has an equal chance at success. In other words, hard work and talent—not inherited , prejudicial treatment, institutional racism, or societal values—determine social mobility. This emphasis on choice, motivation, and self-effort perpetuates the American belief that people control their own social standing.

However, sociologists recognize as a society-wide system that makes inequalities apparent. While inequalities exist between individuals, sociologists are interested in larger social patterns. Sociologists look to see if individuals with similar backgrounds, group memberships, identities, and location in the country share the same . No individual, rich or poor, can be blamed for social inequalities, but instead all participate in a system where some rise and others fall. Most Americans believe the rising and falling is based on individual choices. But sociologists see how the structure of society affects a person's social standing and therefore is created and supported by society.

One side of a block of rowhouses and cars covered in snow is shown.
Figure 9.4 — 9.1 What Is ?

Figure 9.4 The people who live in these houses most likely share similar levels of income and education. Neighborhoods often house people of the same social standing. Wealthy families do not typically live next door to poorer families, though this varies depending on the particular city and country. (Credit: Orin Zebest/flickr)

Tonja R. Conerly, Kathleen Holmes, and Asha Lal Tamang, Introduction Sociology 3E, OpenStax. · CC BY-NC-SA 4.0 · Original image ↗ · Access for free ↗

Factors that define stratification vary in different societies. In most societies, stratification is an economic system, based on , the net value of money and assets a person has, and income, a person’s wages or investment dividends. While people are regularly categorized based on how rich or poor they are, other important factors influence social standing. For example, in some cultures, is valued, and people who have them are revered more than those who don’t. In some cultures, the elderly are esteemed, while in others, the elderly are disparaged or overlooked. Societies’ cultural beliefs often reinforce stratification.

One key determinant of social standing is our parents. Parents tend to pass their social position on to their children. People inherit not only social standing but also the cultural norms, values, and beliefs that accompany a certain lifestyle. They share these with a network of friends and family members that provide resources and support. This is one of the reasons first-generation college students do not fare as well as other students. They lack access to the resources and support commonly provided to those whose parents have gone to college.

Other determinants are found in a society’s occupational structure. Teachers, for example, often have high levels of education but receive relatively low pay. Many believe that teaching is a noble profession, so teachers should do their jobs for love of their profession and the good of their students—not for money. Yet, the same is not applied to professional athletes, executives, or those working in corporate world. Cultural attitudes and beliefs like these support and perpetuate social and economic inequalities.

Systems of Stratification

Sociologists distinguish between two types of systems of stratification. Closed systems accommodate little change in social position. They do not allow people to shift levels and do not permit social relationships between levels. Closed systems include estate, slavery, and caste systems. Open systems are based on achievement and allow for movement and interaction between layers and classes. How different systems operate reflect, emphasize, and foster specific cultural values, individual beliefs. In this section, we’ll review class and caste stratification systems, plus discuss the ideal system of .

The Caste System

A woman in India is shown from behind walking down the street.
Figure 9.5 — 9.1 What Is ?

Figure 9.5 India used to have a rigid caste system. The people in the lowest caste suffered from extreme poverty and were shunned by society. Some aspects of India’s defunct caste system remain socially relevant. (Credit: Elessar/flickr)

Tonja R. Conerly, Kathleen Holmes, and Asha Lal Tamang, Introduction Sociology 3E, OpenStax. · CC BY-NC-SA 4.0 · Original image ↗ · Access for free ↗

Caste systems are closed stratification systems where people can do little or nothing to change the social standing of their birth. The caste system determines all aspects of an individual’s life: occupations, marriage partners, and housing. Individual talents, interests, or potential do not provide opportunities to improve a person's social position.

In the Hindu caste tradition, people expect to work in an occupation and to enter into a marriage based on their caste. Accepting this social standing is considered a moral duty and people are socialized to accept their social standing. Cultural values reinforced the system. Caste systems promote beliefs in fate, destiny, and the will of a higher , rather than promoting individual freedom as a value. This belief system is an ideology. Every has an ideology that supports its system of stratification.

The caste system in India has been officially dismantled, but is still deeply embedded in Indian society, particularly in rural areas. In India’s larger cities, people now have more opportunities to choose their own career paths and marriage partners. As a global center of employment, corporations have introduced merit-based hiring and employment to the nation shifting the cultural expectations of the caste system.

The Class System

A class system is based on both social factors and individual achievement. A class consists of a set of people who share similar status based on factors like , income, education, family background, and occupation. Unlike caste systems, class systems are open. People may move to a different level (vertical movement) of education or employment status than their parents. Though family and other societal models help guide a person toward a career, personal choice and opportunity play a role.

They can also socialize with and marry members of other classes. People have the option to form an exogamous marriage, a union of spouses from different social categories. Exogamous marriages often focus on values such as love and compatibility. Though social conformities still exist that encourage people to choose partners within their own class, called an endogamous marriage, people are not as pressured to choose marriage partners based solely on their social location.

is a hypothetical system in which is determined by personal effort and merit. The concept of is an ideal because no society has ever existed where social standing was based entirely on merit. Rather, multiple factors influence social standing, including processes like and the realities of inequality within economic systems. While a has never existed, sociologists see aspects of meritocracies in modern societies when they study the role of academic and job performance and the systems in place for evaluating and rewarding achievement in these areas.

The differences between an open and closed system are explored further in the example below.

Status Consistency

Sociologists use the term status consistency to describe the consistency, or lack thereof, of an individual’s rank across the factors that determine within a lifetime. Caste systems correlate with high status consistency, due to the inability to move out of a class, whereas the more flexible class system demonstrates lower status consistency.

To illustrate, let’s consider Serena. Serena earned her high school diploma but did not go to college. Completing high school but not college is a trait more common to the lower-middle class. After high school, she began landscaping, which, as manual labor, tracks with lower-middle class or even lower class. However, over time, Serena started her own company. She hired employees. She won larger contracts. Serena became a business owner and earned more money. Those traits represent the upper-middle class. Inconsistencies between Serena’s educational level, her occupation, and income show Serena’s flexibility in her social status, giving her low status consistency. In a class system, hard work, new opportunities, coupled with a lower education status still allow a person movement into middle or upper class, whereas in a caste system, that would not be possible. In a class system, low status consistency correlates with having more choices and opportunities.

Social Policy and Debate

LEAVING ROYALTY BEHIND

Meghan Markle and Prince Harry stand next to each other with Catherine, Duchess of Cambridge. People take pictures of them.
Figure 9.6 — 9.1 What Is ?

Figure 9.6 Prince Harry and Meghan Markle with other members of the Royal family, in 2017. One year later, the couple would wed and the American-born actress and fashion-designer would immediately become Her Royal Highness The Duchess of Sussex, a position and title that bestows significant benefits of social class (Credit: Mark Jones/Wikimedia Commons)

Tonja R. Conerly, Kathleen Holmes, and Asha Lal Tamang, Introduction Sociology 3E, OpenStax. · CC BY-NC-SA 4.0 · Original image ↗ · Access for free ↗

Meghan Markle, who married a member of the British royal family, for years endured unceasing negative media attention, invasion of privacy, and racially abusive comments. She and her husband–Prince Harry, grandson to Queen Elizabeth–undertook a series of legal actions to push back against overly aggressive media outlets. But because of the continued harassment and disagreements with others in the royal family, Meghan and Harry decided to step down from their royal obligations and begin a disassociation from the British monarchy. In doing so, they gave up honorary positions, titles, and financial support. For Meghan, who had been born in the U.S. and had earned her through a successful career, these changes may not be so jarring. Prince Harry, however, had been " Royal Highness" since he was born; by nature of ancestry he was entitled to vast sums of money, property, and cultural-political positions such as Honorary Air Commandant, Commodore-in-Chief, and President of the Queen's Commonwealth Trust. Harry would also lose the military rank he had earned through almost ten years of military service, including two combat deployments to Afghanistan. Would Megxit work for him? What gave him those honors in the first place?

Britain’s monarchy arose during the Middle Ages. Its social hierarchy placed royalty at the top and commoners on the bottom. This was generally a closed system, with people born into positions of nobility. was passed from generation to generation through primogeniture, a law stating that all property would be inherited by the firstborn son. If the family had no son, the land went to the next closest male relation. Women could not inherit property, and their social standing was primarily determined through marriage.

The arrival of the Industrial Revolution changed Britain’s social structure. Commoners moved to cities, got jobs, and made better livings. Gradually, people found new opportunities to increase their and . Today, the government is a constitutional monarchy with the prime minister and other ministers elected to their positions, and with the royal family’s role being largely ceremonial. The long-ago differences between nobility and commoners have blurred, and the modern class system in Britain is similar to that of the United States (McKee 1996).

Today, the royal family still commands , , and a great deal of attention. After the death of Queen Elizabeth II in September 2022, Prince Charles ascended the throne. When he retires or passes away, the position will go to Prince William, Prince Harry's older brother.

Prince Harry and Meghan Markle moved to California and have embarked on nonprofit as well as media ventures. While living in the United States and working to some extent in entertainment, they will likely be considered a different type of royalty.

9.2 Social Stratification and Mobility in the United States

OpenStax · 9.2 Social Stratification and Mobility in the United States ↗
Instructional page including learning objectives, examples, figures, source tables and questions. Site navigation and embedded media players are omitted; source media links remain available.

Learning Objectives

By the end of this section, you should be able to:

  • Describe the U.S. class structure
  • Describe several types of social mobility
  • Recognize characteristics that define and identify class

How does affect your ability to move up or down the social classes? What is a standard of living? What factors matter in rising up or becoming more successful in the eyes of those around you? Does being in a social class dictate your style, behavior, or opportunities?

Social Classes in the United States

Two people with extremely spiked hair stand at a table in what looks like a studio.
Figure 9.7 — 9.2 and Mobility in the United States

Figure 9.7 Does taste or fashion sense indicate class? Is there any way to tell if these people come from an upper-, middle-, or lower-class background? (Credit: Kelly Bailey/flickr)

Tonja R. Conerly, Kathleen Holmes, and Asha Lal Tamang, Introduction Sociology 3E, OpenStax. · CC BY-NC-SA 4.0 · Original image ↗ · Access for free ↗

For sociologists, categorizing social class is a fluid science. Sociologists generally identify three levels of class in the United States: upper, middle, and lower class. Within each class, there are many subcategories. is the most significant way of distinguishing classes, because can be transferred to one’s children and perpetuate the class structure. One economist, J.D. Foster, defines the 20 percent of U.S. citizens’ highest earners as “upper income,” and the lower 20 percent as “lower income.” The remaining 60 percent of the population make up the middle class (Mason 2010). With that distinction, economists can describe the range in annual household incomes for the middle-class, but they cannot show how the range of all incomes vary and how they change over time. For this reason, the Pew Center defines classes based on the median household income. The lower class includes those whose income is two-thirds of the national median, the middle class includes those whose income falls between two-thirds and twice the median, and the upper class includes those whose income is above twice the national median (Kochhar 2015). Though median income levels vary from state to state, at the national level you would be considered in the middle-class if you earned between $48,500 to $145,500 in 2018 U.S. dollars (Bennett 2000).

One sociological perspective distinguishes the classes, in part, according to their relative and control over their lives. Members of the upper class not only have and control over their own lives, but their social status gives them and control over others’ lives. The middle class doesn’t generally control other strata of society, but its members do exert control over their own lives. In contrast, the lower class has little control over their work or lives. Below, we will explore the major divisions of U.S. social class and their key subcategories.

Upper Class

A luxurious house and grounds.
Figure 9.8 — 9.2 and Mobility in the United States

Figure 9.8 Members of the upper class can afford to live, work, and play in exclusive places, such as country clubs and gated communities, designed for luxury, safety, and comfort. (Credit: PrimeImageMedia.com/flickr)

Tonja R. Conerly, Kathleen Holmes, and Asha Lal Tamang, Introduction Sociology 3E, OpenStax. · CC BY-NC-SA 4.0 · Original image ↗ · Access for free ↗

The upper class is considered the top, and only the powerful elite get to see the view from there. In the United States, people with extreme make up one percent of the population, and they own roughly one-third of the country’s (Beeghley 2008).

Money provides not just access to material goods, but also access to a lot of . As corporate leaders, members of the upper class make decisions that affect the job status of millions of people. As media owners, they influence the collective identity of the nation. They run the major network television stations, radio broadcasts, newspapers, magazines, publishing houses, and sports franchises. As board members of the most influential colleges and universities, they influence cultural attitudes and values. As philanthropists, they establish foundations to support social causes they believe in. As campaign contributors and legislation drivers, they fund political campaigns to sway policymakers, sometimes to protect their own economic interests and at other times to support or promote a cause. (The methods, effectiveness, and impact of these political efforts are discussed in the Politics and Government chapter.)

U.S. society has historically distinguished between “old money” (inherited passed from one generation to the next) and “new money” ( you have earned and built yourself). While both types may have equal net worth, they have traditionally held different social standings. People of old money, firmly situated in the upper class for generations, have held high . Their families have socialized them to know the customs, norms, and expectations that come with . Often, the very wealthy don’t work for wages. Some study business or become lawyers in order to manage the family fortune. Others, such as Paris Hilton and Kim Kardashian, capitalize on being a rich socialite and transform that into celebrity status, flaunting a wealthy lifestyle.

However, new-money members of the upper class are not oriented to the customs and of the elite. They haven’t gone to the most exclusive schools. They have not established old-money social ties. People with new money might flaunt their , buying sports cars and mansions, but they might still exhibit behaviors attributed to the middle and lower classes.

The Middle Class

A group of women are shown talking and eating.
Figure 9.9 — 9.2 and Mobility in the United States

Figure 9.9 These members of a club likely consider themselves middle class, as do many Americans. (Credit: United Way Canada-Centraide Canada/flickr)

Tonja R. Conerly, Kathleen Holmes, and Asha Lal Tamang, Introduction Sociology 3E, OpenStax. · CC BY-NC-SA 4.0 · Original image ↗ · Access for free ↗

Many people consider themselves middle class, but there are differing ideas about what that means. People with annual incomes of $150,000 call themselves middle class, as do people who annually earn $30,000. That helps explain why, in the United States, the middle class is broken into upper and lower subcategories.

Lower-middle class members tend to complete a two-year associate’s degrees from community or technical colleges or a four-year bachelor’s degree. Upper-middle class people tend to continue on to postgraduate degrees. They’ve studied subjects such as business, management, law, or medicine.

Middle-class people work hard and live fairly comfortable lives. Upper-middle-class people tend to pursue careers, own their homes, and travel on vacation. Their children receive high-quality education and healthcare (Gilbert 2010). Parents can support more specialized needs and interests of their children, such as more extensive tutoring, arts lessons, and athletic efforts, which can lead to more social mobility for the next generation. Families within the middle class may have access to some , but also must work for an income to maintain this lifestyle.

In the lower middle class, people hold jobs supervised by members of the upper middle class. They fill technical, lower- level management or administrative support positions. Compared to lower-class work, lower-middle-class jobs carry more and come with slightly higher paychecks. With these incomes, people can afford a decent, mainstream lifestyle, but they struggle to maintain it. They generally don’t have enough income to build significant savings. In addition, their grip on class status is more precarious than those in the upper tiers of the class system. When companies need to save money, lower-middle class people are often the ones to lose their jobs.

The Lower Class

A bicycle messenger or delivery person stands with their bike still on a snowy street while a truck drives in front of them.
Figure 9.10 — 9.2 and Mobility in the United States

Figure 9.10 Bike messengers and bike delivery people are often considered members of the working class. They endure difficult and dangerous conditions to do their work, and they are not always well represented by government agencies and in regulations designed for safety or fairness. (Credit: edwardhblake/flickr)

Tonja R. Conerly, Kathleen Holmes, and Asha Lal Tamang, Introduction Sociology 3E, OpenStax. · CC BY-NC-SA 4.0 · Original image ↗ · Access for free ↗

The lower class is also referred to as the working class. Just like the middle and upper classes, the lower class can be divided into subsets: the working class, the working poor, and the underclass. Compared to the lower middle class, people from the lower economic class have less formal education and earn smaller incomes. They work jobs that require less training or experience than middle-class occupations and often do routine tasks under close supervision.

Working-class people, the highest subcategory of the lower class, often land steady jobs. The work is hands-on and often physically demanding, such as landscaping, cooking, cleaning, or building.

Beneath the working class is the working poor. They have unskilled, low-paying employment. However, their jobs rarely offer benefits such as healthcare or retirement planning, and their positions are often seasonal or temporary. They work as migrant farm workers, housecleaners, and day laborers. Education is limited. Some lack a high school diploma.

How can people work full-time and still be poor? Even working full-time, millions of the working poor earn incomes too meager to support a family. The government requires employers pay a minimum wage that varies from state to state, and often leave individuals and families below the poverty line. In addition to low wages, the value of the wage has not kept pace with inflation. “The real value of the federal minimum wage has dropped 17% since 2009 and 31% since 1968 (Cooper, Gould, & Zipperer, 2019). Furthermore, the living wage, the amount necessary to meet minimum , differs across the country because the cost of living differs. Therefore, the amount of income necessary to survive in an area such as New York City differs dramatically from small town in Oklahoma (Glasmeier, 2020).

The underclass is the United States’ lowest tier. The term itself and its classification of people have been questioned, and some prominent sociologists (including a former president of the American Sociological Association), believe its use is either overgeneralizing or incorrect (Gans 1991). But many economists, sociologists government agencies, and advocacy groups recognize the growth of the underclass. Members of the underclass live mainly in inner cities. Many are unemployed or underemployed. Those who do hold jobs typically perform menial tasks for little pay. Some of the underclass are homeless. Many rely on welfare systems to provide food, medical care, and housing assistance, which often does not cover all their basic needs. The underclass have more stress, poorer health, and suffer crises fairly regularly.

Class Traits

Does a person’s appearance indicate class? Can you tell a person’s education level based on their clothing? Do you know a person’s income by the car they drive? Class traits, also called class markers, are the typical behaviors, customs, and norms that define each class. Class traits indicate the level of exposure a person has to a wide range of cultures. Class traits also indicate the amount of resources a person has to spend on items like hobbies, vacations, and leisure activities.

People may associate the upper class with enjoyment of costly, refined, or highly cultivated tastes—expensive clothing, luxury cars, high-end fund-raisers, and frequent or expensive vacations. People may also believe that the middle and lower classes are more likely to enjoy camping, fishing, or hunting, shopping at large retailers, and participating in community activities. While these descriptions may identify class traits, they are stereotypes. Moreover, just as class distinctions have blurred in recent decades, so too have class traits. A factory worker could be a skilled French cook. A billionaire might dress in ripped jeans, and a low-income student might own designer shoes.

For famous wealthy people, making choices that do not seem to align with their economic status can often lead to public commentary. Jennifer Lopez being spotted in a dress that cost less than $30 and Zac Efron shopping at thrift stores have made the news. Others, like Halle Berry and Keanu Reeves, are known for frequent use of public transportation and relatively modest living (at least when considering to their net worth). When questioned, most point to nothing more than practicality. Lady Gaga tweeted " why do people look at me like I'm crazy when i use coupons at grocery or try bargaining at retail..." (2012). And in dense, crowded cities such as Washington, Chicago, and New York, riding the trains is often faster and easier than taking a car.

Social Mobility

People are often inspired and amazed at people's ability to overcome extremely difficult upbringings. Mariano Rivera, acknowledged to be the best relief pitcher in history, made a baseball glove out of cardboard and tape because family could not afford a real one. Alice Coachman grew up with few resources and was denied access to training facilities because of her race; she ran barefoot and built her own high jump equipment before becoming the first Black woman (and one of the first American track and field athletes) to win an Olympic Gold. Pelé, perhaps the most transformative figure in soccer, learned the game while using a rag-stuffed sock for a ball. These are some of the stories told in documentaries or biographies meant to inspire and share the challenges of unequal upbringings. Relative to the overall population, the number of people who rise from poverty to become very successful is small, and the number that become wealthy is even smaller. Systemic barriers like unequal education, , and lack of opportunity can slow or diminish one's ability to move up. Still, people who earn a college degree, get a job promotion, or marry someone with a good income may move up socially.

Social mobility refers to the ability of individuals to change positions within a system. When people improve or diminish their economic status in a way that affects social class, they experience social mobility. Individuals can experience upward or downward social mobility for a variety of reasons. Upward mobility refers to an increase—or upward shift—when they move from a lower to a higher socioeconomical class. In contrast, individuals experience downward mobility when they move from higher socioeconomic class to a lower one. Some people move downward because of business setbacks, unemployment, or illness. Dropping out of school, losing a job, or getting a divorce may result in a loss of income or status and, therefore, downward social mobility.

It is not uncommon for different generations of a family to belong to varying social classes. This is known as . For example, an upper-class executive may have parents who belonged to the middle class. In turn, those parents may have been raised in the lower class. Patterns of can reflect long-term societal changes.

On the other hand, refers to changes in a person's social mobility over the course of their lifetime. For example, the and experienced by one person may be quite different from that of their siblings.

happens when societal changes enable a whole group of people to move up or down the social class . is attributable to changes in society as a whole. In the first half of the twentieth century, industrialization expanded the U.S. economy, raising the standard of living and leading to upward for almost everyone. In the decade and a half of the twenty-first century, recessions and the outsourcing of jobs overseas have contributed to the of Americans from the workforce (BLS 2021). Many people experienced economic setbacks, creating a wave of downward .

When analyzing the trends and movements in social mobility, sociologists consider all modes of mobility. Scholars recognize that mobility is not as common or easy to achieve as many people think.

Stratification of Socioeconomic Classes

In the last century, the United States has seen a steady rise in its standard of living, the level of available to acquire the material necessities and comforts to maintain a specific lifestyle. The country’s standard of living is based on factors such as income, employment, class, literacy rates, mortality rates, poverty rates, and housing affordability. A country with a high standard of living will often reflect a high quality of life, which in the United States means residents can afford a home, own a car, and take vacations. Ultimately, standard of living is shaped by the and distribution of in a country and the expectations its citizens have for their lifestyle.

is not evenly distributed in most countries. In the United States, a small portion of the population has the means to the highest standard of living. The wealthiest one percent of the population holds one-third of our nation’s while the bottom 50 percent of Americans hold only 2 percent. Those in-between, the top 50 to 90 percent hold almost two-thirds of the nation’s (The Federal Reserve, 2021).

Many people think of the United States as a “middle-class society.” They think a few people are rich, a few are poor, and most are fairly well off, existing in the middle of the social strata. Rising from lower classes into the middle-class is to achieve the American Dream. For this reason, scholars are particularly worried by the shrinking of the middle class. Although the middle class is still significantly larger than the lower and upper classes, it shrank from 69 percent in 1971 to 51 percent in 2020. Arguably the most significant threat to the U.S.’s relatively high standard of living is the decline of the middle class. The of the middle class has also been declining in recent decades. Its share of the fell from 32 percent in 1983 to 16 percent in 2016 (Horowitz, Igielnik, & Kochhar 2020).

People with often receive the most and best schooling, access better health care, and consume the most goods and services. In addition, wealthy people also wield decision-making over their daily life because money gives them access to better resources. By contrasts, many lower-income individuals receive less education and inadequate health care and have less influence over the circumstances of their everyday lives.

Additionally, tens of millions of women and men struggle to pay rent, buy food, find work, and afford basic medical care. Women who are single heads of household tend to have a lower income and lower standard of living than their married or single male counterparts. This is a worldwide phenomenon known as the “feminization of poverty”—which acknowledges that women disproportionately make up the majority of individuals in poverty across the globe and have a lower standard of living. In the United States, women make up approximately 56 percent of Americans living in poverty. One reason for this difference is the struggle of single mothers to provide for their children. One in four unmarried mothers lives in poverty (Bleiweis, 2020). The wage gap, discussed extensively in the Work and the Economy chapter, also contributes to the gender-disparity in poverty.

In the United States, poverty is most often referred to as a relative rather than absolute measurement. is an economic condition in which a family or individual cannot afford basic necessities, such as food and shelter, so that day-to-day survival is in jeopardy. is an economic condition in which a family or individuals have 50% less income than the average median income. This income is sometimes called the poverty level or the poverty line. In 2021, for example, the poverty for a single individual was set at $12,880 for one individual, $17,420 for a couple, and $26,500 for a family of four (ASPE 2021).

As a wealthy developed country, the United States invests in resources to provide the basic necessities to those in need through a series of federal and state social welfare programs. These programs provide food, medical, and cash assistance. Temporary Assistance for Needy Families (TANF) provides cash assistance. The goal of TANF is to help families with children achieve economic self-sufficiency. Adults who receive assistance must fall under a specific income level, usually half the poverty level, set by the state. TANF funding goes to childcare, support for parents who are working or training a required number of hours a week, and other services. TANF is time-limited. Most states only provide assistance for a maximum of 5 years (CBPP).

One of the best-known programs is the Supplemental Nutrition Assistance Program (SNAP), administered by the United States Department of Agriculture and formerly known as the Food Stamp Program. This program began in the Great Depression, when unmarketable or surplus food was distributed to the hungry. It was not formalized until 1961, when President John F. Kennedy initiated a food stamp pilot program. successor Lyndon B. Johnson was instrumental in the passage of the Food Stamp Act in 1964. In 1965, more than 500,000 individuals received food assistance. During the height of the pandemic in 2020, participation reached 43 million people.

9.4 Theoretical Perspectives on Social Stratification

OpenStax · 9.4 Theoretical Perspectives on Social Stratification ↗
Instructional page including learning objectives, examples, figures, source tables and questions. Site navigation and embedded media players are omitted; source media links remain available.

Learning Objectives

By the end of this section, you should be able to:

Basketball is one of the highest-paying professional sports and stratification exists even among teams in the NBA. For example, the Toronto Raptors hands out the lowest annual payroll, while the New York Knicks reportedly pays the highest. Stephen Curry, a Golden State Warriors guard, is one of the highest paid athletes in the NBA, earning around $43 million a year (Sports Illustrated 2020), whereas the lowest paid player earns just over $200,000 (ESPN 2021). Even within specific fields, layers are stratified, members are ranked, and inequality exists.

In sociology, even an issue such as NBA salaries can be seen from various points of view. Functionalists will examine the purpose of such high salaries, conflict theorists will study the exorbitant salaries as an unfair distribution of money, and symbolic interactionists will describe how players display that . takes on new meanings when it is examined from different sociological perspectives—, , and .

In sociology, the functionalist perspective examines how society’s parts operate. According to , different aspects of society exist because they serve a vital purpose. What is the function of ?

In 1945, sociologists Kingsley Davis and Wilbert Moore published the Davis-Moore thesis, which argued that the greater the functional importance of a social role, the greater must be the reward. The theory posits that represents the inherently unequal value of different work. Certain tasks in society are more valuable than others (for example, doctors or lawyers). Qualified people who fill those positions are rewarded more than others.

According to Davis and Moore, a firefighter’s job is more important than, for instance, a grocery store cashier’s job. The cashier position does not require similar skill and training level as firefighting. Without the of higher pay, better benefits, and increased respect, why would someone be willing to rush into burning buildings? If pay levels were the same, the firefighter might as well work as a grocery store cashier and avoid the risk of firefighting. Davis and Moore believed that rewarding more important work with higher levels of income, , and encourages people to work harder and longer.

Davis and Moore stated that, in most cases, the degree of skill required for a job determines that job’s importance. They noted that the more skill required for a job, the fewer qualified people there would be to do that job. Certain jobs, such as cleaning hallways or answering phones, do not require much skill. Therefore, most people would be qualified for these positions. Other work, like designing a highway system or delivering a baby, requires immense skill limiting the number of people qualified to take on this type of work.

Many scholars have criticized the Davis-Moore thesis. In 1953, Melvin Tumin argued that it does not explain inequalities in the education system or inequalities due to race or gender. Tumin believed prevented qualified people from attempting to fill roles (Tumin 1953).

A group of people are shown standing on a sidewalk holding protest signs.
Figure 9.13 — 9.4 Theoretical Perspectives on

Figure 9.13 These people are protesting a decision made by Tennessee Technological University in Cookeville, Tennessee, to lay off custodians and outsource the jobs to a private firm to avoid paying employee benefits. Private job agencies often pay lower hourly wages. Is the decision fair? (Credit: Brian Stansberry/Wikimedia Commons)

Tonja R. Conerly, Kathleen Holmes, and Asha Lal Tamang, Introduction Sociology 3E, OpenStax. · CC BY-NC-SA 4.0 · Original image ↗ · Access for free ↗

Conflict theorists are deeply critical of , asserting that it benefits only some people, not all of society. For instance, to a conflict theorist, it seems wrong that a basketball player is paid millions for an annual contract while a public school teacher may earn $35,000 a year. Stratification, conflict theorists believe, perpetuates inequality. Conflict theorists try to bring awareness to inequalities, such as how a rich society can have so many poor members.

Many conflict theorists draw on the work of Karl Marx. During the nineteenth-century era of industrialization, Marx believed resulted from people’s relationship to production. People were divided into two main groups: they either owned factories or worked in them. In Marx’s time, bourgeois capitalists owned high-producing businesses, factories, and land, as they still do today. Proletariats were the workers who performed the manual labor to produce goods. Upper-class capitalists raked in profits and got rich, while working-class proletariats earned skimpy wages and struggled to survive. With such opposing interests, the two groups were divided by differences of and . Marx believed workers experience deep alienation, isolation and misery resulting from powerless status levels (Marx 1848). Marx argued that proletariats were oppressed by the bourgeoisie.

Today, while working conditions have improved, conflict theorists believe that the strained working relationship between employers and employees still exists. Capitalists own the means of production, and a system is in place to make business owners rich and keep workers poor. According to conflict theorists, the resulting stratification creates class conflict.

uses everyday interactions of individuals to explain society as a whole. examines stratification from a micro-level perspective. This analysis strives to explain how people’s social standing affects their everyday interactions.

In most communities, people interact primarily with others who share the same social standing. It is precisely because of that people tend to live, work, and associate with others like themselves, people who share their same income level, educational background, class traits and even tastes in food, music, and clothing. The built-in system of groups people together. This is one of the reasons why it was rare for a royal prince like England’s Prince William to marry a commoner.

Symbolic interactionists also note that people’s appearance reflects their perceived social standing. As discussed above, class traits seen through housing, clothing, and transportation indicate social status, as do hairstyles, taste in accessories, and personal style. Symbolic interactionists also analyze how individuals think of themselves or others interpretation of themselves based on these class traits.

Figure a shows workers at a construction site. Figure B shows two people in business attire at a meeting in what appears to be a conference room.
Figure 9.14 — 9.4 Theoretical Perspectives on

Figure 9.14 (a) A group of construction workers on the job site, and (b) businesspeople in a meeting. What categories of stratification do these construction workers share? How do construction workers differ from executives or custodians? Who is more skilled? Who has greater prestige in society? (Credit: (a) Wikimedia Commons; Photo (b) Chun Kit/flickr)

Tonja R. Conerly, Kathleen Holmes, and Asha Lal Tamang, Introduction Sociology 3E, OpenStax. · CC BY-NC-SA 4.0 · Original image ↗ · Access for free ↗

To symbolically communicate social standing, people often engage in conspicuous consumption, which is the purchase and use of certain to make a social statement about status. Carrying pricey but eco-friendly water bottles could indicate a person’s social standing, or what they would like others to believe their social standing is. Some people buy expensive trendy sneakers even though they will never wear them to jog or play sports. A $17,000 car provides transportation as easily as a $100,000 vehicle, but the luxury car makes a social statement that the less expensive car can’t live up to. All these symbols of stratification are worthy of examination by an interactionist.

10.1 Global Stratification and Classification

OpenStax · 10.1 Global Stratification and Classification ↗
Instructional page including learning objectives, examples, figures, source tables and questions. Site navigation and embedded media players are omitted; source media links remain available.

Learning Objectives

By the end of this section, you should be able to:

  • Describe global stratification
  • Differentiate the development history of various classification systems
  • Use terminology from Wallerstein’s world systems approach
  • Explain the World Bank’s classification of economies

Just as the United States' is increasingly concentrated among its richest citizens, global inequality concentrates resources within certain nations and among certain people.

Measuring the financial resource of the world's richest people is generally easier than measuring the resources of people living in poverty (Matthews 2019), but researchers and advocates have created some tools to evaluate and understand economic conditions and outcomes.

One straightforward method is to compare the ratio of income of the richest 10 percent to the income of the poorest 10 percent. (The same method is sometime used with the richest 20 percent and the poorest 20 percent.) This method does not always provide a full picture of income inequality (it literally leaves out the middle), but it can certain provide insight.

The Human Development Index expresses the capabilities of people's potential achievement. The index is calculated using data regarding people's lifespan, education, and income. By using both financial and non-financial factors, it paints a deeper picture of the lives and issues in a region. For example, a nation with high income but low education will still have difficulty in overall opportunity. This approach was developed by Pakistani economist Mahbub ul Haq, who produced the first annual Human Development report, which captures and illustrates development issues and changes each year.

The Inequality-adjusted human development index (H D I) is shown. It has three dimensions. The first dimension is long and healthy life, which is measured by life expectancy. The second dimension is knowledge, which consists of expected years of schooling and mean years of schooling. The third dimension is a decent standard of living, which is measured by income per capita. All three produce indices, and then they are averaged, at the bottom, to produce the final index.
Figure 10.2 — 10.1 Global Stratification and Classification

Figure 10.2 The Human Development Index and its derivative, and extensions like the Inequality-adjusted Human Development Index (IHDI), were developed to center people—not just finances—as the core determinants of a nation's or region's discussions about economic opportunities, support, and policies. The index considers three main dimension (categories)—which are health, knowledge, and standard of living (income)—to calculate an individual value for each dimension, which is then averaged to produce the final value. (Under decent standard of living, GNI stands for gross national income, and PPP stands for purchasing power parity, both of which are key indicators of income and relative wealth.) (Credit: United Nations Development Programme)

Tonja R. Conerly, Kathleen Holmes, and Asha Lal Tamang, Introduction Sociology 3E, OpenStax. · CC BY-NC-SA 4.0 · Original image ↗ · Access for free ↗

Another measure of inequality is Gini Coefficient, named after the Italian sociologist and statistician Corrado Gini. (Be sure not to confuse this with GNI, which is the gross national income.) It is calculated using a number of financial indicators, and is expressed as either a decimal or a percentage. A country in which every resident has the same income would have a Gini coefficient of 0 (or 0 percent). A country in which one resident earned all the income, while everyone else earned nothing, would have an income Gini coefficient of 1 (or 100 percent). Thus, the higher the number (the closer to that one person having all the income or ), the more inequality there is.

Other gauges are a bit more direct: To indicate the level of poverty within a nation or region, researchers calculate the percentage of the population living beneath various poverty thresholds. A common measure is to consider the percentage of a nation's population living on less than $1.90 per day, which is commonly known as the International Poverty Line. (Note that United States dollars are often used as a global standard in these types of measurement.) The table in the next sub-section uses this method.

These are just a few of the ways that sociologists, economists, governments, and others try to understand levels of income inequality and poverty. Changes in these indicators would alert policymakers that something is affecting the population. No changes might tell people that, for example, a new financial assistance program for the poor is not working.

With these analytical in mind, let’s consider how the three major sociological perspectives might contribute to our understanding of global inequality.

The functionalist perspective is a macroanalytical view that focuses on the way that all aspects of society are integral to the continued health and viability of the whole. A functionalist might focus on why we have global inequality and what social purposes it serves. This view might assert, for example, that we have global inequality because some nations are better than others at adapting to new technologies and profiting from a globalized economy, and that when core nation companies locate in peripheral nations, they expand the local economy and benefit the workers.

focuses on the creation and reproduction of inequality. A conflict theorist would likely address the systematic inequality created when core nations exploit the resources of peripheral nations. For example, how many U.S. companies take advantage of overseas workers who lack the constitutional protection and guaranteed minimum wages that exist in the United States? Doing so allows them to maximize profits, but at what cost?

The symbolic interaction perspective studies the day-to-day impact of global inequality, the meanings individuals attach to global stratification, and the subjective nature of poverty. Someone applying this view to global inequality would probably focus on understanding the difference between what someone living in a core nation defines as poverty (, defined as being unable to live the lifestyle of the average person in your country) and what someone living in a peripheral nation defines as poverty (extreme poverty, defined as being barely able, or unable, to afford basic necessities, such as food).

Global Stratification

While stratification in the United States refers to the unequal distribution of resources among individuals, global stratification refers to this unequal distribution among nations. There are two dimensions to this stratification: gaps between nations and gaps within nations. When it comes to global inequality, both economic inequality and social inequality may concentrate the burden of poverty among certain segments of the earth’s population (Myrdal 1970).

As mentioned earlier, one way to evaluate stratification is to consider how many people are living in poverty, and particularly extreme poverty, which is often defined as needing to survive on less than $1.90 per day. Fortunately, until the COVID-19 pandemic impacted economies in 2020, the extreme poverty rate had been on a 20-year decline. In 2015, 10.1 percent of the world's population was living in extreme poverty; in 2017, that number had dropped an entire percentage point to 9.2 percent. While a positive, that 9.2 percent is equivalent to 689 million people living on less than $1.90 a day. The same year, 24.1 percent of the world lived on less than $3.20 per day and 43.6 percent on less than $5.50 per day in 2017 (World Bank 2020). The table below makes the differences in poverty very clear.

Country Percentage of people living on less than $1.90 Percentage of people living on less than $3.90 Percentage of people living on less than $5.50
Colombia 4.1 10.9 27.8
Costa Rica 1.4 3.6 10.9
Georgia 4.5 15.7 42.9
Kyrgyzstan 0.9 15.5 61.3
Sierra Leone 40.1 74.4 92.1
Angola 51.8 73.2 89.3
Lithuania 0.7 1.0 3.8
Ukraine 0.0 0.4 4.0
Vietnam 1.9 7.0 23.6
Indonesia 3.6 9.6 53.2
Table 10.1 The differences among countries is clear when considering their extreme poverty rates. For the most part, the selected countries show disparities even within countries from the same regions. All data is from 2018. (World Bank 2020)

Most of us are accustomed to thinking of global stratification as economic inequality. For example, we can compare the United States’ average worker’s wage to America’s average wage. Social inequality, however, is just as harmful as economic discrepancies. and —whether against a certain race, , religion, or the like—can create and aggravate conditions of economic equality, both within and between nations. Think about the inequity that existed for decades within the nation of South Africa. Apartheid, one of the most extreme cases of institutionalized and legal racism, created a social inequality that earned it the world’s condemnation.

Gender inequity is another global concern. Consider the controversy surrounding female genital mutilation. Nations that practice this female circumcision procedure defend it as a longstanding cultural tradition in certain tribes and argue that the West shouldn’t interfere. Western nations, however, decry the practice and are working to stop it.

Inequalities based on and exist around the globe. According to Amnesty International, a number of crimes are committed against individuals who do not conform to traditional gender roles or sexual orientations (however those are culturally defined). From culturally sanctioned rape to state-sanctioned executions, the abuses are serious. These legalized and culturally accepted forms of and exist everywhere—from the United States to Somalia to Tibet—restricting the freedom of individuals and often putting their lives at risk (Amnesty International 2012).

Global Classification

A major concern when discussing global inequality is how to avoid an ethnocentric bias implying that less-developed nations want to be like those who’ve attained post-industrial global . Terms such as developing (nonindustrialized) and developed (industrialized) imply that unindustrialized countries are somehow inferior, and must improve to participate successfully in the global economy, a label indicating that all aspects of the economy cross national borders. We must take care how we delineate different countries. Over time, terminology has shifted to make way for a more inclusive view of the world.

Global classification methods are not only important in understanding economic differences among countries, but also in providing ways to classify countries and identify trends in other areas. The classifications discussed below will be used in other chapters, such as the chapter on health and medicine.

Cold War Terminology

Cold War terminology was developed during the Cold War era (1945–1980). Familiar and still used by many, it classifies countries into first world, second world, and third world nations based on their respective economic development and of living. When this nomenclature was developed, capitalistic democracies such as the United States and Japan were considered part of the first world. The poorest, most undeveloped countries were referred to as the third world and included most of sub-Saharan Africa, Latin America, and Asia. The second world was the in-between category: nations not as limited in development as the third world, but not as well off as the first world, having moderate economies and standard of living, such as China or Cuba. Later, sociologist Manual Castells (1998) added the term fourth world to refer to stigmatized minority groups that were denied a political voice all over the globe (indigenous minority populations, prisoners, and the homeless, for example).

Also during the Cold War, global inequality was described in terms of economic development. Along with developing and developed nations, the terms less-developed nation and underdeveloped nation were used. This was the era when the idea of noblesse oblige (first-world responsibility) took root, suggesting that the so-termed developed nations should provide foreign aid to the less-developed and underdeveloped nations in order to raise their standard of living.

Immanuel Wallerstein: World Systems Approach

Immanuel Wallerstein’s (1979) world systems approach uses an economic basis to understand global inequality. Wallerstein conceived of the global economy as a complex system that supports an economic hierarchy that placed some nations in positions of with numerous resources and other nations in a state of economic subordination. Those that were in a state of subordination faced significant obstacles to mobilization.

Core nations are capitalist countries, highly industrialized, technological, and urbanized. For example, Wallerstein contends that the United States is an economic powerhouse that can support or deny support to important economic legislation with far-reaching implications, thus exerting control over every aspect of the global economy and exploiting both semi-peripheral and peripheral nations. We can look at free trade agreements such as the North American Free Trade Agreement (NAFTA) as an example of how a core nation is able to leverage its to gain the most advantageous position in the matter of global trade.

Peripheral nations have very little industrialization; what they do have often represents the outdated castoffs of core nations or the factories and means of production owned by core nations. They typically have unstable governments, inadequate social programs, and are economically dependent on core nations for jobs and aid. There are abundant examples of countries in this category, such as Vietnam and Cuba. We can be sure the workers in a Cuban cigar factory, for example, which are owned or leased by global core nation companies, are not enjoying the same privileges and rights as U.S. workers.

Semi-peripheral nations are in-between nations, not powerful enough to dictate policy but nevertheless acting as a major source for raw material and an expanding middle-class marketplace for core nations, while also exploiting peripheral nations. Mexico is an example, providing abundant cheap agricultural labor to the U.S., and supplying goods to the United States market at a rate dictated by the U.S. without the constitutional protections offered to United States workers.

World Bank Economic Classification by Income

While the World Bank is often criticized, both for its policies and its method of calculating data, it is still a common source for global economic data. Along with the economy, the World Bank tracks demographics and environmental health to provide a complete picture of whether a nation is high income, middle income, or low income.

This world map shows advanced, transitioning, less, and least developed countries. Low income countries are those with an annual income of $1025 or less per capita, and include Afghanistan, Syria, Yemen, Madagascar, and many central African nations. Lower middle income countries have an annual income between $1026 and $4035 per capita, and include India, Pakistan, Vietnam, Burma, Papua New Guinea, Ukraine, Moldova, Bolivia, and many countries on the African coastal areas. Upper middle income countries have an income between $4036 and $12075, and include Russia, China, Kazakstan, Romania, Iran, Iraq, Libya, Mexico, and most South American countries as well as the nations in the very south of Africa. High income countries have an income over $12076 per capita and include Saudi Arabia, Oman, Australia, Japan, South Korea, most of Europe, Chile, Uruguay, The United States, and Canada.
Figure 10.3 — 10.1 Global Stratification and Classification

Figure 10.3 This world map shows advanced, transitioning, less, and least developed countries. Note that the data in this map is one year older than the data presented in the text below. (Credit: Sbw01f, data obtained from the CIA World Factbook/Wikimedia Commons)

Tonja R. Conerly, Kathleen Holmes, and Asha Lal Tamang, Introduction Sociology 3E, OpenStax. · CC BY-NC-SA 4.0 · Original image ↗ · Access for free ↗

High-Income Nations

The World Bank defines high-income nations as having a gross national income of at least $12,536 per capita. in 2019 (World Bank 2021). (Note that the classifications will always lag by a couple of years so that analysts can evaluate the true income of the nations.) Examples include Belgium, Canada, Japan, Oman, Puerto Rico, and the United States.

High-income countries face two major issues: capital flight and . Capital flight refers to the movement (flight) of capital from one nation to another, as when General Motors automotive company closed U.S. factories in Michigan and opened factories in Mexico.

, a related issue, occurs as a consequence of capital flight, as no new companies open to replace jobs lost to foreign nations. As expected, global companies move their industrial processes to the places where they can get the most production with the least cost, including the building of infrastructure, training of workers, shipping of goods, and, of course, paying employee wages. This means that as emerging economies create their own industrial zones, global companies see the opportunity for existing infrastructure and much lower costs. Those opportunities lead to businesses closing the factories that provide jobs to the middle class within core nations and moving their industrial production to peripheral and semi-peripheral nations.

Big Picture

Capital Flight, Outsourcing, and Jobs in the United States

A large open space within a factory complex is littered with discarded cinder blocks, garbage, and pieces that have broken off the buildings. The structures all have broken windows and eroding concrete.
Figure 10.4 — 10.1 Global Stratification and Classification

Figure 10.4 Factories and stores in places like the Detroit metro area have been closed and abandoned as companies go out of business. (Credit: Joe Nuxoll/flickr)

Tonja R. Conerly, Kathleen Holmes, and Asha Lal Tamang, Introduction Sociology 3E, OpenStax. · CC BY-NC-SA 4.0 · Original image ↗ · Access for free ↗

Capital flight describes jobs and infrastructure moving from one nation to another. Look at the U.S. automobile industry. In the early twentieth century, the cars driven in the United States were made here, employing thousands of workers in Detroit and in the companies that produced everything that made building cars possible. However, once the fuel crisis of the 1970s hit and people in the United States increasingly looked to imported cars with better gas mileage, U.S. auto manufacturing began to decline. During the 2007–2009 recession, the U.S. government provided emergency funding (usually called a "bail out") for the three main auto companies, which is evidence of those companies' vulnerability. At the same time, Japanese-owned Toyota and Honda and South Korean Kia maintained stable sales levels.

Capital flight also occurs when services (as opposed to manufacturing) are relocated. Chances are if you have called the tech support line for your cell phone or Internet provider, you’ve spoken to someone halfway across the globe. This professional might tell you her name is Susan or Joan, but her accent makes it clear that her real name might be Parvati or Indira. It might be the middle of the night in that country, yet these service providers pick up the line saying, “Good morning,” as though they are in the next town over. They know everything about your phone or your modem, often using a remote server to log in to your home computer to accomplish what is needed. These are the workers of the twenty-first century. They are not on factory floors or in traditional sweatshops; they are educated, speak at least two languages, and usually have significant technology skills. They are skilled workers, but they are paid a of what similar workers are paid in the United States. For U.S. and multinational companies, the equation makes sense. India and other semi-peripheral countries have emerging infrastructures and education systems to fill their needs, without core nation costs.

As services are relocated, so are jobs. In the United States, unemployment is high. Many college-educated people are unable to find work, and those with only a high school diploma are in even worse shape. We have, as a country, outsourced ourselves out of jobs, and not just menial jobs, but white-collar work as well. But before we complain too bitterly, we must look at the of consumerism that we embrace. A flat screen television that might have cost $1,000 a few years ago is now $250. That cost savings has to come from somewhere. When consumers seek the lowest possible price, shop at big box stores for the biggest discount they can get, and generally ignore other factors in exchange for low cost, they are building the market for outsourcing. And as the demand is built, the market will ensure it is , even at the expense of the people who wanted it in the first place.

Many people at workstations in a call center are shown here.
Figure 10.5 — 10.1 Global Stratification and Classification

Figure 10.5 Outsourcing was initially a practice for manufacturing and related work. But as more technically skilled people become more available in other countries, customer service and other services are being moved out of the United States as well? (Credit: Carlos Ebert/flickr)

Tonja R. Conerly, Kathleen Holmes, and Asha Lal Tamang, Introduction Sociology 3E, OpenStax. · CC BY-NC-SA 4.0 · Original image ↗ · Access for free ↗

Middle-Income Nations

The World Bank divides middle-income economies into two categories. Lower middle income areas are those with a GNI per capita of more than $1,036 but less than $4,045. Upper middle income areas are those with A GNI per capita between $4,046 and $12,535. Democratic Republic of Congo, Tunisia, Philippines, El Salvador, and Nepal are are examples of lower-middle-income countries. And Argentina, Mexico, China, Iran, Turkey, and Namibia are examples of upper-middle-income nations (World Bank 2021).

Perhaps the most pressing issue for middle-income nations is the problem of debt accumulation. As the name suggests, debt accumulation is the buildup of external debt, wherein countries borrow money from other nations to fund their expansion or growth goals. As the uncertainties of the global economy make repaying these debts, or even paying the interest on them, more challenging, nations can find themselves in trouble. Once global markets have reduced the value of a country’s goods, it can be very difficult to ever manage the debt burden. Such issues have plagued middle-income countries in Latin America and the Caribbean, as well as East Asian and Pacific nations (Dogruel and Dogruel 2007).

Low-Income Nations

The World Bank defines low-income countries as nations whose per capita GNI was $1,035 per capita or less in 2019. For example, Afghanistan, Ethiopia, and Yemen are considered low-income countries. Low-income economies are primarily found in Asia and Africa (World Bank 2021), where most of the world’s population lives. There are two major challenges that these countries face: women are disproportionately affected by poverty (in a trend toward a global feminization of poverty) and much of the population lives in .

Nations' classifications often change as their economies evolve and, sometimes, when their political positions change. Nepal, Indonesia, and Romania all moved up to a higher status based on improved economies. While Sudan, Algeria, and Sri Lanka moved down a level. A few years ago, Myanmar was a low-income nation, but now it has moved into the middle-income area. With Myanmar's 2021 coup, the massive citizen response, and the military's killing of protesters, its economy may go through a downturn again, returning it to the low-income nation status.

19.3 Health in the United States

OpenStax · 19.3 Health in the United States ↗
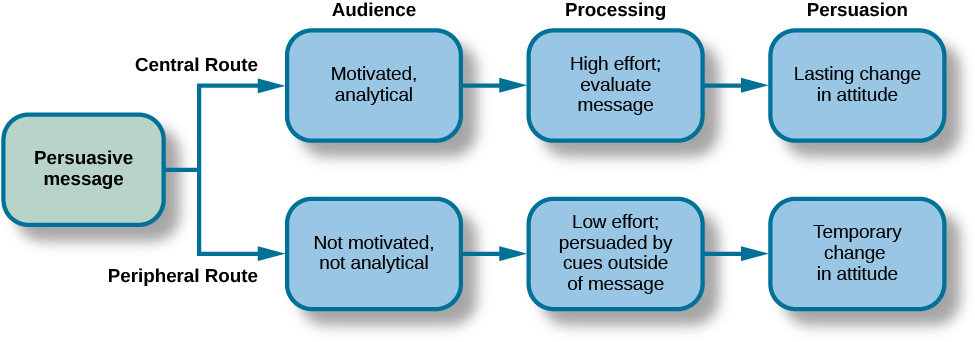
Instructional page including learning objectives, examples, figures, source tables and questions. Site navigation and embedded media players are omitted; source media links remain available.

Learning Objectives

By the end of this section, you should be able to:

Health in the United States is a complex and often contradictory issue. On the one hand, as one of the wealthiest nations, the United States fares well in health comparisons with the rest of the world. However, the United States also lags behind almost every industrialized country in terms of providing care to all its citizens. The following sections look at different aspects of health in the United States.

Health by Race and

When looking at the of the United States, it is hard to miss the disparities among races. The discrepancy between Black and White Americans shows the gap clearly; in 2018, the average life expectancy for White males was approximately five years longer than for Black males: 78.8 compared to 74.7 (Wamsley 2021). (Note that in 2020 life expectancies of all races declined further, though the unprecedented COVID-19 pandemic was a significant cause.) Other indicates show a similar disparity. The 2018 infant mortality rates for different races and ethnicities are as follows:

  • Non-Hispanic Black people: 10.8
  • Native Hawaiian people or other Pacific Islanders: 9.4
  • Native American/Alaska Native people: 8.2
  • Hispanic people: 4.9
  • Non-Hispanic White people: 4.6
  • Asian and Asian American people: 3.6 (Centers for Disease Control 2021)

According to a report from the Henry J. Kaiser Foundation (2007), African Americans also have higher of several diseases and causes of mortality, from to heart disease to diabetes. In a similar vein, it is important to note that ethnic minorities, including Mexican Americans and Native Americans, also have higher rates of these diseases and causes of mortality than White people.

Lisa Berkman (2009) notes that this gap started to narrow during the Civil Rights movement in the 1960s, but it began widening again in the early 1980s. What accounts for these perpetual disparities in health among different ethnic groups? Much of the answer lies in the level of healthcare that these groups receive. The National Healthcare Disparities Report shows that even after adjusting for insurance differences, racial and ethnic minority groups receive poorer and less than groups. The Report identified these racial inequalities in care:

  • Black people, Native Americans, and Alaska Native people received worse care than Whites for about 40 percent of quality measures.
  • Hispanic people, Native Hawaiian people, and Pacific Islanders received worse care than White people for more than 30 percent of quality measures.
  • Asian people received worse care than White people for nearly 30 percent of quality measures but better care for nearly 30 percent of quality measures (Agency for Healthcare Research and Quality 2020).

Health by

Discussions of health by race and often overlap with discussions of health by , since the two concepts are intertwined in the United States. As the Agency for Health Research and Quality (2010) notes, “racial and ethnic minorities are more likely than non-Hispanic whites to be poor or near poor,” so much of the data pertaining to subordinate groups is also likely to be pertinent to low socioeconomic groups. Marilyn Winkleby and her research associates (1992) state that “one of the strongest and most consistent predictors of a person's morbidity and mortality experience is that person's (). This finding persists across all diseases with few exceptions, continues throughout the entire lifespan, and extends across numerous risk factors for disease.” Morbidity is the of disease.

It is important to remember that economics are only part of the picture; research suggests that education also plays an important role. Phelan and Link (2003) note that many behavior-influenced diseases like lung (from smoking), coronary artery disease (from poor eating and exercise habits), and AIDS initially were widespread across groups. However, once information linking habits to disease was disseminated, these diseases decreased in high groups and increased in low groups. This illustrates the important role of education initiatives regarding a given disease, as well as possible inequalities in how those initiatives effectively reach different groups.

Health by Gender

Women are affected adversely both by unequal access to and institutionalized sexism in the healthcare industry. According to a recent report from the Kaiser Family Foundation, women experienced a decline in their ability to see needed specialists between 2001 and 2008. In 2008, one quarter of women questioned the quality of their healthcare (Ranji and Salganico 2011). Quality is partially indicated by access and cost. In 2018, roughly one in four (26%) women—compared to one in five (19%) men—reported delaying healthcare or letting conditions go untreated due to cost. Because of costs, approximately one in five women postponed preventive care, skipped a recommended test or treatment, or reduced their use of medication due to cost (Kaiser Family Foundation 2018).

We can see an example of institutionalized sexism in the way that women are more likely than men to be diagnosed with certain kinds of mental disorders. Psychologist Dana Becker notes that 75 percent of all diagnoses of Borderline (BPD) are for women according to the Diagnostic Statistical Manual of Mental Disorders. This diagnosis is characterized by instability of identity, of mood, and of behavior, and Becker argues that it has been used as a catch-all diagnosis for too many women. She further decries the pejorative connotation of the diagnosis, saying that it predisposes many people, both within and outside of the profession of psychotherapy, against women who have been so diagnosed (Becker).

Many critics also point to the of women’s issues as an example of institutionalized sexism. refers to the process by which previously normal aspects of life are redefined as deviant and needing medical attention to remedy. Historically and contemporaneously, many aspects of women’s lives have been medicalized, including menstruation, premenstrual syndrome, pregnancy, childbirth, and menopause. The of pregnancy and childbirth has been particularly contentious in recent decades, with many women opting against the medical process and choosing a more natural childbirth. Fox and Worts (1999) find that all women experience pain and anxiety during the birth process, but that relieves both as effectively as medical support. In other words, medical interventions are no more effective than social ones at helping with the difficulties of pain and childbirth. Fox and Worts further found that women with supportive partners ended up with less medical intervention and fewer cases of postpartum depression. Of course, access to quality birth care outside the standard medical models may not be readily available to women of all social classes.

Sociology in the Real World

of Sleeplessness

A child asleep at his desk is shown here.
Figure 19.4 — 19.3 Health in the United States
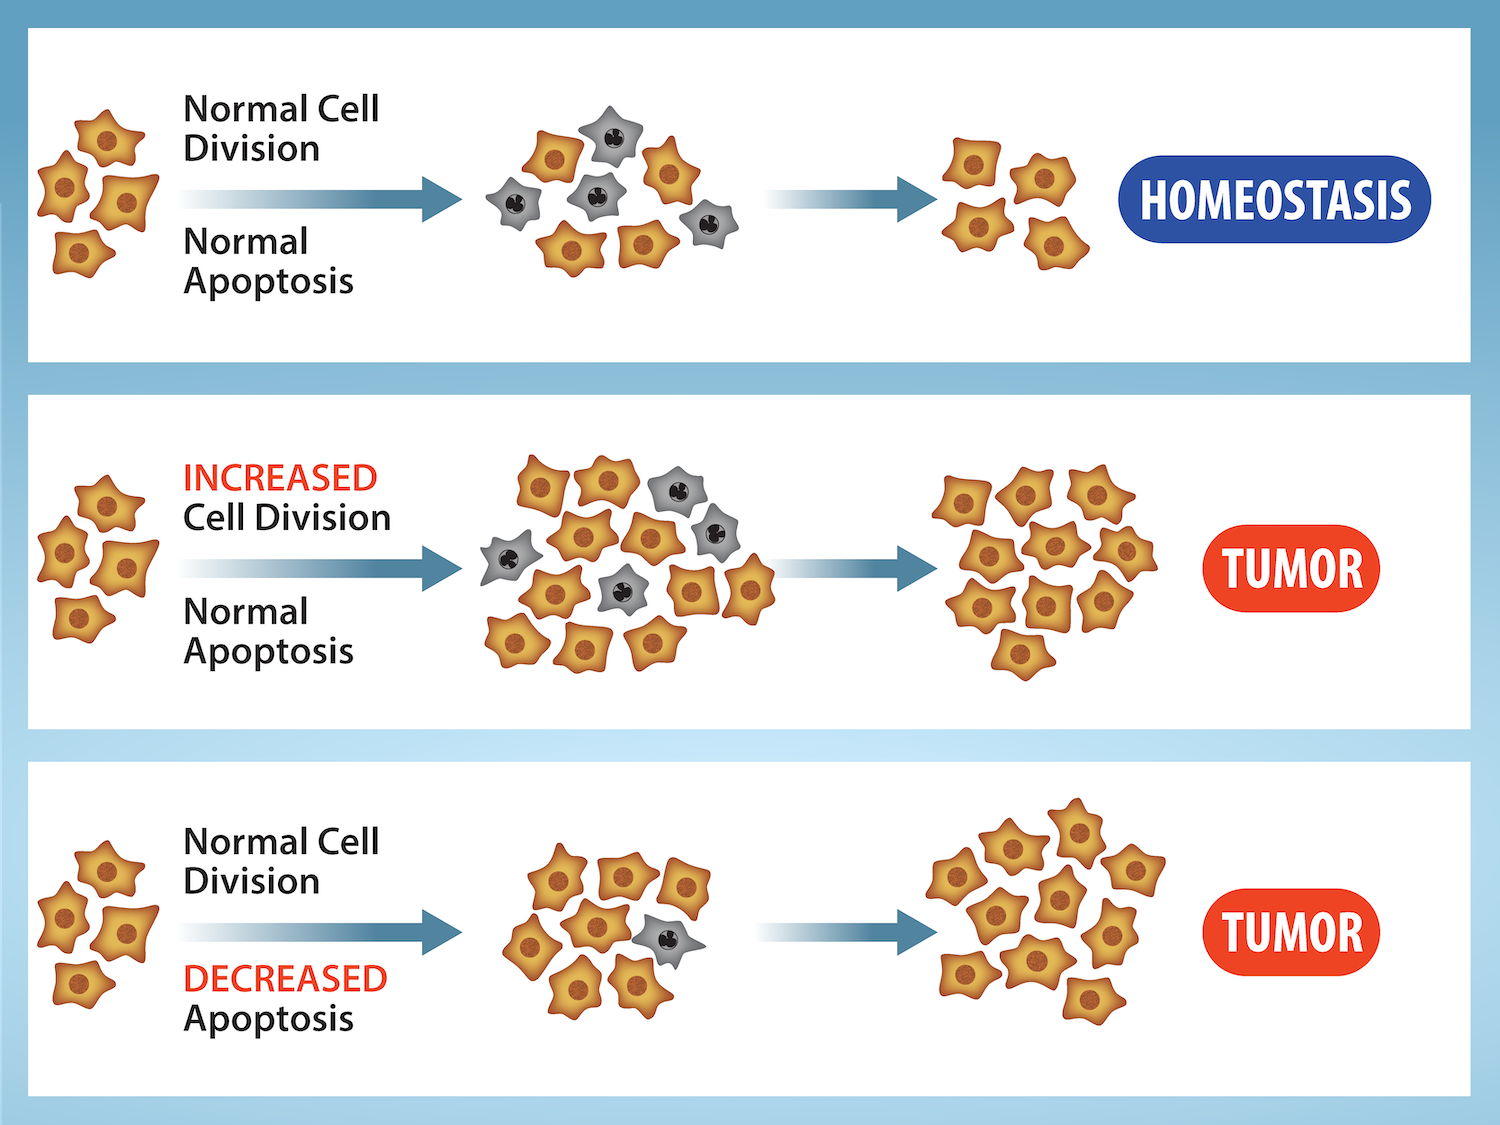
Figure 19.4 Many people fail to get enough sleep. But is insomnia a disease that should be cured with medication? (Credit: Wikimedia Commons)

Tonja R. Conerly, Kathleen Holmes, and Asha Lal Tamang, Introduction Sociology 3E, OpenStax. · CC BY-NC-SA 4.0 · Original image ↗ · Access for free ↗

How is your “sleep hygiene?” Sleep hygiene refers to the lifestyle and sleep habits that contribute to sleeplessness. Bad habits that can lead to sleeplessness include inconsistent bedtimes, lack of exercise, late-night employment, napping during the day, and sleep environments that include noise, lights, or screen time (National Institutes of Health 2011a).

According to the National Institute of Health, examining sleep hygiene is the first step in trying to solve a problem with sleeplessness.

For many people in the United States, however, making changes in sleep hygiene does not seem to be enough. According to a 2006 report from the Institute of Medicine, sleeplessness is an underrecognized public health problem affecting up to 70 million people. It is interesting to note that in the months (or years) after this report was released, advertising by the pharmaceutical companies behind Ambien, Lunesta, and Sepracor (three sleep aids) averaged $188 million weekly promoting these drugs (Gellene 2009).

According to a study in the American Journal of Public Health (2011), prescriptions for sleep medications increased dramatically from 1993 to 2007. While complaints of sleeplessness during doctor’s office visits more than doubled during this time, insomnia diagnoses increased more than sevenfold, from about 840,000 to 6.1 million. The authors of the study conclude that sleeplessness has been medicalized as insomnia, and that “insomnia may be a public health concern, but potential overtreatment with marginally effective, expensive medications with nontrivial side effects raises definite population health concerns” (Moloney, Konrad, and Zimmer 2011). Indeed, a study published in 2004 in the Archives of Internal Medicine shows that cognitive behavioral therapy, not medication, was the most effective sleep intervention (Jacobs, Pace-Schott, Stickgold, and Otto 2004).

A century ago, people who couldn’t sleep were told to count sheep. Now they pop a pill, and all those pills add up to a very lucrative market for the pharmaceutical industry. Is this industry behind the of sleeplessness, or is it just responding to a need?

Mental Health and Disability

The treatment received by those defined as mentally ill or disabled varies greatly from country to country. In the post-millennial United States, those of us who have never experienced such a disadvantage take for granted the rights our society guarantees for each citizen. We do not think about the relatively recent nature of the protections, unless, of course, we know someone constantly inconvenienced by the lack of accommodations or misfortune of suddenly experiencing a temporary disability.

Mental Health

People with mental disorders (a condition that makes it more difficult to cope with everyday life) and people with mental illness (a severe, lasting mental disorder that requires long-term treatment) experience a wide range of effects. According to the National Institute of Mental Health (NIMH), the United States has over 50 million adults with mental illness or mental disorder, or 20 percent of the total adult population. Of these, 13 million have what is considered serious mental illness or mental disorder (5 percent of the adult population); serious mental illness is that which causes impairment or disability (National Institute of Mental Health 2021). Finally, 16.5 percent of children aged 6-17 experienced mental illness or disorder (National Alliance on Mental Illness 2021).

The most common mental disorders in the United States are anxiety disorders. Almost 18 percent of U.S. adults are likely to be affected in a single year, and 28 percent are likely to be affected over the course of a lifetime (Anxiety and Depression Institute of America 2021). It is important to distinguish between occasional feelings of anxiety and a true anxiety disorder. Anxiety is a normal to stress that we all feel at some point, but anxiety disorders are feelings of worry and fearfulness that last for months at a time. Anxiety disorders include obsessive compulsive disorder (OCD), panic disorders, (), and both social and specific phobias.

The second most common mental disorders in the United States are mood disorders; roughly 10 percent of U.S. adults are likely to be affected yearly, while 21 percent are likely to be affected over the course of a lifetime (National Institute of Mental Health 2005). Mood disorders are the most common causes of illness-related hospitalization in the U.S. (Agency for Healthcare Research and Quality 2021). Major mood disorders are depression and dysthymic disorder. Like anxiety, depression might seem like something that everyone experiences at some point, and it is true that most people feel sad or “blue” at times in their lives. A true depressive episode, however, is more than just feeling sad for a short period. It is a long-term, debilitating illness that usually needs treatment to cure. Bipolar disorder is characterized by dramatic shifts in energy and mood, often affecting the individual’s ability to carry out day-to-day tasks. Bipolar disorder used to be called manic depression because of the way people would swing between manic and depressive episodes.

Depending on what definition is used, there is some overlap between mood disorders and personality disorders, which affect 9 percent of people in the United States yearly. A is an enduring and inflexible pattern of long duration leading to significant distress or impairment, that is not due to use of substances or another medical condition. In other words, personality disorders cause people to behave in ways that are seen as abnormal to society but seem normal to them.

The diagnosis and classification regarding personality disorders has been evolving and is somewhat controversial. To guide diagnosis and potential treatments of mental disorders, the American Psychiatric Association publishes the Diagnostic and Statistical Manual on Mental Disorders (). Experts working on the latest version initially proposed changing the categories of personality disorders. However, the final publication retains the original ten categories, but contains an alternate/emerging approach for classifying them. This evolution demonstrates the challenges and the wide array of treating conditions, and also represents areas of difference between theorists, practitioners, governing bodies, and other stakeholders. As discussed in the Sociological Research chapter, study and investigation is a diligent and multi-dimensional process. As the diagnostic application evolves, we will see how their definitions help scholars across disciplines understand the intersection of health issues and how they are defined by social institutions and cultural norms.

White pills next to a pill bottle are shown here.
Figure 19.5 — 19.3 Health in the United States

Figure 19.5 Medication is a common option for children with ADHD. (Credit: Deviation56/Wikimedia Commons)

Tonja R. Conerly, Kathleen Holmes, and Asha Lal Tamang, Introduction Sociology 3E, OpenStax. · CC BY-NC-SA 4.0 · Original image ↗ · Access for free ↗

Another commonly diagnosed mental disorder is Attention-Deficit/Hyperactivity Disorder (ADHD), which affects 9 percent of U.S. children and 4 percent of adults on a lifetime basis (Danielson 2018). Since ADHD is one of the most common childhood disorders, it is often incorrectly considered only a disease found in children. But ADHD can be a serious issue for adults who either had been diagnosed as children or who are diagnosed as adults. ADHD is marked by difficulty paying attention, difficulty controlling behavior, and hyperactivity. As a result, it can lead to educational and behavioral issues in children, success issues in college, and challenges in workplace and family life. However, there is some social debate over whether such drugs are being overprescribed (American Psychological Association). A significant difficulty in diagnosis, treatment, and societal understanding of ADHD is that it changes in expression based on a wide range of factors, including age (CHADD 2020).

Autism Disorders (ASD) encompass a group of developmental brain disorders that are characterized by "deficits in social interaction, verbal and nonverbal communication, and engagement in repetitive behaviors or interests” (National Institute of Mental Health). As of 2021, the CDC estimates that 1 in 54 children has an autism disorder. Beyond the very high , the rate of diagnosis has been increasing steadily as awareness became more widespread. In 2005, the rate was 1 in 166 children; in 2012 it was 1 in 88 children. The rate of increase and awareness has assisted diagnosis and treatment, but autism is a cause of significant fear among parents and families. Because of its impact on relationships and especially verbal communication, children with autism (and their parents) can be shunned, grossly misunderstood, and mistreated. For example, people with an autism disorder who cannot verbalize are often assumed to be unintelligent, or are sometimes left out of conversations or activities because others feel they cannot participate. Parents may be reluctant to let their children play with or associate with children with ASD. Adults with ASD go through many of the same misconceptions and mistreatments, such as being denied opportunities or being made to feel unwelcome (Applied Behavior Analysis).

Disability

A blue handicapped accessible sign is shown here.
Figure 19.6 — 19.3 Health in the United States

Figure 19.6 The accessibility sign indicates that people with disabilities can access the facility. The Americans with Disabilities Act requires that access be provided to everyone. (Credit: Ltljltlj/Wikimedia Commons)

Tonja R. Conerly, Kathleen Holmes, and Asha Lal Tamang, Introduction Sociology 3E, OpenStax. · CC BY-NC-SA 4.0 · Original image ↗ · Access for free ↗

Disability refers to a in one’s ability to perform everyday tasks. The World Health Organization makes a distinction between the various terms used to describe disabilities. They use the term impairment to describe the physical limitations, while reserving the term disability to refer to the social limitation.

Before the passage of the Americans with Disabilities Act (ADA) in 1990, people in the United States with disabilities were often excluded from opportunities and social institutions many of us take for granted. This occurred not only through employment and other kinds of but also through casual acceptance by most people in the United States of a world designed for the convenience of the able-bodied. Imagine being in a wheelchair and trying to use a sidewalk without the benefit of wheelchair-accessible curbs. Imagine as a blind person trying to access information without the widespread availability of Braille. Imagine having limited motor control and being faced with a difficult-to-grasp round door handle. Issues like these are what the ADA tries to address. Ramps on sidewalks, Braille instructions, and more accessible door levers are all accommodations to help people with disabilities.

People with disabilities can be stigmatized by their illnesses. Stigmatization means their identity is spoiled; they are labeled as different, discriminated against, and sometimes even shunned. They are labeled (as an interactionist might point out) and ascribed a (as a functionalist might note), becoming “the blind girl” or “the boy in the wheelchair” instead of someone afforded a full identity by society. This can be especially true for people who are disabled due to mental illness or disorders.

As discussed in the section on mental health, many mental health disorders can be debilitating and can affect a person’s ability to cope with everyday life. This can affect social status, housing, and especially employment. According to the Bureau of Labor Statistics (2011), people with a disability had a higher rate of unemployment than people without a disability in 2010: 14.8 percent to 9.4 percent. This unemployment rate refers only to people actively looking for a job. In , eight out of ten people with a disability are considered “out of the labor force;” that is, they do not have jobs and are not looking for them. The combination of this population and the high unemployment rate leads to an employment-population ratio of 18.6 percent among those with disabilities. The employment-population ratio for people without disabilities was much higher, at 63.5 percent (U.S. Bureau of Labor Statistics 2011).

Sociology in the Real World

Obesity: The Last Acceptable ?

Many people who see a person with obesity may make negative assumptions about them based on their size. According to a study from the Yale Rudd Center for Food Policy and Obesity, large people are the object of “widespread negative stereotypes that overweight and obese persons are lazy, unmotivated, lacking in self-discipline, less , noncompliant, and sloppy” (Puhl and Heuer 2009).

Historically, both in the United States and elsewhere, it was considered acceptable to discriminate against people based on prejudiced opinions. Even after slavery was abolished through the 13th Amendment in 1865, institutionalized racism and against Black people persisted. In an example of interchangeability, the same insults that are flung today at the overweight and obese population (lazy, for instance) have been flung at various racial and ethnic groups in earlier history.

Why is it considered acceptable to feel toward—even to hate—people with obesity? Puhl and Heuer suggest that these feelings stem from the perception that obesity is preventable through self-control, better diet, and more exercise. Highlighting this contention is the that studies have shown that people’s perceptions of obesity are more positive when they think the obesity was caused by non-controllable factors like biology (a thyroid condition, for instance) or genetics.


Health experts emphasize that obesity is a disease, and that it is not the result of simple overeating. There are often a number of contributing factors that make it more difficult to avoid. Even with some understanding of non-controllable factors that might affect obesity, people with obesity are still subject to stigmatization. Puhl and Heuer’s study is one of many that document at work, in the media, and even in the medical profession. Large people are less likely to get into college than thinner people, and they are less likely to succeed at work.

Stigmatization of people with obesity comes in many forms, from the seemingly benign to the potentially illegal. In movies and television shows, overweight people are often portrayed negatively, or as stock characters who are the butt of jokes. One study found that in children’s movies “obesity was equated with negative traits (evil, unattractive, unfriendly, cruel) in 64 percent of the most popular children's videos. In 72 percent of the videos, characters with thin bodies had desirable traits, such as kindness or happiness” (Hines and Thompson 2007). In movies and television for adults, the negative portrayal is often meant to be funny. Think about the way you have seen obese people portrayed in movies and on television; now think of any other subordinate group being openly denigrated in such a way. It is difficult to find a parallel example.