Bottom-up processing builds interpretations from incoming sensory features; top-down processing uses expectations, knowledge, and goals to constrain those interpretations.
Compare bottom-up and top-down influences on perception
Bottom-up processing builds interpretations from incoming sensory features; top-down processing uses expectations, knowledge, and goals to constrain those interpretations. Reading an unfamiliar symbol from its lines emphasizes bottom-up input, whereas using the surrounding sentence to resolve an ambiguous letter emphasizes top-down influence. Both normally cooperate. A perceptual set biases which interpretation becomes likely, and culture or previous experience can change that set. Attention selects some available input for further processing, explaining why a visible unexpected object may go unnoticed. An illusion shows an interaction between stimulus structure and interpretation, not proof that sensory organs received no information.
Source: 5.1 Sensation versus Perception · 5.6 Gestalt Principles of Perception · 5.3 Vision
Use depth, form, motion, constancy, and Gestalt principles to explain perceptual judgments
Gestalt organization groups nearby elements by proximity, similar elements by similarity, aligned contours by good continuation, and moving elements by common fate; closure fills gaps, and figure–ground organization separates an object from background. Binocular disparity and convergence provide depth information; monocular cues include occlusion, relative size, linear perspective, texture gradient, and motion parallax. Size and shape constancy stabilize perceived objects despite changing retinal images. Apparent motion can arise from sequential stationary displays. No single cue is infallible: a drawing can place perspective and actual line length in conflict, producing a systematic depth or size illusion.
Source: 5.1 Sensation versus Perception · 5.6 Gestalt Principles of Perception · 5.3 Vision
Apply the ideas
Worked question. Two identical gray disks look different in size when placed in drawings suggesting different distances. Is the retina necessarily receiving different disk diameters?
No. Equal retinal sizes can be interpreted differently because inferred distance changes perceived size. This is a top-down/context-sensitive use of depth information. Control the surrounding perspective while retaining disk diameter; if judgments change, context contributes. Grouping nearby dots into rows instead of columns illustrates proximity, not binocular disparity.
Source: 5.1 Sensation versus Perception · 5.6 Gestalt Principles of Perception · 5.3 Vision
5.1 Sensation versus Perception — figures and tables
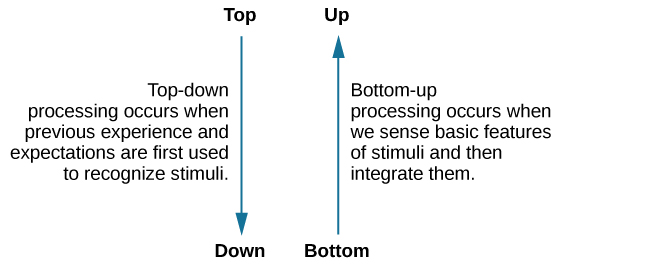
Figure 5.2 Top-down and bottom-up are ways we process our perceptions.
Rose M. Spielman, William J. Jenkins, and Marilyn D. Lovett, Psychology 2E, OpenStax. · CC BY-NC-SA 4.0 · Original image ↗ · Access for free ↗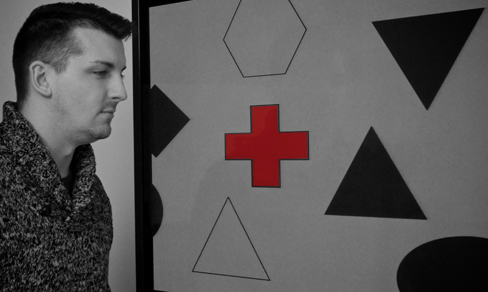
Figure 5.3 Nearly one third of participants in a study did not notice that a red cross passed on the screen because their attention was focused on the black or white figures. (credit: Cory Zanker)
Rose M. Spielman, William J. Jenkins, and Marilyn D. Lovett, Psychology 2E, OpenStax. (credit: Cory Zanker) · CC BY-NC-SA 4.0 · Original image ↗ · Access for free ↗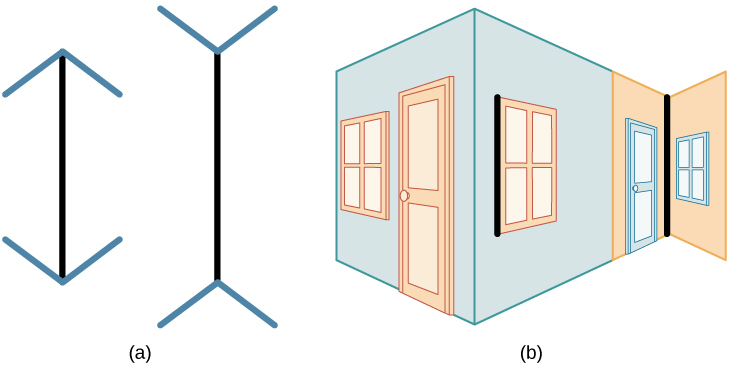
Figure 5.4 In the Müller-Lyer illusion, lines appear to be different lengths although they are identical. (a) Arrows at the ends of lines may make the line on the right appear longer, although the lines are the same length. (b) When applied to a three-dimensional image, the line on the right again may appear longer although both black lines are the same length.
Rose M. Spielman, William J. Jenkins, and Marilyn D. Lovett, Psychology 2E, OpenStax. · CC BY-NC-SA 4.0 · Original image ↗ · Access for free ↗Source: 5.1 Sensation versus Perception
5.6 Gestalt Principles of Perception — figures and tables
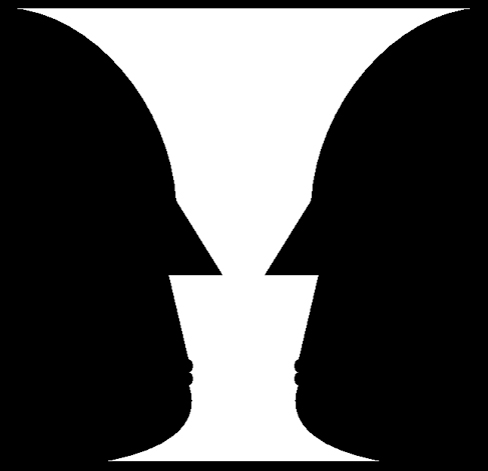
Figure 5.25 The concept of figure-ground relationship explains why this image can be perceived either as a vase or as a pair of faces.
Rose M. Spielman, William J. Jenkins, and Marilyn D. Lovett, Psychology 2E, OpenStax. · CC BY-NC-SA 4.0 · Original image ↗ · Access for free ↗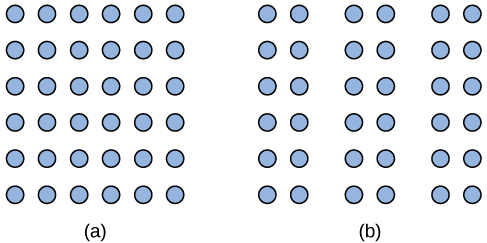
Figure 5.26 The Gestalt principle of proximity suggests that you see (a) one block of dots on the left side and (b) three columns on the right side.
Rose M. Spielman, William J. Jenkins, and Marilyn D. Lovett, Psychology 2E, OpenStax. · CC BY-NC-SA 4.0 · Original image ↗ · Access for free ↗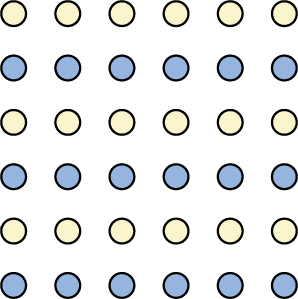
Figure 5.27 When looking at this array of dots, we likely perceive alternating rows of colors. We are grouping these dots according to the principle of similarity.
Rose M. Spielman, William J. Jenkins, and Marilyn D. Lovett, Psychology 2E, OpenStax. · CC BY-NC-SA 4.0 · Original image ↗ · Access for free ↗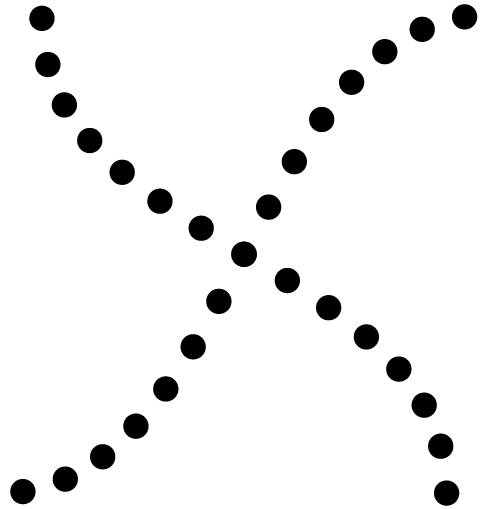
Figure 5.28 Good continuation would suggest that we are more likely to perceive this as two overlapping lines, rather than four lines meeting in the center.
Rose M. Spielman, William J. Jenkins, and Marilyn D. Lovett, Psychology 2E, OpenStax. · CC BY-NC-SA 4.0 · Original image ↗ · Access for free ↗
Figure 5.29 Closure suggests that we will perceive a complete circle and rectangle rather than a series of segments.
Rose M. Spielman, William J. Jenkins, and Marilyn D. Lovett, Psychology 2E, OpenStax. · CC BY-NC-SA 4.0 · Original image ↗ · Access for free ↗5.3 Vision — figures and tables

Figure 5.10 Our eyes take in sensory information that helps us understand the world around us. (credit "top left”: modification of work by "rajkumar1220"/Flickr"; credit “top right”: modification of work by Thomas Leuthard; credit “middle left”: modification of work by Demietrich Baker; credit “middle right”: modification of work by "kaybee07"/Flickr; credit “bottom left”: modification of work by "Isengardt"/Flickr; credit “bottom right”: modification of work by Willem Heerbaart)
Rose M. Spielman, William J. Jenkins, and Marilyn D. Lovett, Psychology 2E, OpenStax. (credit "top left”: modification of work by "rajkumar1220"/Flickr"; credit “top right”: modification of work by Thomas Leuthard; credit “middle left”: modification of work by Demietrich Baker; credit “middle right”: modification of work by "kaybee07"/Flickr; credit “bottom left”: modification of work by "Isengardt"/Flickr; credit “bottom right”: modification of work by Willem Heerbaart) · CC BY-NC-SA 4.0 · Original image ↗ · Access for free ↗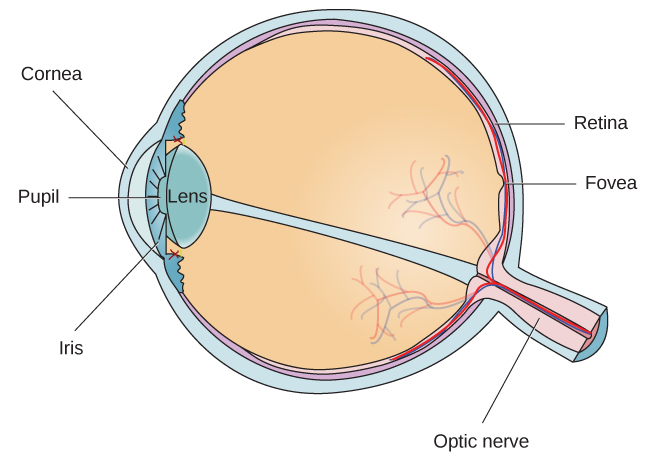
Figure 5.11 The anatomy of the eye is illustrated in this diagram.
Rose M. Spielman, William J. Jenkins, and Marilyn D. Lovett, Psychology 2E, OpenStax. · CC BY-NC-SA 4.0 · Original image ↗ · Access for free ↗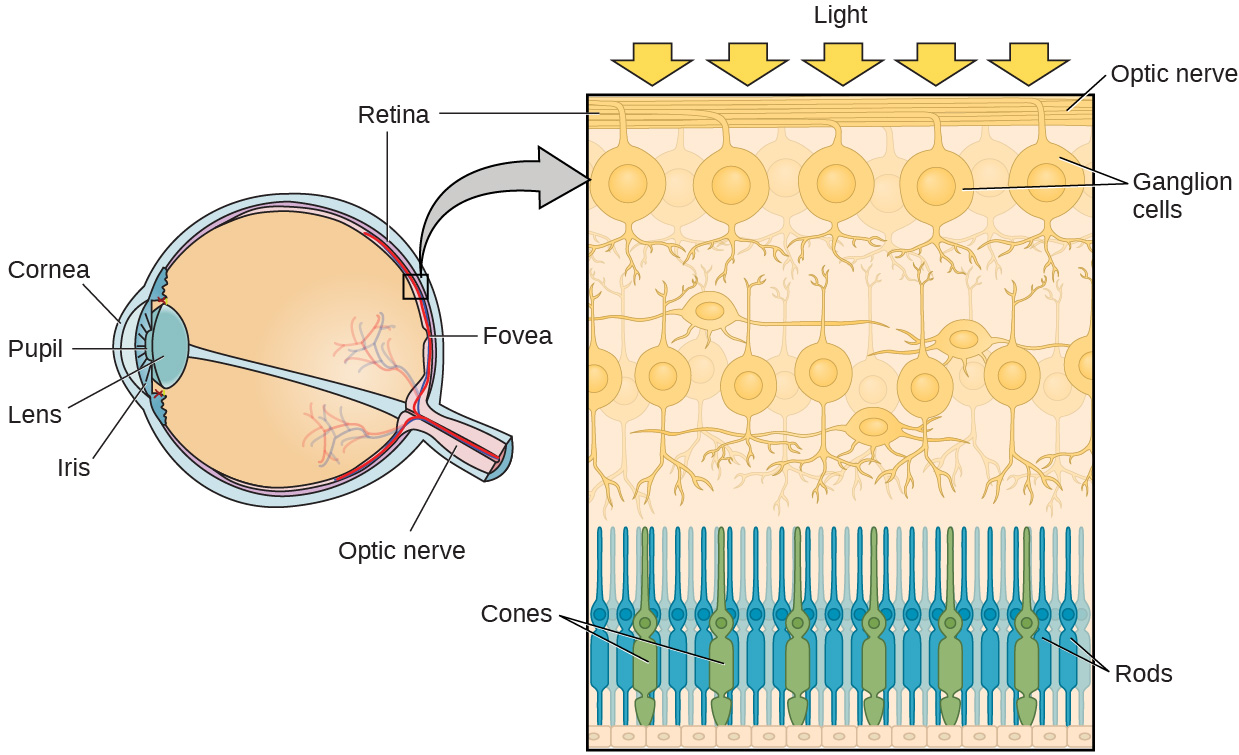
Figure 5.12 The two types of photoreceptors are shown in this image. Cones are colored green and rods are blue.
Rose M. Spielman, William J. Jenkins, and Marilyn D. Lovett, Psychology 2E, OpenStax. · CC BY-NC-SA 4.0 · Original image ↗ · Access for free ↗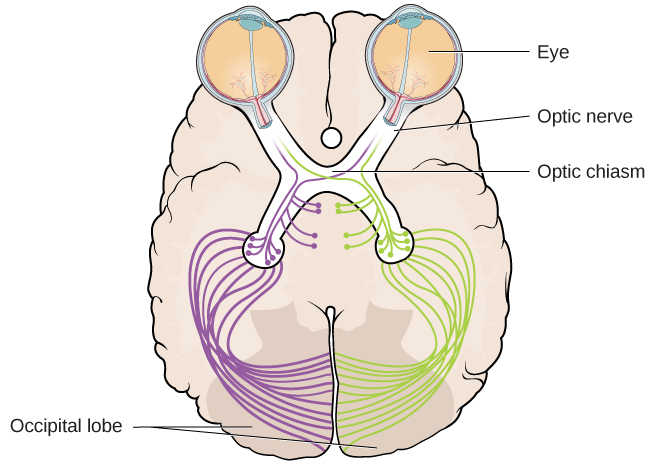
Figure 5.13 This illustration shows the optic chiasm at the front of the brain and the pathways to the occipital lobe at the back of the brain, where visual sensations are processed into meaningful perceptions.
Rose M. Spielman, William J. Jenkins, and Marilyn D. Lovett, Psychology 2E, OpenStax. · CC BY-NC-SA 4.0 · Original image ↗ · Access for free ↗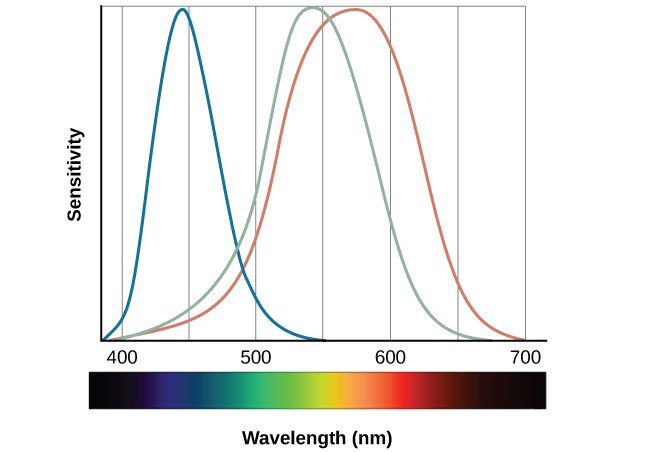
Figure 5.14 This figure illustrates the different sensitivities for the three cone types found in a normal-sighted individual. (credit: modification of work by Vanessa Ezekowitz)
Rose M. Spielman, William J. Jenkins, and Marilyn D. Lovett, Psychology 2E, OpenStax. (credit: modification of work by Vanessa Ezekowitz) · CC BY-NC-SA 4.0 · Original image ↗ · Access for free ↗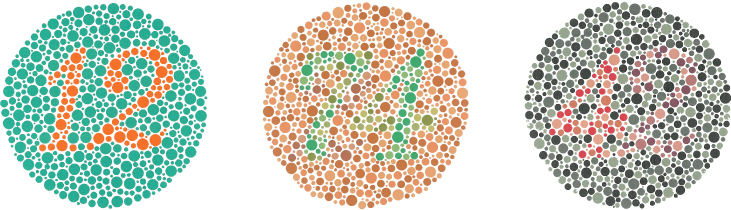
Figure 5.15 The Ishihara test evaluates color perception by assessing whether individuals can discern numbers that appear in a circle of dots of varying colors and sizes.
Rose M. Spielman, William J. Jenkins, and Marilyn D. Lovett, Psychology 2E, OpenStax. · CC BY-NC-SA 4.0 · Original image ↗ · Access for free ↗
Figure 5.16 Stare at the white dot for 30–60 seconds and then move your eyes to a blank piece of white paper. What do you see? This is known as a negative afterimage, and it provides empirical support for the opponent-process theory of color vision.
Rose M. Spielman, William J. Jenkins, and Marilyn D. Lovett, Psychology 2E, OpenStax. · CC BY-NC-SA 4.0 · Original image ↗ · Access for free ↗
Figure 5.17 We perceive depth in a two-dimensional figure like this one through the use of monocular cues like linear perspective, like the parallel lines converging as the road narrows in the distance. (credit: Marc Dalmulder)
Rose M. Spielman, William J. Jenkins, and Marilyn D. Lovett, Psychology 2E, OpenStax. (credit: Marc Dalmulder) · CC BY-NC-SA 4.0 · Original image ↗ · Access for free ↗Source: 5.3 Vision