Foundation 6 · 6A · Sensation and perception

Vision and visual processing

Sources ↗

The provides much of the eye’s refraction; the lens changes shape during to focus light on the retina.

Relate eye structures and retinal to image formation and

The provides much of the eye’s refraction; the lens changes shape during to focus light on the retina. The adjusts pupil size. are highly sensitive in dim light and provide little color ; support color and high acuity, especially in the . The lacks photoreceptors and creates a blind spot. Light changes the within an , triggering a signaling cascade that closes channels: vertebrate photoreceptors hyperpolarize and release less . Bipolar and ganglion-cell circuits transform this signal. Ganglion-cell axons form the optic nerve.

Source: 5.3 Vision

Trace visual pathways and explain parallel processing and feature detection

Nasal retinal axons cross at the ; temporal retinal axons remain ipsilateral. Each hemisphere therefore receives the opposite visual field from both eyes. Major conscious-vision signals relay through the to primary visual cortex. Parallel channels preserve different features: a ventral stream emphasizes object identity and a dorsal stream spatial relationships and visually guided action. Cortical respond selectively to features such as edge orientation. Trichromatic cone comparisons begin color coding; opponent red–green, blue–yellow, and luminance channels explain complementary afterimages. These are complementary levels of processing, not mutually exclusive color theories.

Source: 5.3 Vision

Apply the ideas

Worked question. A interrupts the left optic tract after the chiasm. Which visual field is most directly affected, and why does this differ from cutting the left optic nerve?

The right visual field of both eyes is affected because the left tract combines crossed right-eye nasal fibers with uncrossed left-eye temporal fibers. Cutting the left optic nerve removes input from the left eye before signals from the two eyes combine. This reasoning uses visual fields rather than confusing the side of the retina with the side of visual space.

Source: 5.3 Vision

5.3 Vision — figures and tables

Several photographs of peoples’ eyes are shown.
Figure 5.10 — 5.3 Vision

Figure 5.10 Our eyes take in sensory information that helps us understand the world around us. (credit "top left”: modification of work by "rajkumar1220"/Flickr"; credit “top right”: modification of work by Thomas Leuthard; credit “middle left”: modification of work by Demietrich Baker; credit “middle right”: modification of work by "kaybee07"/Flickr; credit “bottom left”: modification of work by "Isengardt"/Flickr; credit “bottom right”: modification of work by Willem Heerbaart)

Rose M. Spielman, William J. Jenkins, and Marilyn D. Lovett, Psychology 2E, OpenStax. (credit "top left”: modification of work by "rajkumar1220"/Flickr"; credit “top right”: modification of work by Thomas Leuthard; credit “middle left”: modification of work by Demietrich Baker; credit “middle right”: modification of work by "kaybee07"/Flickr; credit “bottom left”: modification of work by "Isengardt"/Flickr; credit “bottom right”: modification of work by Willem Heerbaart) · CC BY-NC-SA 4.0 · Original image ↗ · Access for free ↗
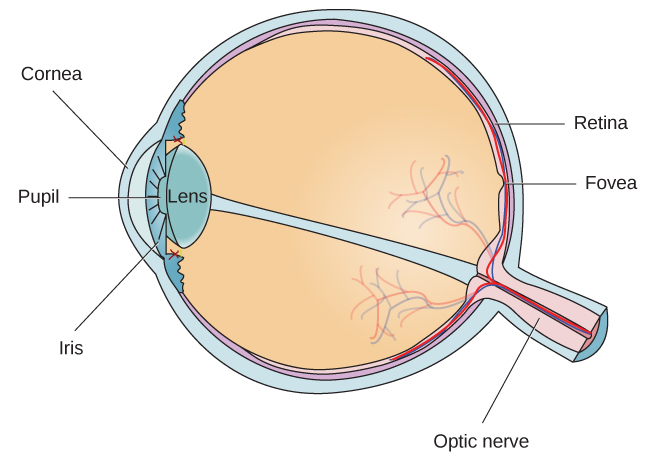
Different parts of the eye are labeled in this illustration. The cornea, pupil, iris, and lens are situated toward the front of the eye, and at the back are the optic nerve, fovea, and retina.
Figure 5.11 — 5.3 Vision

Figure 5.11 The anatomy of the eye is illustrated in this diagram.

Rose M. Spielman, William J. Jenkins, and Marilyn D. Lovett, Psychology 2E, OpenStax. · CC BY-NC-SA 4.0 · Original image ↗ · Access for free ↗
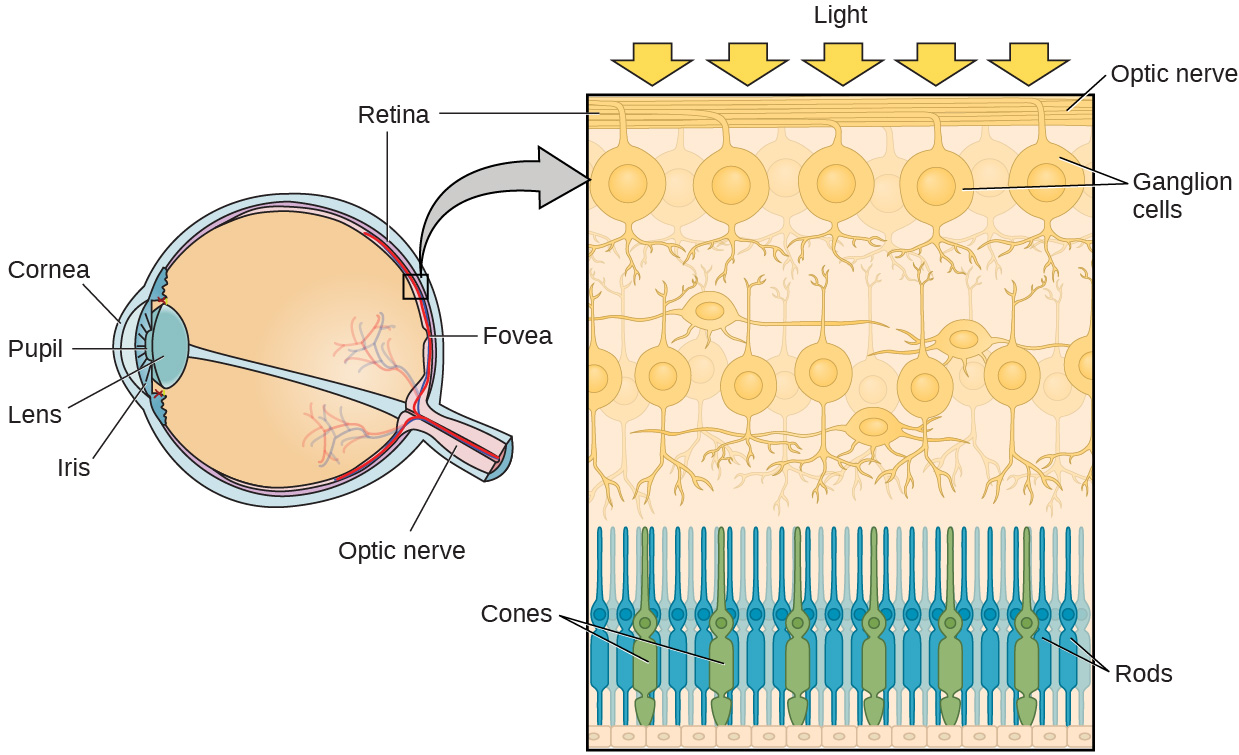
Different parts of the eye are labeled in the left side of this illustration. The cornea, pupil, iris, and lens are situated toward the front of the eye, and at the back are the optic nerve, fovea, and retina. The illustration on the right is a close-up of the layers of the eye. It shows light reaching the optic nerve, beneath which are Ganglion cells, and then rods and cones.
Figure 5.12 — 5.3 Vision

Figure 5.12 The two types of photoreceptors are shown in this image. Cones are colored green and rods are blue.

Rose M. Spielman, William J. Jenkins, and Marilyn D. Lovett, Psychology 2E, OpenStax. · CC BY-NC-SA 4.0 · Original image ↗ · Access for free ↗
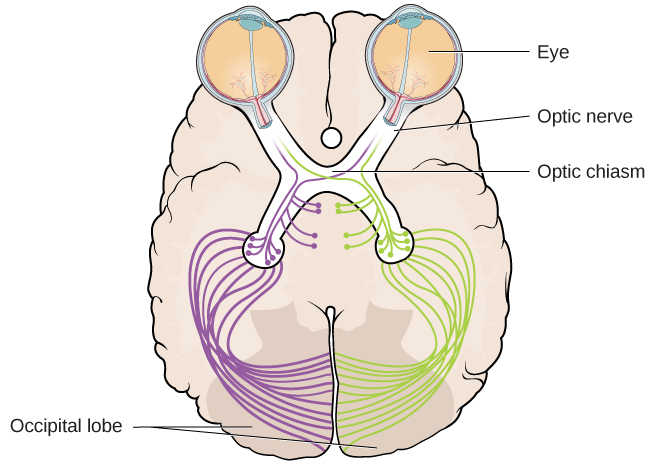
An illustration shows the location of the occipital lobe, optic chiasm, optic nerve, and the eyes in relation to their position in the brain and head.
Figure 5.13 — 5.3 Vision

Figure 5.13 This illustration shows the optic chiasm at the front of the brain and the pathways to the occipital lobe at the back of the brain, where visual sensations are processed into meaningful perceptions.

Rose M. Spielman, William J. Jenkins, and Marilyn D. Lovett, Psychology 2E, OpenStax. · CC BY-NC-SA 4.0 · Original image ↗ · Access for free ↗
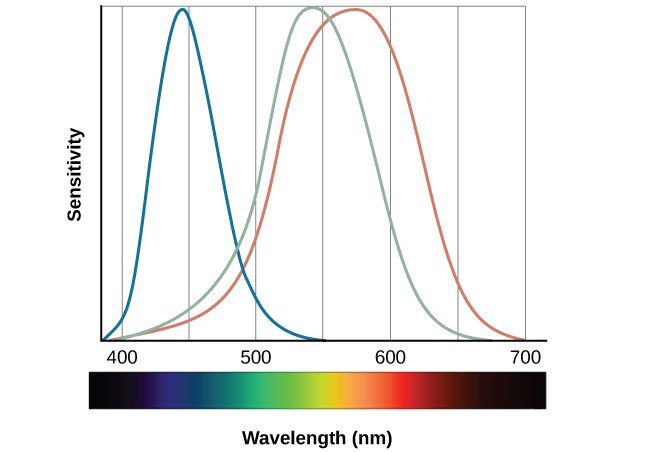
A graph is shown with “sensitivity” plotted on the y-axis and “Wavelength” in nanometers plotted along the x-axis with measurements of 400, 500, 600, and 700. Three lines in different colors move from the base to the peak of the y axis, and back to the base. The blue line begins at 400 nm and hits its peak of sensitivity around 455 nanometers, before the sensitivity drops off at roughly the same rate at which it increased, returning to the lowest sensitivity around 530 nm . The green line begins at 400 nm and reaches its peak of sensitivity around 535 nanometers. Its sensitivity then decreases at roughly the same rate at which it increased, returning to the lowest sensitivity around 650 nm. The red line follows the same pattern as the first two, beginning at 400 nm, increasing and decreasing at the same rate, and it hits its height of sensitivity around 580 nanometers. Below this graph is a horizontal bar showing the colors of the visible spectrum.
Figure 5.14 — 5.3 Vision

Figure 5.14 This figure illustrates the different sensitivities for the three cone types found in a normal-sighted individual. (credit: modification of work by Vanessa Ezekowitz)

Rose M. Spielman, William J. Jenkins, and Marilyn D. Lovett, Psychology 2E, OpenStax. (credit: modification of work by Vanessa Ezekowitz) · CC BY-NC-SA 4.0 · Original image ↗ · Access for free ↗
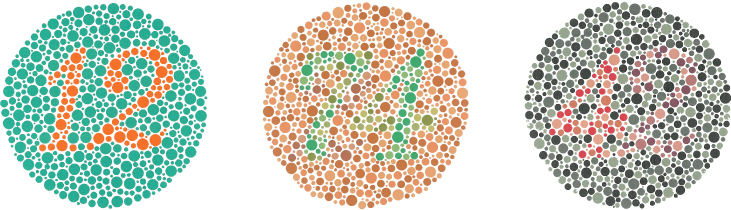
The figure includes three large circles that are made up of smaller circles of varying shades and sizes. Inside each large circle is a number that is made visible only by its different color. The first circle has an orange number 12 in a background of green. The second color has a green number 74 in a background of orange. The third circle has a red and brown number 42 in a background of black and gray.
Figure 5.15 — 5.3 Vision

Figure 5.15 The Ishihara test evaluates color perception by assessing whether individuals can discern numbers that appear in a circle of dots of varying colors and sizes.

Rose M. Spielman, William J. Jenkins, and Marilyn D. Lovett, Psychology 2E, OpenStax. · CC BY-NC-SA 4.0 · Original image ↗ · Access for free ↗

An illustration shows a green flag with a thick, black-bordered yellow lines meeting slightly to the left of the center. A small white dot sits within the yellow space in the exact center of the flag.
Figure 5.16 — 5.3 Vision

Figure 5.16 Stare at the white dot for 30–60 seconds and then move your eyes to a blank piece of white paper. What do you see? This is known as a negative afterimage, and it provides empirical support for the opponent-process theory of color vision.

Rose M. Spielman, William J. Jenkins, and Marilyn D. Lovett, Psychology 2E, OpenStax. · CC BY-NC-SA 4.0 · Original image ↗ · Access for free ↗

A photograph shows an empty road that continues toward the horizon.
Figure 5.17 — 5.3 Vision

Figure 5.17 We perceive depth in a two-dimensional figure like this one through the use of monocular cues like linear perspective, like the parallel lines converging as the road narrows in the distance. (credit: Marc Dalmulder)

Rose M. Spielman, William J. Jenkins, and Marilyn D. Lovett, Psychology 2E, OpenStax. (credit: Marc Dalmulder) · CC BY-NC-SA 4.0 · Original image ↗ · Access for free ↗

Source: 5.3 Vision
175 terms, alphabetically ordered

3′ end · ·

The end of a nucleic- strand associated with the sugar’s 3′ position. extends a strand at a free .

Read explanation · OpenStax ↗
3′ hydroxyl group · · ·

The at the sugar’s 3′ carbon that attacks the incoming ’s during strand extension.

Read explanation · OpenStax ↗
A site · ·

The site that accepts most incoming during elongation and at termination.

Read explanation · OpenStax ↗
Acid · ·

In the Brønsted–Lowry model, a substance that can donate a . Acidic have a higher activity than water.

Read explanation · OpenStax ↗
action potential

A regenerative -voltage change produced by voltage-dependent -channel activity.

Read explanation · OpenStax ↗
Activation energy ·

The energy barrier that must overcome to reach a and undergo .

Read explanation · OpenStax ↗
Adenosine triphosphate

An energy-carrying ; its powers many cellular processes, including cycles.

Read explanation · OpenStax ↗
Alpha carbon · ·

The central carbon next to the carboxyl carbon. In a standard it binds an , hydrogen, and .

Read explanation · OpenStax ↗
Alpha helix · · · · · ·

A helical stabilized by between a oxygen and an hydrogen four later.

Read explanation · OpenStax ↗
Amide · · ·

A group containing a carbon bonded to nitrogen. are amide linkages.

Read explanation · OpenStax ↗
Amino acid

A building block containing amino and and a characteristic .

Read explanation · OpenStax ↗
Amino acid residue · ·

The part of an incorporated into a chain. Residue can also describe another building block within a larger .

Read explanation · OpenStax ↗
Amino group · · ·

A nitrogen-containing . A free ’s amino group is typically (NH₃⁺) near physiological ; ’s ring nitrogen is an exception to this formula.

Read explanation · OpenStax ↗
Aminoacyl-tRNA · ·

A covalently linked to an at its , ready to deliver that during .

Read explanation · OpenStax ↗
Amphipathic

Having both a region and a region, as in a or .

Read explanation · OpenStax ↗
Analytical standard ·

A material with a known identity or amount used to compare or calibrate measurements.

Read explanation · Agilent ↗
Anode

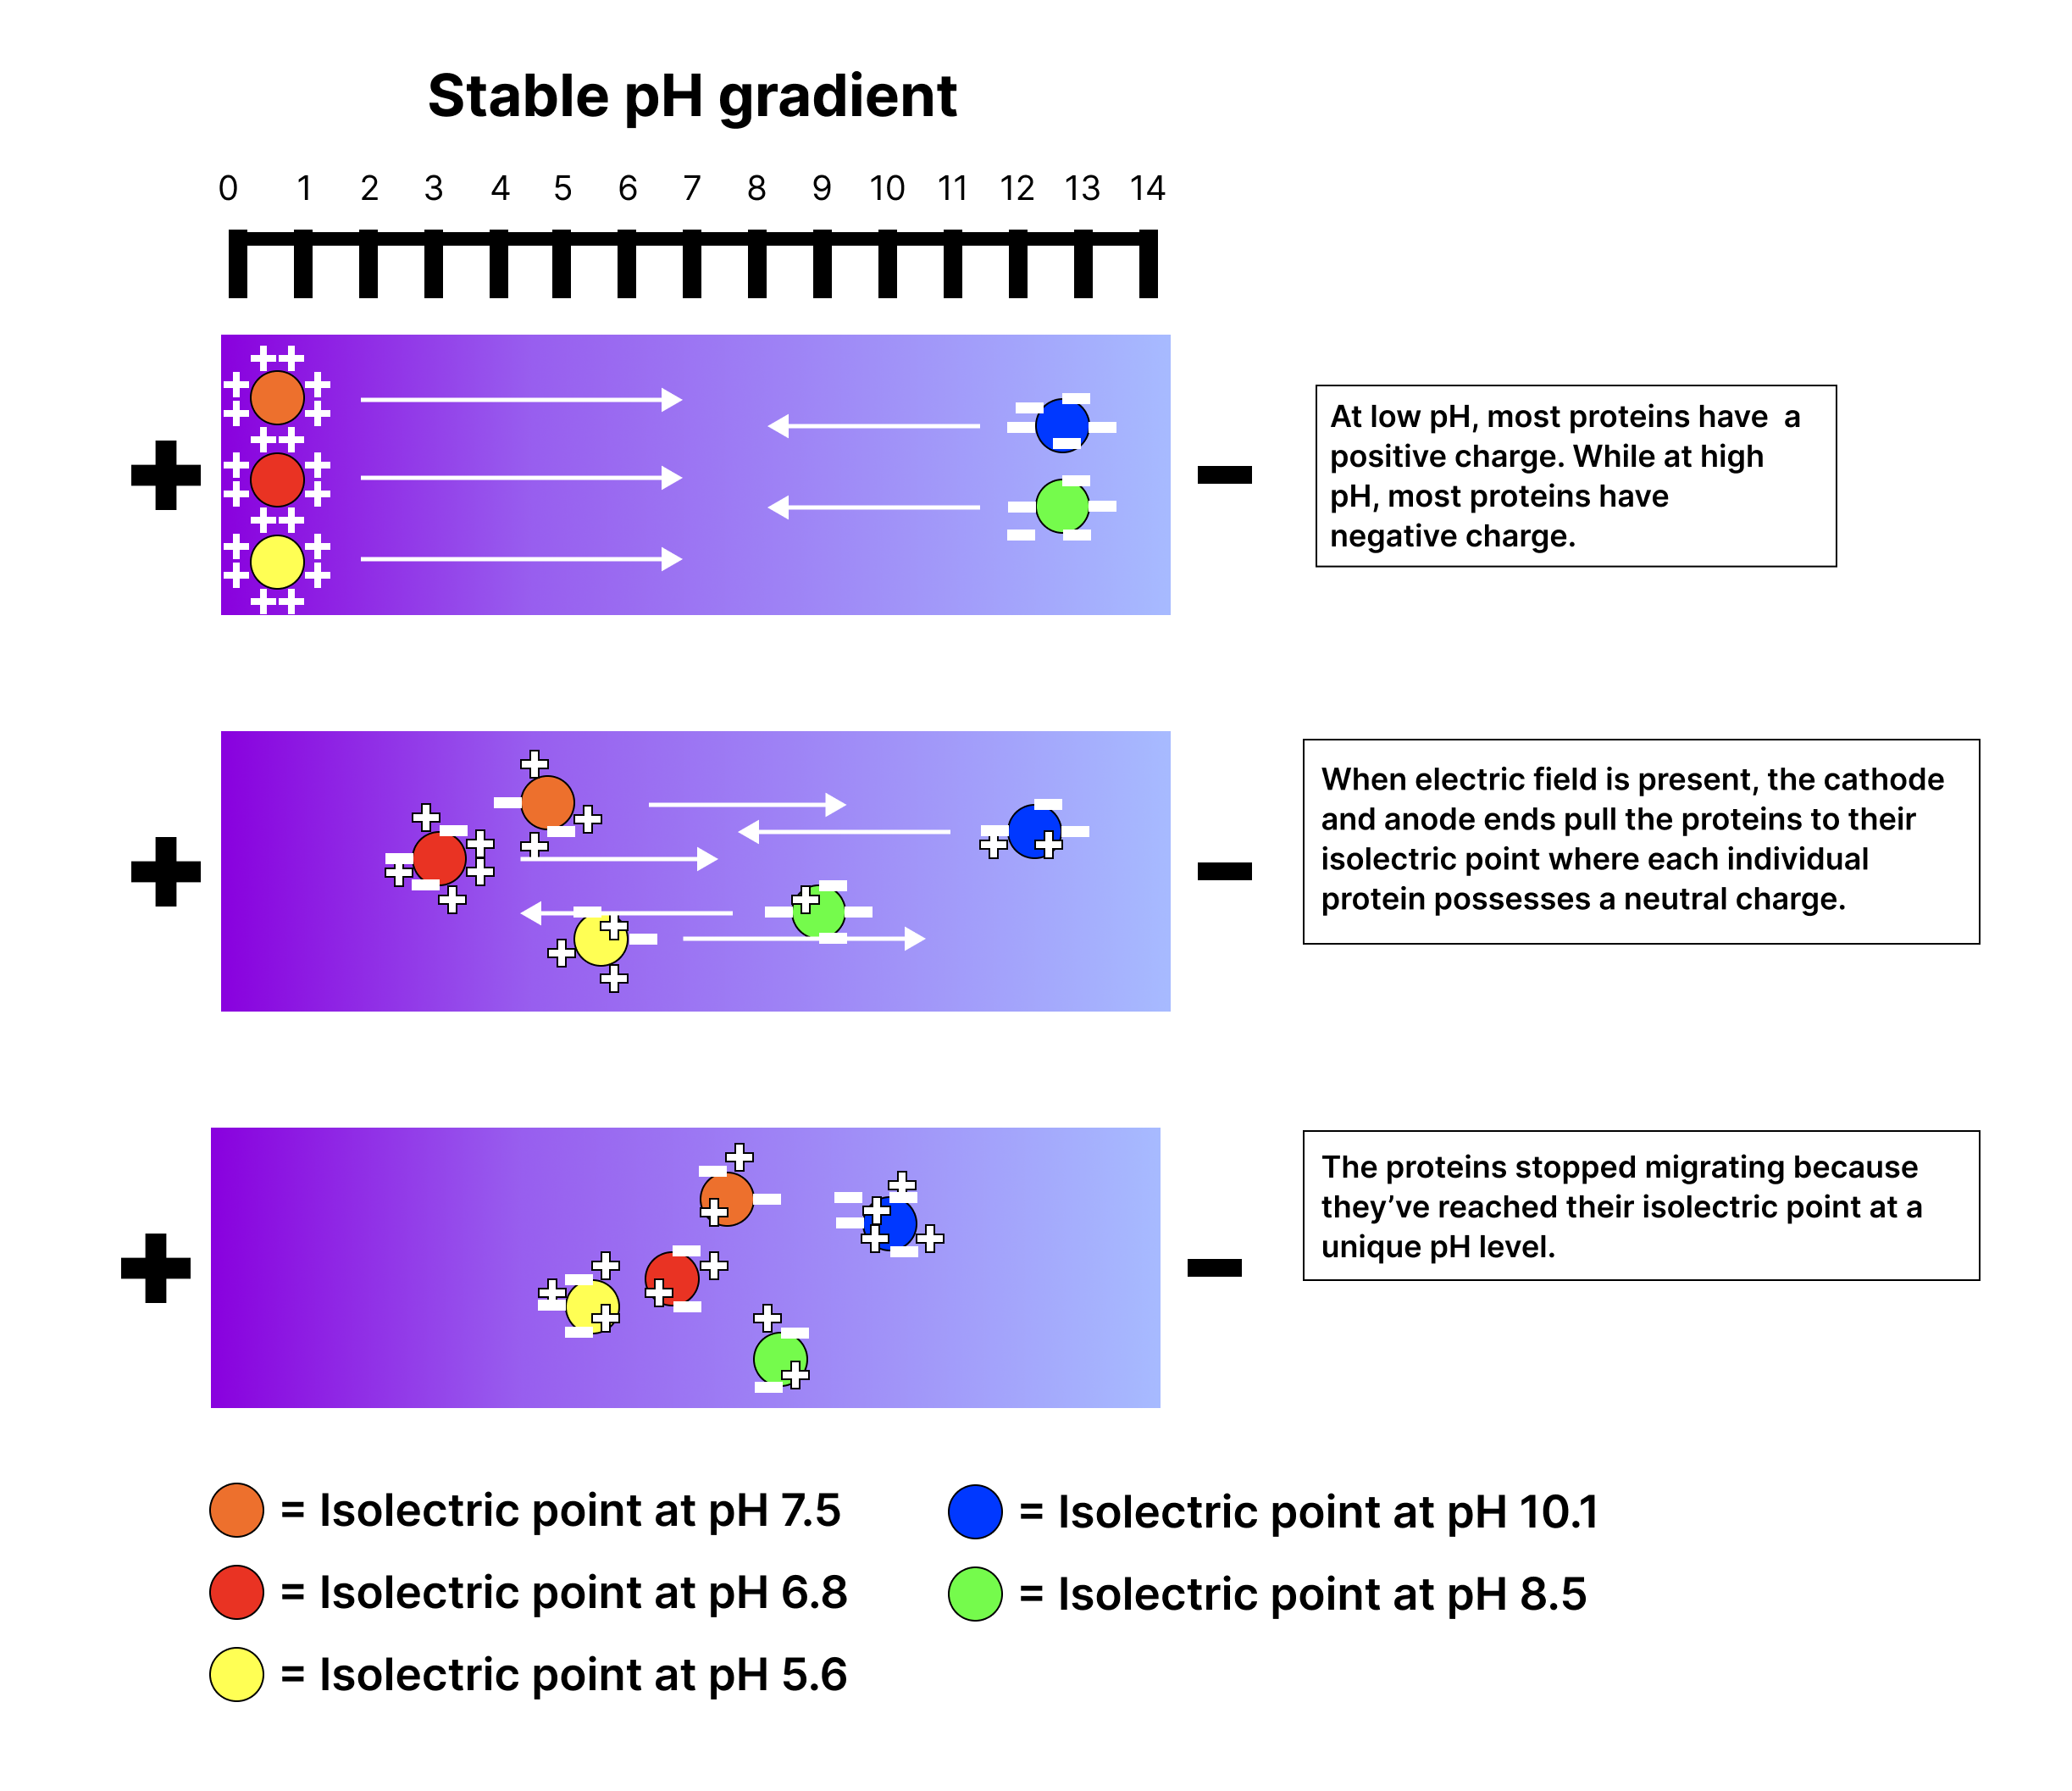
The positive in an apparatus; negatively migrate toward it.

Read explanation · Thermo Fisher ↗
Anticodon

A triplet that pairs to an . The anticodon for 5′-AUG-3′ is aligned 3′-UAC-5′, or written 5′-CAU-3′.

Read explanation · NCBI Bookshelf / Garland Science ↗
Antiparallel

Running in opposite directions, as with two strands or neighboring strands in some .

Read explanation · OpenStax ↗
Aqueous solution ·

A in which water is the .

Read explanation · OpenStax ↗
Archaea ·

A of distinct from , with characteristic chemistry and -expression machinery.

Read explanation · OpenStax ↗
Aromatic

Containing a cyclic, with . , , and have aromatic .

Read explanation · OpenStax ↗
Atom

The smallest unit of an element that retains its chemical identity; it has a surrounded by .

Read explanation · OpenStax ↗
axon

Neuronal process that usually conducts toward terminals.

Read explanation · OpenStax ↗
Bacteria ·

A of single-celled . Bacterial cells lack a -bound and are distinct from .

Read explanation · OpenStax ↗
bacteriophage · ·

A virus that infects .

Read explanation · OpenStax ↗
Benzene ring

A six-carbon ring with .

Read explanation · OpenStax ↗
Benzyl group

A attached through a –CH₂– group; part of ’s .

Read explanation · OpenStax ↗
Beta sheet · · · · · ·

A made of aligned segments connected by ; strands may be parallel or .

Read explanation · OpenStax ↗
binocular disparity

Difference between the two eyes’ retinal images used as a depth cue.

Read explanation · OpenStax ↗
Biomolecule

A made by or involved in living systems, including , , , and .

Read explanation · OpenStax ↗
bipolar cell

Retinal class relaying signals between photoreceptors and ganglion-cell circuits.

Read explanation · OpenStax ↗
Blotting ·

Transfer of separated or to a so a specific target can be detected.

Read explanation · Thermo Fisher ↗
Brønsted–Lowry base · · · · · · · · · · ·

In the Brønsted–Lowry model, a substance that can accept a . Basic solutions have lower activity than water.

Read explanation · OpenStax ↗
Calibration

Establishing the relation between a measured signal and known values or .

Read explanation · Agilent ↗
Carbohydrate

A class of including sugars and their , used for energy storage, structure, and recognition.

Read explanation · OpenStax ↗
Carbonyl group · ·

A carbon double-bonded to oxygen, C=O; present in and many other .

Read explanation · OpenStax ↗
Carboxyl group · ·

An , COOH. In free it is usually to COO⁻ near physiological .

Read explanation · OpenStax ↗
Catalyst · ·

A substance that speeds a by providing a pathway with lower and is regenerated rather than consumed overall.

Read explanation · OpenStax ↗
Cathode

The negative in an apparatus; positively migrate toward it.

Read explanation · Thermo Fisher ↗
Cation ·

An with a positive net .

Read explanation · OpenStax ↗
Chemical compound ·

A substance containing of two or more different chemically combined in a definite composition.

Read explanation · OpenStax ↗
Chemical element

A substance defined by having the same number of , such as carbon or oxygen.

Read explanation · OpenStax ↗
Chemical reaction ·

A process that rearranges and chemical bonds, converting into .

Read explanation · OpenStax ↗
Chromatin

The complex of and associated , including , in .

Read explanation · OpenStax ↗
Chromatographic peak · ·

A rise and fall in detector signal as one or more components pass through the detector; a peak does not guarantee a single pure .

Read explanation · Agilent ↗
Chromosome ·

An organized with associated that carries . A replicated chromosome has two .

Read explanation · OpenStax ↗
Codon

A sequence of three that specifies an or a stop signal.

Read explanation · OpenStax ↗
Concentration

The amount of a substance in a specified volume or mass of mixture.

Read explanation · OpenStax ↗
conductor

Material with that can move readily through it.

Read explanation · OpenStax ↗
cone photoreceptor

Retinal photoreceptor supporting color and high visual acuity.

Read explanation · OpenStax ↗
Configuration

A stereochemical arrangement that cannot be changed into another configuration by ordinary single-bond rotations alone.

Read explanation · OpenStax ↗
Conjugated system ·

Adjacent orbitals that allow to be distributed across several , often through alternating single and multiple bonds.

Read explanation · OpenStax ↗
cornea

Transparent anterior surface of the eye providing substantial refraction of incoming light.

Read explanation · OpenStax ↗
Covalent bond · ·

A bond in which share pairs. and are covalent.

Read explanation · OpenStax ↗
Cysteine ·

An with a . Two cysteines can form a .

Read explanation · OpenStax ↗
Deoxyribonucleic acid

The that stores genetic information used to specify and sequences.

Read explanation · OpenStax ↗
Deprotonation

Removal of a from a or group; this changes its by minus one.

Read explanation · OpenStax ↗
Detergent

An substance that can associate with both water and material; detergents can disrupt or interactions.

Read explanation · Thermo Fisher ↗
discrimination

Unequal treatment linked to social category or group membership.

Read explanation · OpenStax ↗
Disulfide bond · · ·

A covalent sulfur–sulfur bond formed by of two , which can stabilize structure.

Read explanation · NCBI Bookshelf ↗
DNA lesion ·

of molecular damage in . A lesion can cause a if it is copied or repaired incorrectly, but damage and sequence change are distinct.

Read explanation · OpenStax ↗
DNA polymerase ·

An that synthesizes 5′ to 3′ using a template and a with a free .

Read explanation · OpenStax ↗
DNA replication

Copying so genetic information can be passed to daughter cells. Each guides a complementary new strand.

Read explanation · OpenStax ↗
dorsal visual stream

Visual processing pathway important for spatial processing and guiding action.

Read explanation · OpenStax ↗
Electric charge · · ·

An electrical property that can be positive or negative. Opposite charges attract and like charges repel; net charge is the sum of all charges on a particle.

Read explanation · OpenStax ↗
Electric field

A quantity describing the electrical force per unit positive . An applied field drives through a gel during .

Read explanation · Thermo Fisher ↗
Electrode

A that connects an electrical circuit to a or other medium; the and are electrodes.

Read explanation · Thermo Fisher ↗
Electron

A negatively subatomic particle. Electron sharing and transfer determine much of chemical bonding.

Read explanation · OpenStax ↗
Electron delocalization ·

Distribution of across several rather than confinement to one or bond.

Read explanation · OpenStax ↗
Electronegativity ·

An ’s tendency to attract shared in a chemical bond. Unequal attraction can make a bond .

Read explanation · OpenStax ↗
Electrophoresis

Movement of in an , used to separate through a support such as a gel.

Read explanation · Thermo Fisher ↗
Enzyme

A biological that speeds a without being consumed. Most enzymes are .

Read explanation · OpenStax ↗
Eukaryote ·

An organism whose cells have a -enclosed ; animals, plants, fungi, and protists are eukaryotes.

Read explanation · OpenStax ↗
FACT complex ·

A -associated complex that helps machinery traverse and supports reorganization.

Read explanation · OpenStax ↗
fovea

Central retinal region densely packed with and specialized for detailed vision.

Read explanation · OpenStax ↗
Functional group

A group of whose chemical behavior gives a characteristic and properties.

Read explanation · OpenStax ↗
ganglion cell

Retinal output whose contributes to the optic nerve.

Read explanation · OpenStax ↗
Gene

A sequence that contributes to a functional or , together with the information needed to express it.

Read explanation · OpenStax ↗
Gene expression

Production of a functional from a , including and, for -coding , .

Read explanation · NCBI Bookshelf ↗
Glutamate · ·

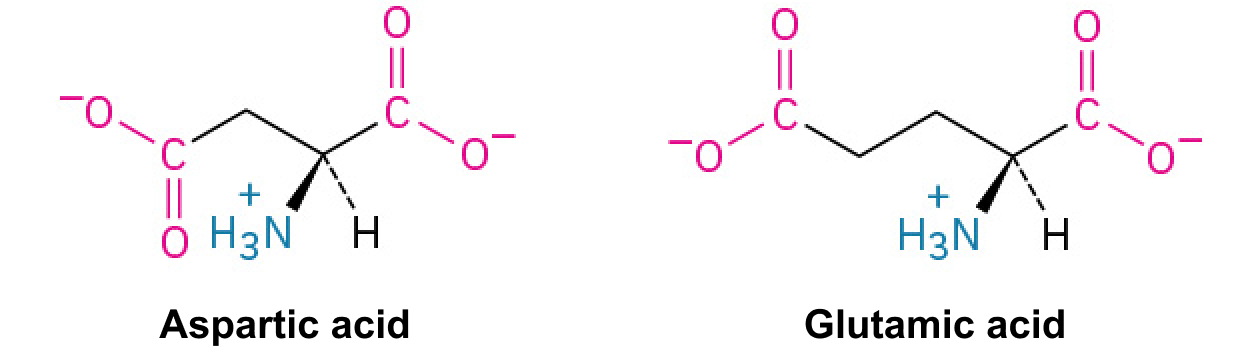
An whose is usually negatively near physiological .

Read explanation · OpenStax ↗
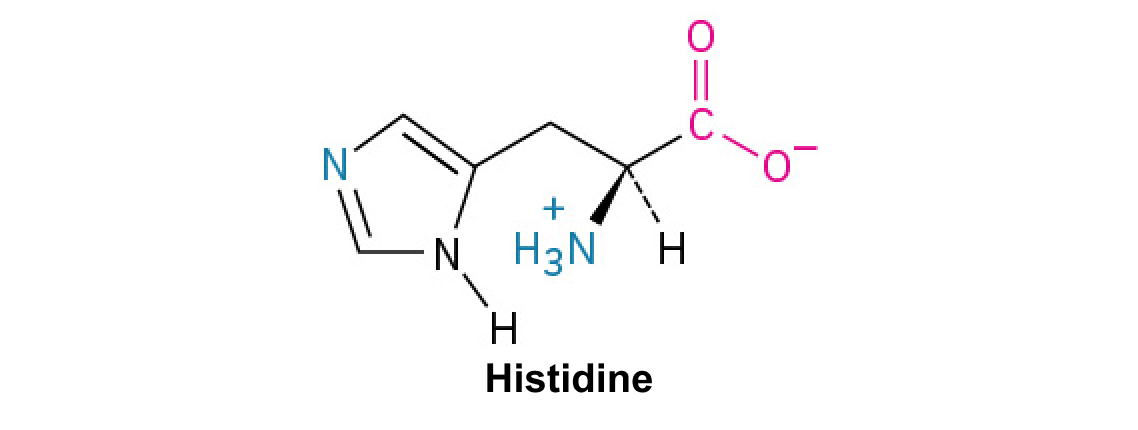
Histidine ·

A with an . Mostly uncharged near physiological , it can accept or donate .

Read explanation · OpenStax ↗
Histone

A -associated rich in . Core histones form the around which nucleosomal wraps.

Read explanation · OpenStax ↗
Hydrogen bond ·

An attraction between a hydrogen bonded to an and another . hydrogen bonds stabilize .

Read explanation · OpenStax ↗
Hydrogen ion · ·

A positively hydrogen species. H⁺ denotes a , which is hydrated in water; its activity determines .

Read explanation · OpenStax ↗
Hydrolysis

Breaking a chemical bond by adding water. hydrolysis separates .

Read explanation · OpenStax ↗
Hydrophilic

Interacting favorably with water, typically because a group is or .

Read explanation · OpenStax ↗
Hydrophobic

Interacting poorly with water. often gather in a ’s interior.

Read explanation · OpenStax ↗
Hydroxide ion ·

The negatively OH⁻. Basic contain a higher hydroxide ion activity than water at the same temperature.

Read explanation · OpenStax ↗
Hydroxyl group ·

An oxygen bonded to hydrogen, –OH. Hydroxyl groups can and often increase .

Read explanation · OpenStax ↗
Imidazole

A five-membered ring containing two nitrogens; ’s contains this ring.

Read explanation · OpenStax ↗
Indole

A fused six-membered and five-membered ring system containing nitrogen; found in .

Read explanation · OpenStax ↗
Ion · ·

An or with a net because its numbers of and do not balance.

Read explanation · OpenStax ↗
iris

Pigmented muscular structure controlling pupil size.

Read explanation · OpenStax ↗
lateral geniculate nucleus

Thalamic relay carrying major visual signals to primary visual cortex.

Read explanation · OpenStax ↗
linkage

A tendency of nearby on the same to be inherited together.

Read explanation · OpenStax ↗
Lipid

A broad class of largely or , including fats, , and steroids.

Read explanation · OpenStax ↗
locus

The specific position of a or other feature.

Read explanation · OpenStax ↗
Logarithm · · ·

The exponent needed to obtain a number from a chosen fixed number. For decimal logarithms, log₁₀(100) = 2 because 10² = 100; uses the negative decimal logarithm of activity.

Read explanation · OpenStax ↗
magnetic resonance imaging

Imaging method using magnetic fields and radiofrequency signals to reveal tissue structure.

Read explanation · OpenStax ↗
Mass spectrometry ·

Analysis of according to their mass-to- ratios, used to identify and or .

Read explanation · Thermo Fisher ↗
Mass-to-charge ratio

The mass of an divided by its number; this is the quantity measured by a .

Read explanation · Thermo Fisher ↗
Membrane · · · ·

A thin boundary or sheet. Cell membranes are bilayers containing ; membranes are synthetic supports that hold or for detection.

Read explanation · OpenStax ↗
Messenger RNA ·

An that carries coding information used by to synthesize a .

Read explanation · OpenStax ↗
Molecular chaperone · ·

A that assists other in folding or prevents , without specifying their sequence.

Read explanation · NCBI Bookshelf ↗
Molecule

Two or more joined by . A molecule may be electrically or carry a .

Read explanation · OpenStax ↗
Mutation

A change in a sequence; some mutations alter a ’s sequence.

Read explanation · OpenStax ↗
neuron

An electrically excitable cell specialized for receiving and transmitting information.

Read explanation · OpenStax ↗
Neutral

Having no net . For a , neutral instead means equal and activities; its is about 7 at 25 °C.

Read explanation · OpenStax ↗
Nitrogenous base · · ·

A nitrogen-containing ring component of ; its pairing interactions help specify sequences.

Read explanation · OpenStax ↗
Nonpolar ·

Lacking a substantial separation of . Nonpolar groups generally interact poorly with water.

Read explanation · OpenStax ↗
Nucleic acid

A of , such as or , used in information storage, expression, and other cellular functions.

Read explanation · OpenStax ↗
Nucleosome

The basic unit of : wrapped around a .

Read explanation · OpenStax ↗
Nucleotide

A joined to a sugar and one or more .

Read explanation · OpenStax ↗
Nucleus ·

A -enclosed compartment containing most of a cell’s .

Read explanation · OpenStax ↗
Octamer

A complex made of eight . A core contains eight .

Read explanation · OpenStax ↗
opponent-process color theory

Account in which color is encoded through opposing response channels.

Read explanation · OpenStax ↗
opsin

component of a visual pigment that combines with retinal and initiates light-sensitive signaling.

Read explanation · OpenStax ↗
optic chiasm

Junction where axons from nasal halves of the retinas cross.

Read explanation · OpenStax ↗
optic disc

Retinal region where the optic nerve exits and photoreceptors are absent.

Read explanation · OpenStax ↗
Optical accommodation ·

Adjustment of the eye’s lens to focus at different distances.

Read explanation · OpenStax ↗
Oxidation ·

Loss of or an increase in oxidation state. Oxidizing two can form a .

Read explanation · OpenStax ↗
Peptide

A chain of joined by ; the term commonly describes chains shorter than a typical .

Read explanation · OpenStax ↗
Peptide bond ·

A covalent between the carboxyl carbon of one and the amino nitrogen of the next.

Read explanation · OpenStax ↗
pH

A measure of , defined as the negative of activity. Lower pH means greater ; pH influences .

Read explanation · OpenStax ↗
Phenylalanine ·

A with an .

Read explanation · OpenStax ↗
Phosphate group ·

A phosphorus-containing group bonded to oxygens; phosphate groups occur in , , and modified .

Read explanation · OpenStax ↗
Phospholipid

An with a -containing region and tails; a major component of cellular .

Read explanation · OpenStax ↗
photon

Quantum of electromagnetic radiation with energy hf.

Read explanation · OpenStax ↗
Polar

Having an uneven distribution of . Polar groups often interact favorably with water.

Read explanation · OpenStax ↗
Polymer

A large made from many linked molecular building blocks.

Read explanation · OpenStax ↗
Polypeptide

A chain of connected by . A functional can contain one or several such chains.

Read explanation · OpenStax ↗
Primer · ·

A short nucleic- strand paired with a template that provides a free for polymerase extension.

Read explanation · OpenStax ↗
Prokaryote ·

An organism whose cells lack a -bound ; and are prokaryotes.

Read explanation · OpenStax ↗
Proline ·

An whose loops back to the nitrogen, restricting rotation and often creating bends.

Read explanation · OpenStax ↗
Protein

One or more folded chains that perform biological roles such as , transport, signaling, or structural support.

Read explanation · OpenStax ↗
Protein aggregation · ·

Association of into larger clusters, often when exposed surfaces of unfolded stick together.

Read explanation · NCBI Bookshelf ↗
Protein backbone ·

The repeating nitrogen–alpha-carbon– chain of a , excluding its variable .

Read explanation · OpenStax ↗
Protein domain · ·

A region of a that forms a recognizable structural or functional unit.

Read explanation · OpenStax ↗
Proton

A positively subatomic particle. In – chemistry, donating a proton means transferring a .

Read explanation · OpenStax ↗
Protonation

Addition of a to an , , or ; this changes its by plus one.

Read explanation · OpenStax ↗
Quantification · ·

Estimating the amount or of a substance from measured signals and suitable or .

Read explanation · Waters ↗
R group · ·

The variable side chain attached to an ’s . It determines identity, , , and chemical behavior.

Read explanation · OpenStax ↗
Reactant

A starting substance transformed during a .

Read explanation · OpenStax ↗
Reaction intermediate · ·

A species formed in one step and consumed in another. It occupies a local energy minimum between .

Read explanation · OpenStax ↗
Reaction product ·

A substance formed by a .

Read explanation · OpenStax ↗
Receptor

A that recognizes a particular signal and helps produce a cellular response.

Read explanation · OpenStax ↗
Release factor ·

A that recognizes a stop signal and promotes of the – to release the .

Read explanation · OpenStax ↗
reliability

Consistency or reproducibility of a measurement under specified conditions.

Read explanation · OpenStax ↗
retinal chromophore

Light-sensitive vitamin-A-derived component of visual pigments that changes after absorption.

Read explanation · OpenStax ↗
Ribonucleic acid ·

A with roles in , regulation, and ; carries -coding information.

Read explanation · OpenStax ↗
Ribosome ·

A complex of and that translates into a .

Read explanation · OpenStax ↗
rod photoreceptor

Retinal photoreceptor especially sensitive in dim light.

Read explanation · OpenStax ↗
Secondary structure

Local folding, such as and , stabilized mainly by .

Read explanation · OpenStax ↗
Separation resolution

A measure of how distinctly neighboring components or are separated.

Read explanation · Cytiva ↗
Sister chromatid

One of the two copies of a produced by . An intact sister chromatid can supply a template for accurate repair.

Read explanation · Biology LibreTexts / Oregon State University ↗
social power

Capacity to influence outcomes or act despite resistance.

Read explanation · OpenStax ↗
Solubility ·

The amount of a substance that can dissolve in a under specified conditions. Soluble means able to dissolve; insoluble means only very slightly soluble in that .

Read explanation · OpenStax ↗
Solute

A dissolved component of a .

Read explanation · OpenStax ↗
Solution

A homogeneous mixture in which are dissolved in a .

Read explanation · OpenStax ↗
Solvent

The component of a that dissolves other substances, usually the component present in the greatest amount.

Read explanation · OpenStax ↗
Spectrum ·

A distribution of measured signal over a variable such as or .

Read explanation · Thermo Fisher ↗
stem cell

A cell capable of self-renewal and production of differentiating descendants.

Read explanation · OpenStax ↗
Subunit ·

An individual chain within a containing multiple chains.

Read explanation · OpenStax ↗
Template strand · · ·

A preexisting strand whose sequence guides complementary nucleic- synthesis.

Read explanation · OpenStax ↗
Thiol group · · · ·

A sulfur bonded to hydrogen, –SH. thiols can form through .

Read explanation · OpenStax ↗
Transcription

Synthesis of using a template.

Read explanation · OpenStax ↗
transduction

Transfer of mediated by a .

Read explanation · OpenStax ↗
Transfer RNA ·

An adaptor that carries an and pairs its with a on .

Read explanation · OpenStax ↗
Transition state

A fleeting, high-energy arrangement at a barrier. It is an energy maximum along the path, rather than a stable .

Read explanation · OpenStax ↗
Translation ·

Synthesis of a on a using the sequence of in .

Read explanation · OpenStax ↗
Tryptophan ·

An with a bulky ; commonly grouped as .

Read explanation · OpenStax ↗
Tyrosine ·

An with a phenolic . Usually uncharged near physiological .

Read explanation · OpenStax ↗
ventral visual stream

Visual processing pathway important for recognizing objects.

Read explanation · OpenStax ↗
Wavelength

The distance between repeating points of a wave, such as neighboring crests; light wavelength determines energy.

Read explanation · JASCO ↗

5.3 Vision

OpenStax · 5.3 Vision ↗

Instructional page including learning objectives, examples, figures, source tables and questions. Site navigation and embedded media players are omitted; source media links remain available.

Learning Objectives

By the end of this section, you will be able to:

  • Describe the basic anatomy of the visual system
  • Discuss how and contribute to different aspects of vision
  • Describe how monocular and binocular cues are used in the perception of depth

The visual system constructs a mental representation of the world around us (Figure 5.10). This contributes to our ability to successfully navigate through physical space and interact with important individuals and objects in our environments. This section will provide an overview of the basic anatomy and function of the visual system. In addition, we will explore our ability to perceive color and depth.

Several photographs of peoples’ eyes are shown.
Figure 5.10 — 5.3 Vision
Figure 5.10 Our eyes take in sensory information that helps us understand the world around us. (credit "top left”: modification of work by "rajkumar1220"/Flickr"; credit “top right”: modification of work by Thomas Leuthard; credit “middle left”: modification of work by Demietrich Baker; credit “middle right”: modification of work by "kaybee07"/Flickr; credit “bottom left”: modification of work by "Isengardt"/Flickr; credit “bottom right”: modification of work by Willem Heerbaart)

Rose M. Spielman, William J. Jenkins, and Marilyn D. Lovett, Psychology 2E, OpenStax. (credit "top left”: modification of work by "rajkumar1220"/Flickr"; credit “top right”: modification of work by Thomas Leuthard; credit “middle left”: modification of work by Demietrich Baker; credit “middle right”: modification of work by "kaybee07"/Flickr; credit “bottom left”: modification of work by "Isengardt"/Flickr; credit “bottom right”: modification of work by Willem Heerbaart) · CC BY-NC-SA 4.0 · Original image ↗ · Access for free ↗

Anatomy of the Visual System

The eye is the major sensory organ involved in vision (Figure 5.11). Light waves are transmitted across the and enter the eye through the pupil. The is the transparent covering over the eye. It serves as a barrier between the inner eye and the outside world, and it is involved in focusing light waves that enter the eye. The pupil is the small opening in the eye through which light passes, and the size of the pupil can change as a function of light levels as well as emotional arousal. When light levels are low, the pupil will become dilated, or expanded, to allow more light to enter the eye. When light levels are high, the pupil will constrict, or become smaller, to reduce the amount of light that enters the eye. The pupil’s size is controlled by muscles that are connected to the , which is the colored portion of the eye.

Different parts of the eye are labeled in this illustration. The cornea, pupil, iris, and lens are situated toward the front of the eye, and at the back are the optic nerve, fovea, and retina.
Figure 5.11 — 5.3 Vision

Figure 5.11 The anatomy of the eye is illustrated in this diagram.

Rose M. Spielman, William J. Jenkins, and Marilyn D. Lovett, Psychology 2E, OpenStax. · CC BY-NC-SA 4.0 · Original image ↗ · Access for free ↗

After passing through the pupil, light crosses the lens, a curved, transparent structure that serves to provide additional focus. The lens is attached to muscles that can change its shape to aid in focusing light that is reflected from near or far objects. In a normal-sighted individual, the lens will focus images perfectly on a small indentation in the back of the eye known as the , which is part of the retina, the light-sensitive lining of the eye. The contains densely packed specialized photoreceptor cells (Figure 5.12). These photoreceptor cells, known as , are light-detecting cells. The are specialized types of photoreceptors that work best in bright light conditions. are very sensitive to acute detail and provide tremendous spatial . They are also directly involved in our ability to perceive color.

While are concentrated in the , where images tend to be focused, , another type of photoreceptor, are located throughout the remainder of the retina. are specialized photoreceptors that work well in low light conditions, and while they lack the spatial and color function of the , they are involved in our vision in dimly lit environments as well as in our perception of movement on the periphery of our visual field.

Different parts of the eye are labeled in the left side of this illustration. The cornea, pupil, iris, and lens are situated toward the front of the eye, and at the back are the optic nerve, fovea, and retina. The illustration on the right is a close-up of the layers of the eye. It shows light reaching the optic nerve, beneath which are Ganglion cells, and then rods and cones.
Figure 5.12 — 5.3 Vision

Figure 5.12 The two types of photoreceptors are shown in this image. Cones are colored green and rods are blue.

Rose M. Spielman, William J. Jenkins, and Marilyn D. Lovett, Psychology 2E, OpenStax. · CC BY-NC-SA 4.0 · Original image ↗ · Access for free ↗

Most of us have experienced the different sensitivities of and when making the transition from a brightly lit environment to a dimly lit environment. Imagine going to see a blockbuster movie on a clear summer day. As you walk from the brightly lit lobby into the dark theater, you notice that you immediately have difficulty seeing much of anything. After a few minutes, you begin to adjust to the darkness and can see the interior of the theater. In the bright environment, your vision was dominated primarily by cone activity. As you move to the dark environment, rod activity dominates, but there is a delay in transitioning between the phases. If your do not transform light into nerve impulses as easily and efficiently as they should, you will have difficulty seeing in dim light, a condition known as night blindness.

and are connected (via several interneurons) to retinal . Axons from the retinal converge and exit through the back of the eye to form the optic nerve. The optic nerve carries visual information from the retina to the brain. There is a point in the visual field called the blind spot: Even when light from a small object is focused on the blind spot, we do not see it. We are not consciously aware of our blind spots for two reasons: First, each eye gets a slightly different view of the visual field; therefore, the blind spots do not overlap. Second, our visual system fills in the blind spot so that although we cannot respond to visual information that occurs in that portion of the visual field, we are also not aware that information is missing.

The optic nerve from each eye merges just below the brain at a point called the . As Figure 5.13 shows, the is an X-shaped structure that sits just below the cerebral cortex at the front of the brain. At the point of the , information from the right visual field (which comes from both eyes) is sent to the left side of the brain, and information from the left visual field is sent to the right side of the brain.

An illustration shows the location of the occipital lobe, optic chiasm, optic nerve, and the eyes in relation to their position in the brain and head.
Figure 5.13 — 5.3 Vision
Figure 5.13 This illustration shows the optic chiasm at the front of the brain and the pathways to the occipital lobe at the back of the brain, where visual sensations are processed into meaningful perceptions.

Rose M. Spielman, William J. Jenkins, and Marilyn D. Lovett, Psychology 2E, OpenStax. · CC BY-NC-SA 4.0 · Original image ↗ · Access for free ↗

Once inside the brain, visual information is sent via a number of structures to the occipital lobe at the back of the brain for processing. Visual information might be processed in parallel pathways which can generally be described as the “what pathway” and the “where/how” pathway. The “what pathway” is involved in object recognition and identification, while the “where/how pathway” is involved with location in space and how one might interact with a particular visual stimulus (Milner & Goodale, 2008; Ungerleider & Haxby, 1994). For example, when you see a ball rolling down the street, the “what pathway” identifies what the object is, and the “where/how pathway” identifies its location or movement in space.

What Do You Think?

The Ethics of Research Using Animals

David Hubel and Torsten Wiesel were awarded the Nobel Prize in Medicine in 1981 for their research on the visual system. They collaborated for more than twenty years and made significant discoveries about the neurology of visual perception (Hubel & Wiesel, 1959, 1962, 1963, 1970; Wiesel & Hubel, 1963). They studied animals, mostly cats and monkeys. Although they used several techniques, they did considerable single unit recordings, during which tiny were inserted in the animal’s brain to determine when a single cell was activated. Among their many discoveries, they found that specific brain cells respond to lines with specific orientations (called ocular dominance), and they mapped the way those cells are arranged in areas of the visual cortex known as columns and hypercolumns.

In some of their research, they sutured one eye of newborn kittens closed and followed the development of the kittens' vision. They discovered there was a critical period of development for vision. If kittens were deprived of input from one eye, other areas of their visual cortex filled in the area that was normally used by the eye that was sewn closed. In other words, neural connections that exist at birth can be lost if they are deprived of sensory input.

What do you think about sewing a kitten's eye closed for research? To many animal advocates, this would seem brutal, abusive, and unethical. What if you could do research that would help ensure babies and children born with certain conditions could develop full vision instead of becoming blind? Would you want that research done? Would you conduct that research, even if it meant causing some harm to cats? Would you think the same way if you were the parent of such a child? What if you worked at the animal shelter?
Like virtually every other industrialized nation, the United States permits medical experimentation on animals, with few limitations (assuming sufficient scientific justification). The goal of any laws that exist is not to ban such tests but rather to limit unnecessary animal suffering by establishing for the humane treatment and housing of animals in laboratories.

As explained by Stephen Latham, the director of the Interdisciplinary Center for Bioethics at Yale (2012), possible legal and regulatory approaches to animal testing vary on a continuum from strong government regulation and monitoring of all experimentation at one end, to a self-regulated approach that depends on the ethics of the researchers at the other end. The United Kingdom has the most significant regulatory scheme, whereas Japan uses the self-regulation approach. The U.S. approach is somewhere in the middle, the result of a gradual blending of the two approaches.

There is no question that medical research is a valuable and important practice. The question is whether the use of animals is a necessary or even best practice for producing the most reliable results. Alternatives include the use of patient-drug databases, virtual drug trials, computer models and simulations, and noninvasive imaging techniques such as and computed tomography scans (“Animals in Science/Alternatives,” n.d.). Other techniques, such as microdosing, use humans not as test animals but as a means to improve the accuracy and of test results. In vitro methods based on human cell and tissue cultures, , and genetic testing methods are also increasingly available.

Today, at the local level, any facility that uses animals and receives federal funding must have an Institutional Animal Care and Use Committee (IACUC) that ensures that the NIH guidelines are being followed. The IACUC must include researchers, administrators, a veterinarian, and at least one person with no ties to the institution: that is, a concerned citizen. This committee also performs inspections of laboratories and protocols.

Color and Depth Perception

We do not see the world in black and white; neither do we see it as two-dimensional (2-D) or flat (just height and width, no depth). Let’s look at how color vision works and how we perceive three dimensions (height, width, and depth).

Color Vision

Normal-sighted individuals have three different types of that mediate color vision. Each of these cone types is maximally sensitive to a slightly different of light. According to the trichromatic theory of color vision, shown in Figure 5.14, all colors in the can be produced by combining red, green, and blue. The three types of are each receptive to one of the colors.

A graph is shown with “sensitivity” plotted on the y-axis and “Wavelength” in nanometers plotted along the x-axis with measurements of 400, 500, 600, and 700. Three lines in different colors move from the base to the peak of the y axis, and back to the base. The blue line begins at 400 nm and hits its peak of sensitivity around 455 nanometers, before the sensitivity drops off at roughly the same rate at which it increased, returning to the lowest sensitivity around 530 nm . The green line begins at 400 nm and reaches its peak of sensitivity around 535 nanometers. Its sensitivity then decreases at roughly the same rate at which it increased, returning to the lowest sensitivity around 650 nm. The red line follows the same pattern as the first two, beginning at 400 nm, increasing and decreasing at the same rate, and it hits its height of sensitivity around 580 nanometers. Below this graph is a horizontal bar showing the colors of the visible spectrum.


Figure 5.14 — 5.3 Vision

Figure 5.14 This figure illustrates the different sensitivities for the three cone types found in a normal-sighted individual. (credit: modification of work by Vanessa Ezekowitz)

Rose M. Spielman, William J. Jenkins, and Marilyn D. Lovett, Psychology 2E, OpenStax. (credit: modification of work by Vanessa Ezekowitz) · CC BY-NC-SA 4.0 · Original image ↗ · Access for free ↗

Connect the Concepts

Colorblindness: A Personal Story

Several years ago, I dressed to go to a public function and walked into the kitchen where my 7-year-old daughter sat. She looked up at me, and in her most stern voice, said, “You can’t wear that.” I asked, "Why not?" and she informed me the colors of my clothes did not match. She had complained frequently that I was bad at matching my shirts, pants, and ties, but this time, she sounded especially alarmed. As a single father with no one else to ask at home, I drove us to the nearest convenience store and asked the store clerk if my clothes matched. She said my pants were a bright green color, my shirt was a reddish orange, and my tie was brown. She looked at my quizzically and said, "No way do your clothes match." Over the next few days, I started asking my coworkers and friends if my clothes matched. After several days of being told that my coworkers just thought I had "a really unique style," I made an appointment with an eye doctor and was tested (Figure 5.15). It was then that I found out that I was colorblind. I cannot differentiate between most greens, browns, and reds. Fortunately, other than unknowingly being badly dressed, my colorblindness rarely harms my day-to-day life.

The figure includes three large circles that are made up of smaller circles of varying shades and sizes. Inside each large circle is a number that is made visible only by its different color. The first circle has an orange number 12 in a background of green. The second color has a green number 74 in a background of orange. The third circle has a red and brown number 42 in a background of black and gray.
Figure 5.15 — 5.3 Vision

Figure 5.15 The Ishihara test evaluates color perception by assessing whether individuals can discern numbers that appear in a circle of dots of varying colors and sizes.

Rose M. Spielman, William J. Jenkins, and Marilyn D. Lovett, Psychology 2E, OpenStax. · CC BY-NC-SA 4.0 · Original image ↗ · Access for free ↗

Some forms of color deficiency are rare. Seeing in grayscale (only shades of black and white) is extremely rare, and people who do so only have , which means they have very low visual acuity and cannot see very well. The most common X-linked inherited abnormality is red-green color blindness (Birch, 2012). Approximately 8% of males with White European descent, 5% of Asian males, 4% of African males, and less than 2% of Indigenous American males, Australian males, and Polynesian males have red-green color deficiency (Birch, 2012). Comparatively, only about 0.4% in females from White European descent have red-green color deficiency (Birch, 2012).

The trichromatic theory of color vision is not the only theory—another major theory of color vision is known as the opponent-process theory. According to this theory, color is coded in opponent pairs: black-white, yellow-blue, and green-red. The basic idea is that some cells of the visual system are excited by one of the opponent colors and inhibited by the other. So, a cell that was excited by associated with green would be inhibited by associated with red, and vice versa. One of the implications of opponent processing is that we do not experience greenish-reds or yellowish-blues as colors. Another implication is that this leads to the experience of negative afterimages. An afterimage describes the continuation of a visual sensation after removal of the stimulus. For example, when you stare briefly at the sun and then look away from it, you may still perceive a spot of light although the stimulus (the sun) has been removed. When color is involved in the stimulus, the color pairings identified in the opponent-process theory lead to a negative afterimage. You can test this concept using the flag in Figure 5.16.

An illustration shows a green flag with a thick, black-bordered yellow lines meeting slightly to the left of the center. A small white dot sits within the yellow space in the exact center of the flag.
Figure 5.16 — 5.3 Vision

Figure 5.16 Stare at the white dot for 30–60 seconds and then move your eyes to a blank piece of white paper. What do you see? This is known as a negative afterimage, and it provides empirical support for the opponent-process theory of color vision.

Rose M. Spielman, William J. Jenkins, and Marilyn D. Lovett, Psychology 2E, OpenStax. · CC BY-NC-SA 4.0 · Original image ↗ · Access for free ↗

But these two theories—the trichromatic theory of color vision and the opponent-process theory—are not mutually exclusive. Research has shown that they just apply to different levels of the nervous system. For visual processing on the retina, trichromatic theory applies: the are responsive to three different that represent red, blue, and green. But once the signal moves past the retina on its way to the brain, the cells respond in a way consistent with opponent-process theory (Land, 1959; Kaiser, 1997).

Link to Learning

Watch this video about color perception to learn more.

Depth Perception

Our ability to perceive spatial relationships in three-dimensional (3-D) space is known as depth perception. With depth perception, we can describe things as being in front, behind, above, below, or to the side of other things.

Our world is three-dimensional, so it makes sense that our mental representation of the world has three-dimensional properties. We use a variety of cues in a visual scene to establish our sense of depth. Some of these are binocular cues, which means that they rely on the use of both eyes. One example of a binocular depth cue is , the slightly different view of the world that each of our eyes receives. To experience this slightly different view, do this simple exercise: extend your arm fully and extend one of your fingers and focus on that finger. Now, close your left eye without moving your head, then open your left eye and close your right eye without moving your head. You will notice that your finger seems to shift as you alternate between the two eyes because of the slightly different view each eye has of your finger.

A 3-D movie works on the same principle: the special glasses you wear allow the two slightly different images projected onto the screen to be seen separately by your left and your right eye. As your brain processes these images, you have the illusion that the leaping animal or running person is coming right toward you.

Although we rely on binocular cues to experience depth in our 3-D world, we can also perceive depth in 2-D arrays. Think about all the paintings and photographs you have seen. Generally, you pick up on depth in these images even though the visual stimulus is 2-D. When we do this, we are relying on a number of monocular cues, or cues that require only one eye. If you think you can’t see depth with one eye, note that you don’t bump into things when using only one eye while walking—and, in , we have more monocular cues than binocular cues.

An example of a monocular cue would be what is known as linear perspective. Linear perspective refers to the that we perceive depth when we see two parallel lines that seem to converge in an image (Figure 5.17). Some other monocular depth cues are interposition, the partial overlap of objects, and the relative size and closeness of images to the horizon.

A photograph shows an empty road that continues toward the horizon.
Figure 5.17 — 5.3 Vision

Figure 5.17 We perceive depth in a two-dimensional figure like this one through the use of monocular cues like linear perspective, like the parallel lines converging as the road narrows in the distance. (credit: Marc Dalmulder)

Rose M. Spielman, William J. Jenkins, and Marilyn D. Lovett, Psychology 2E, OpenStax. (credit: Marc Dalmulder) · CC BY-NC-SA 4.0 · Original image ↗ · Access for free ↗

Dig Deeper

Stereoblindness

Bruce Bridgeman was born with an extreme case of lazy eye that resulted in him being stereoblind, or unable to respond to binocular cues of depth. He relied heavily on monocular depth cues, but he never had a true appreciation of the 3-D nature of the world around him. This all changed one night in 2012 while Bruce was seeing a movie with wife.

The movie the couple was going to see was shot in 3-D, and even though he thought it was a waste of money, Bruce paid for the 3-D glasses when he purchased ticket. As soon as the film began, Bruce put on the glasses and experienced something completely new. For the first time in life he appreciated the true depth of the world around him. Remarkably, ability to perceive depth persisted outside of the movie theater.

There are cells in the nervous system that respond to binocular depth cues. Normally, these cells require activation during early development in order to persist, so experts familiar with Bruce’s case (and others like ) assume that at some point in development, Bruce must have experienced at least a fleeting moment of binocular vision. It was enough to ensure the survival of the cells in the visual system tuned to binocular cues. The mystery now is why it took Bruce nearly 70 years to have these cells activated (Peck, 2012).