Enthalpy H = U + PV gives ΔH = qp for a constant-pressure process with only pressure–volume work. Exothermic reactions have ΔH < 0. Hess’s law permits adding reaction enthalpies because H is a state function: reversing a reaction changes the sign and scaling its coefficients scales ΔH. Standard formation enthalpy refers to one mole formed from elements in their standard states; those elements have ΔHf° = 0 by convention. Compute ΔH°reaction = ΣνΔHf°products − ΣνΔHf°reactants. Average bond energies estimate ΔH as bonds broken minus bonds formed, with limited accuracy because molecular environments differ.
At constant temperature and pressure, ΔG = ΔH − TΔS predicts thermodynamic direction: negative is spontaneous forward, positive favors reverse, and zero is equilibrium. Use kelvin and match energy units. If ΔH < 0 and ΔS > 0, forward change is favorable at all temperatures within the assumed phase/model range; ΔH > 0 with ΔS < 0 is unfavorable at all positive temperatures in that range. When ΔH and ΔS have the same sign, a temperature-dependent crossover can occur at T = ΔH/ΔS. A spontaneous reaction may be extremely slow. Enzymes and other catalysts lower barriers but do not change endpointΔG or equilibrium. Concentrations can change actual ΔG even when ΔG° is fixed.
A phase diagram plots stable phases against temperature and pressure; boundary curves show coexistence. The triple point permits three phases to coexist, while beyond the critical point distinct liquid and gas phases disappear. Boiling occurs when vapor pressure equals external pressure, so reduced pressure lowers boiling temperature. During a pure substance’s phase change at fixed pressure, added heat can change phase fraction without changing temperature: q = mL or nΔHtransition. Water’s solid–liquid boundary has an unusual negative slope because ice is less dense than liquid water under ordinary conditions.
Try before revealing the answer. A reaction has ΔH = +20 kJ/mol and ΔS = +100 J mol⁻¹ K⁻¹, approximately constant over the range. Find the crossover temperature and ΔG at 300 K.
Worked answer
Convert entropy to 0.100 kJ mol⁻¹ K⁻¹. ΔG = 0 at T = ΔH/ΔS = 20/0.100 = 200 K. At 300 K, ΔG = 20 − 300×0.100 = −10 kJ/mol, favorable forward within the stated assumptions.
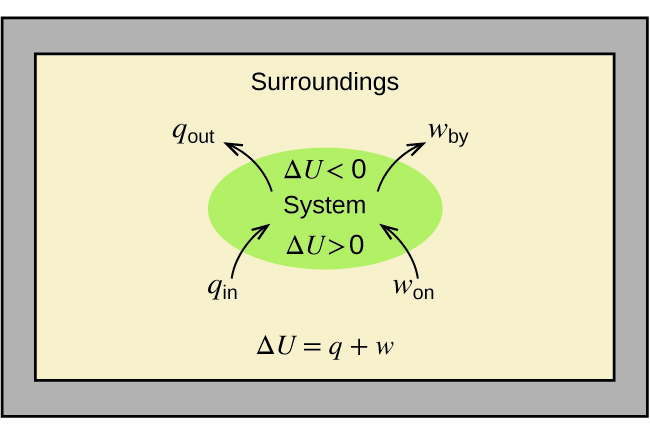
Figure 5.19 The internal energy, U , of a system can be changed by heat flow and work. If heat flows into the system, q in , or work is done on the system, w on , its internal energy increases, Δ U > 0. If heat flows out of the system, q out , or work is done by the system, w by , its internal energy decreases, Δ U < 0.
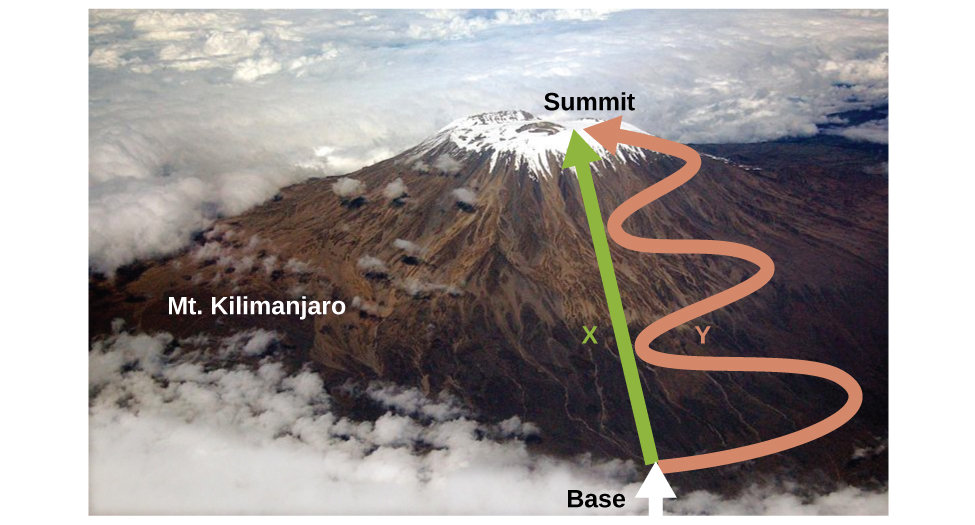
Figure 5.20 Paths X and Y represent two different routes to the summit of Mt. Kilimanjaro. Both have the same change in elevation (altitude or elevation on a mountain is a state function; it does not depend on path), but they have very different distances traveled (distance walked is not a state function; it depends on the path). (credit: modification of work by Paul Shaffner)
Paul Flowers, Klaus Theopold, Richard Langley, and William R. Robinson, Chemistry 2E, OpenStax. (credit: modification of work by Paul Shaffner) · CC BY-NC-SA 4.0
· Original image ↗ · Access for free ↗Figure 5.21 — 5.3 Enthalpy
Figure 5.21 The combustion of gasoline is very exothermic. (credit: modification of work by “AlexEagle”/Flickr)
Paul Flowers, Klaus Theopold, Richard Langley, and William R. Robinson, Chemistry 2E, OpenStax. (credit: modification of work by “AlexEagle”/Flickr) · CC BY-NC-SA 4.0
· Original image ↗ · Access for free ↗Figure 5.22 — 5.3 Enthalpy
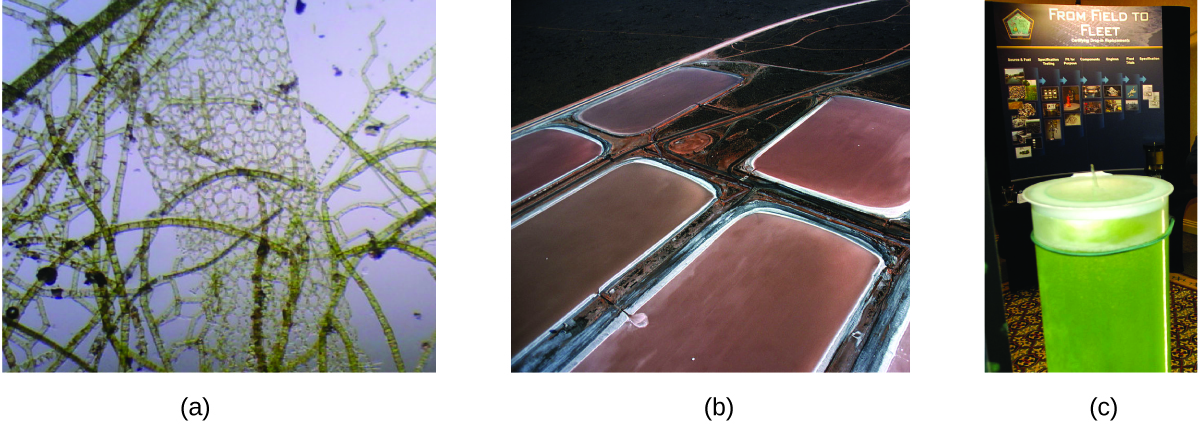
Figure 5.22 (a) Tiny algal organisms can be (b) grown in large quantities and eventually (c) turned into a useful fuel such as biodiesel. (credit a: modification of work by Micah Sittig; credit b: modification of work by Robert Kerton; credit c: modification of work by John F. Williams)
Paul Flowers, Klaus Theopold, Richard Langley, and William R. Robinson, Chemistry 2E, OpenStax. (credit a: modification of work by Micah Sittig; credit b: modification of work by Robert Kerton; credit c: modification of work by John F. Williams) · CC BY-NC-SA 4.0
· Original image ↗ · Access for free ↗Figure 5.23 — 5.3 Enthalpy
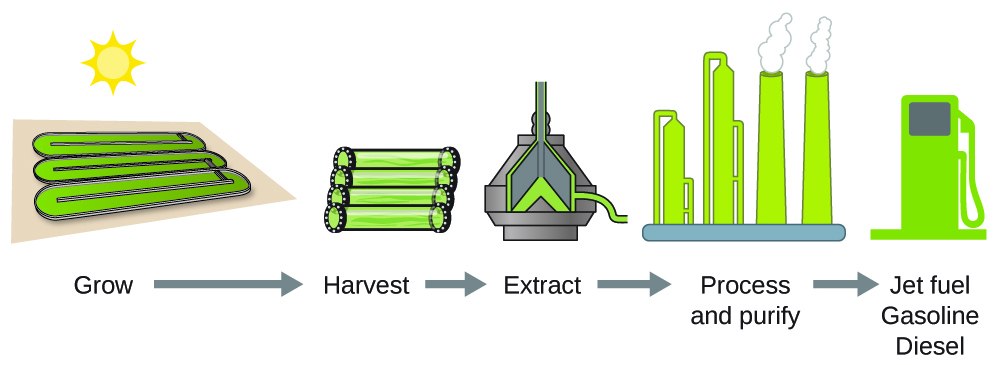
Figure 5.23 Algae convert sunlight and carbon dioxide into oil that is harvested, extracted, purified, and transformed into a variety of renewable fuels.
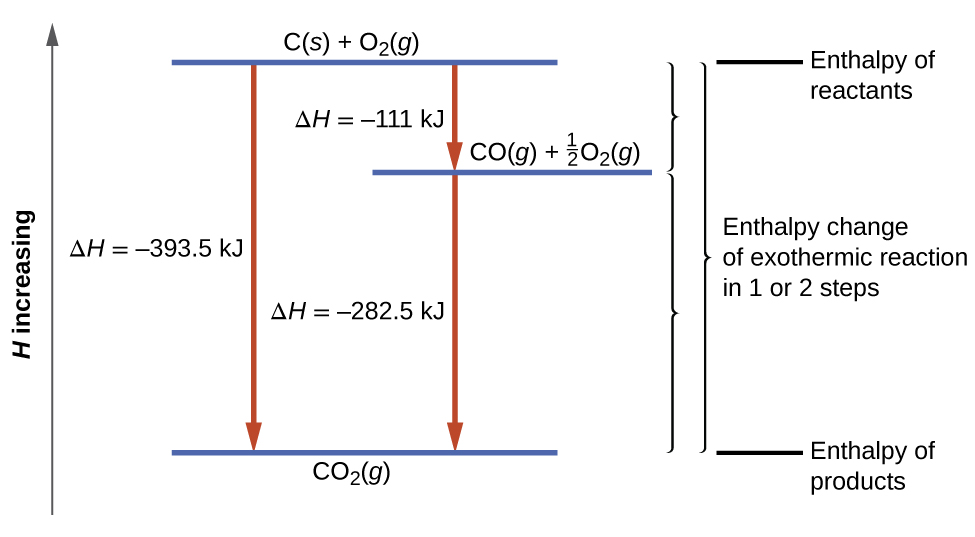
Figure 5.24 The formation of CO 2 ( g ) from its elements can be thought of as occurring in two steps, which sum to the overall reaction, as described by Hess’s law. The horizontal blue lines represent enthalpies. For an exothermic process, the products are at lower enthalpy than are the reactants.
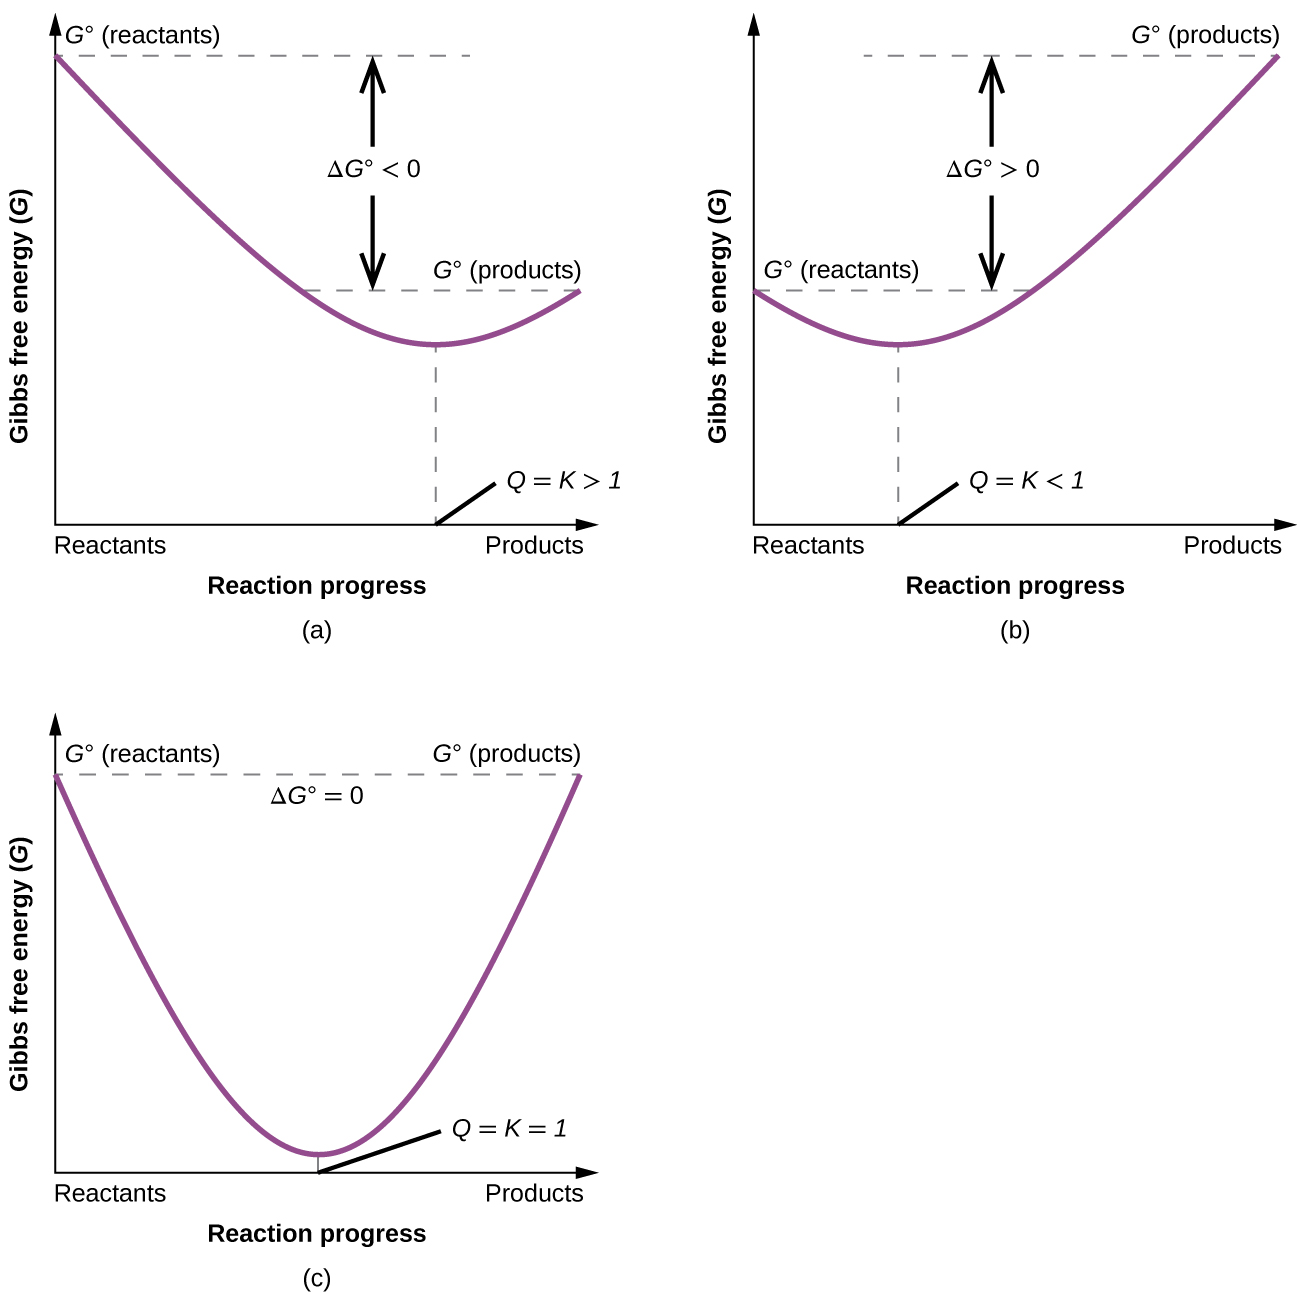
Figure 16.14 These plots show the free energy versus reaction progress for systems whose standard free energy changes are (a) negative, (b) positive, and (c) zero. Nonequilibrium systems will proceed spontaneously in whatever direction is necessary to minimize free energy and establish equilibrium.
Figure 10.31 The pressure and temperature axes on this phase diagram of water are not drawn to constant scale in order to illustrate several important properties.
Figure 10.32 Freeze-dried foods, like this ice cream, are dehydrated by sublimation at pressures below the triple point for water. (credit: ʺlwaoʺ/Flickr)
Paul Flowers, Klaus Theopold, Richard Langley, and William R. Robinson, Chemistry 2E, OpenStax. (credit: ʺlwaoʺ/Flickr) · CC BY-NC-SA 4.0
· Original image ↗ · Access for free ↗Figure 10.33 — 10.4 Phase Diagrams
Figure 10.33 The immense pressures beneath glaciers result in partial melting to produce a layer of water that provides lubrication to assist glacial movement. This satellite photograph shows the advancing edge of the Perito Moreno glacier in Argentina. (credit: NASA)
Paul Flowers, Klaus Theopold, Richard Langley, and William R. Robinson, Chemistry 2E, OpenStax. (credit: NASA) · CC BY-NC-SA 4.0
· Original image ↗ · Access for free ↗Figure 10.34 — 10.4 Phase Diagrams
Figure 10.34 A phase diagram for carbon dioxide is shown. The pressure axis is plotted on a logarithmic scale to accommodate the large range of values.
Figure 10.35 (a) A sealed container of liquid carbon dioxide slightly below its critical point is heated, resulting in (b) the formation of the supercritical fluid phase. Cooling the supercritical fluid lowers its temperature and pressure below the critical point, resulting in the reestablishment of separate liquid and gaseous phases (c and d). Colored floats illustrate differences in density between the liquid, gaseous, and supercritical fluid states. (credit: modification of work by “mrmrobin”/YouTube)
Paul Flowers, Klaus Theopold, Richard Langley, and William R. Robinson, Chemistry 2E, OpenStax. (credit: modification of work by “mrmrobin”/YouTube) · CC BY-NC-SA 4.0
· Original image ↗ · Access for free ↗Figure 10.36 — 10.4 Phase Diagrams
Figure 10.36 (a) Caffeine molecules have both polar and nonpolar regions, making it soluble in solvents of varying polarities. (b) The schematic shows a typical decaffeination process involving supercritical carbon dioxide.
A nitrogen-containing functional group. A free amino acid’s amino group is typically protonated (NH₃⁺) near physiological pH; proline’s ring nitrogen is an exception to this formula.
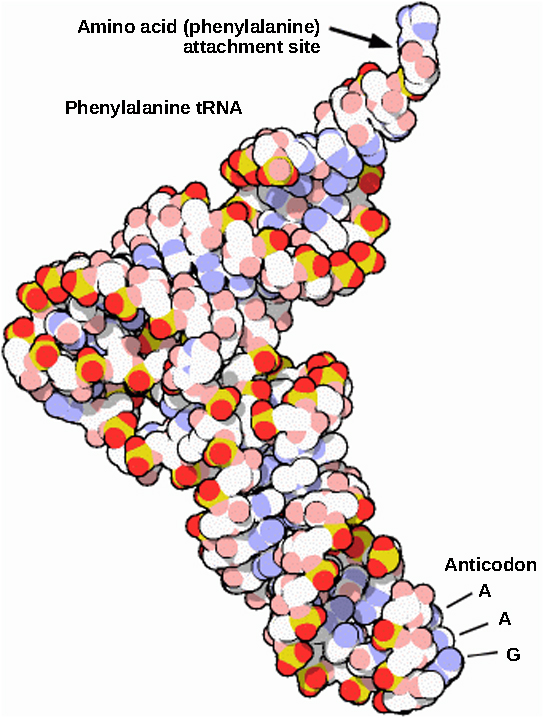
Figure 15.14 This is a space-filling model of a tRNA molecule that adds the amino acid phenylalanine to a growing polypeptide chain. The anticodon AAG binds the Codon UUC on the mRNA. The amino acid phenylalanine is attached to the other end of the tRNA.
Figure 15.4 This figure shows the genetic code for translating each nucleotide triplet in mRNA into an amino acid or a termination signal in a protein. (credit: modification of work by NIH)
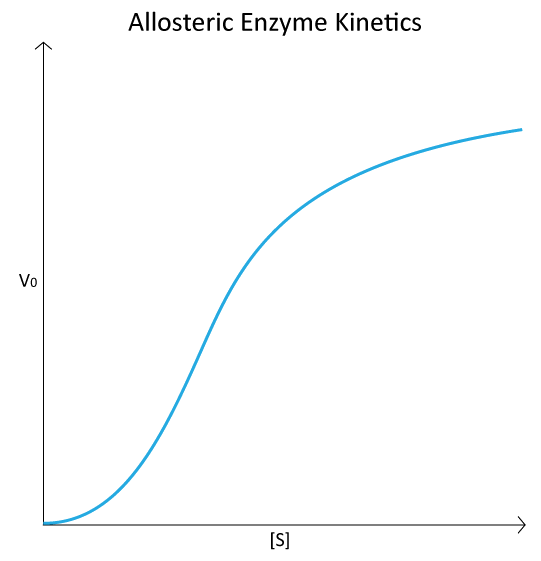
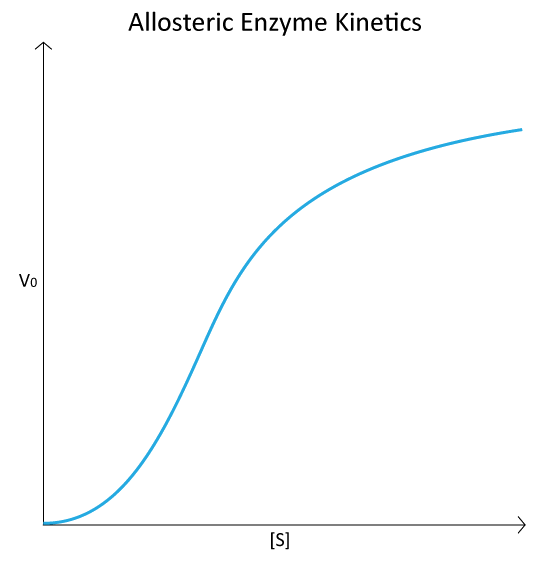
Figure 4.44 - Kinetic profile of an allosteric enzyme whose activity is controlled by a homotropic effector. Image by Aleia Kim
Kevin Ahern, Indira Rajagopal, and Taralyn Tan, Biochemistry Free For All, Oregon State University, via Biology LibreTexts. Image by Aleia Kim · CC BY-NC-SA 4.0
· Original image ↗ · Access for free ↗
An electrical property that can be positive or negative. Opposite charges attract and like charges repel; net charge is the sum of all charges on a particle.
Figure 12.19 Reaction diagrams for an endothermic process in the absence (red curve) and presence (blue curve) of a catalyst. The catalyzed pathway involves a two-step mechanism (note the presence of two transition states) and an intermediate species (represented by the valley between the two transitions states).
The difference in enthalpy between products and reactants. At constant pressure with only pressure–volume work, it equals the heat transferred to the system.
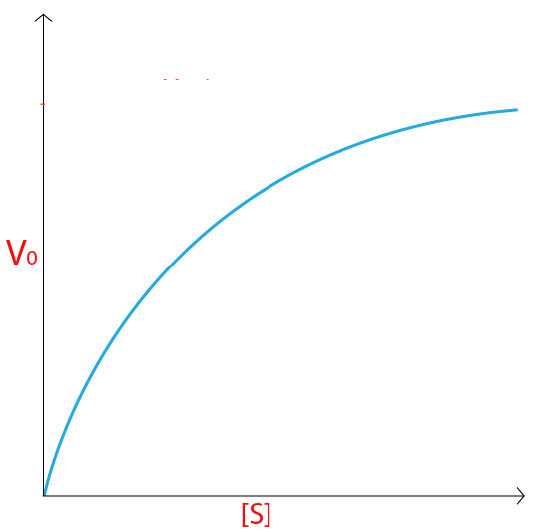
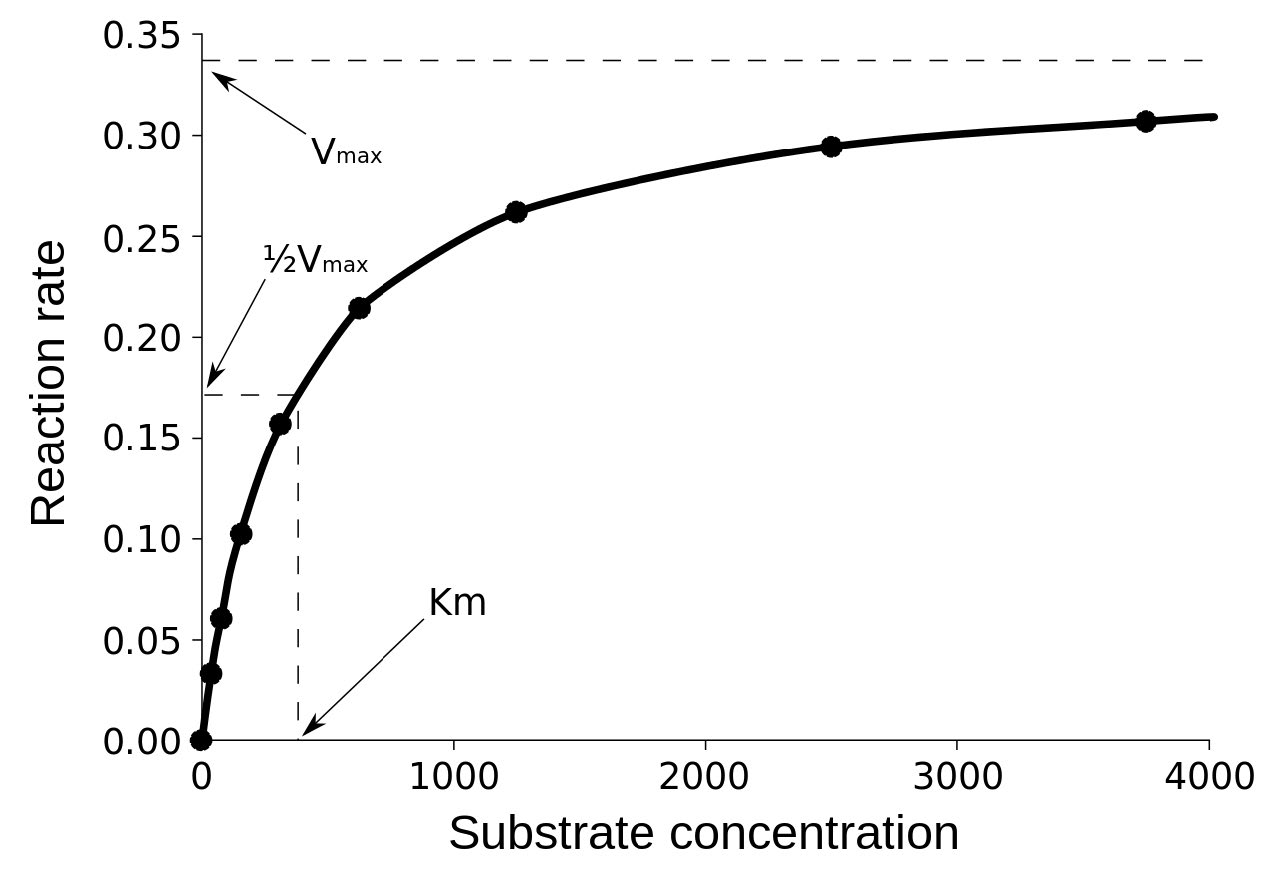
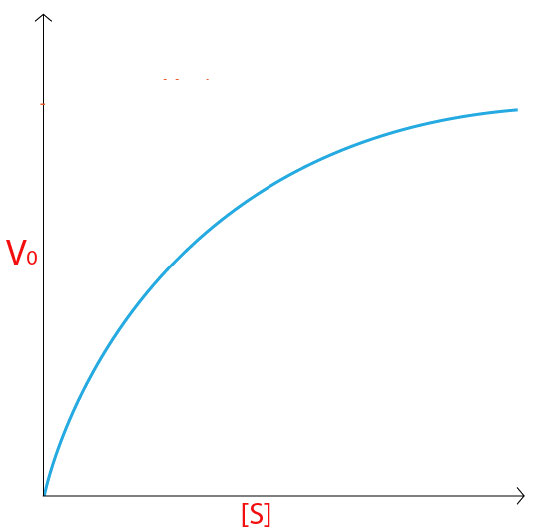
Figure 4.18 - Kinetics of an enzyme obeying Michaelis-Menten kinetics. Image by Aleia Kim
Kevin Ahern, Indira Rajagopal, and Taralyn Tan, Biochemistry Free For All, Oregon State University, via Biology LibreTexts. Image by Aleia Kim · CC BY-NC-SA 4.0
· Original image ↗ · Access for free ↗
Equilibrium
A state where opposing processes occur at equal rates, so macroscopic concentrations or other properties remain constant.
A ratio of product to reactant activities at equilibrium, each raised to its stoichiometric coefficient. At a fixed temperature, a catalyst does not change this ratio.
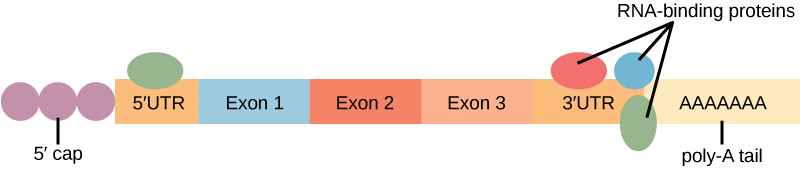
Figure 15.11 Eukaryotic pre-mRNA processing. In addition to 5’ Cap and 3’ Poly-A Tail addition, introns must be precisely removed and exons joined to generate a functional mRNA. Nucleotides upstream (towards the 5’cap) of the translation START codon are part of the 5’ untranslated region (5’ UTR). Nucleotides downstream (towards 3’end) of the STOP codon form the 3’ UTR. Both 5’ and 3’ UTRs are important for regulating translation initiation and mRNA stability. Credit: Rao, A., Ryan, K. Fletcher, S. and Tag, A. Department of Biology, Texas A&M University.
Rao, A., Ryan, K. Fletcher, S. and Tag, A. Department of Biology, Texas A&M University.; Mary Ann Clark, Matthew Douglas, and Jung Choi, Biology 2e, OpenStax. · CC BY-NC-SA 4.0
· Original image ↗ · Access for free ↗
A thermodynamic quantity used to predict whether a process is favorable at constant temperature and pressure. A negative change favors the forward process.
The change in Gibbs free energy during a process. At constant temperature and pressure, a negative value favors the forward reaction under the stated conditions; it does not specify reaction speed.
Figure 16.13 RNA-binding proteins. The protein-coding region of this processed mRNA is flanked by 5' and 3' untranslated regions (UTRs). The presence of RNA-binding proteins at the 5' or 3' UTR influences the stability of the RNA molecule.
Figure 4.18 - Kinetics of an enzyme obeying Michaelis-Menten kinetics. Image by Aleia Kim
Kevin Ahern, Indira Rajagopal, and Taralyn Tan, Biochemistry Free For All, Oregon State University, via Biology LibreTexts. Image by Aleia Kim · CC BY-NC-SA 4.0
· Original image ↗ · Access for free ↗
ideal gas
Model gas with negligible particle volume and negligible intermolecular interactions.
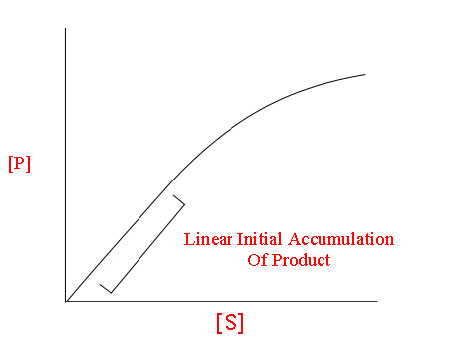
The early rate of product formation, measured before substantial substrate depletion or product accumulation, usually after the brief binding transient.
Figure 4.18 - Kinetics of an enzyme obeying Michaelis-Menten kinetics. Image by Aleia Kim
Kevin Ahern, Indira Rajagopal, and Taralyn Tan, Biochemistry Free For All, Oregon State University, via Biology LibreTexts. Image by Aleia Kim · CC BY-NC-SA 4.0
· Original image ↗ · Access for free ↗
internal energy
Total microscopic energy within a system under a specified description.
Figure 15.11 Eukaryotic pre-mRNA processing. In addition to 5’ Cap and 3’ Poly-A Tail addition, introns must be precisely removed and exons joined to generate a functional mRNA. Nucleotides upstream (towards the 5’cap) of the translation START codon are part of the 5’ untranslated region (5’ UTR). Nucleotides downstream (towards 3’end) of the STOP codon form the 3’ UTR. Both 5’ and 3’ UTRs are important for regulating translation initiation and mRNA stability. Credit: Rao, A., Ryan, K. Fletcher, S. and Tag, A. Department of Biology, Texas A&M University.
Rao, A., Ryan, K. Fletcher, S. and Tag, A. Department of Biology, Texas A&M University.; Mary Ann Clark, Matthew Douglas, and Jung Choi, Biology 2e, OpenStax. · CC BY-NC-SA 4.0
· Original image ↗ · Access for free ↗
The exponent needed to obtain a number from a chosen fixed number. For decimal logarithms, log₁₀(100) = 2 because 10² = 100; pH uses the negative decimal logarithm of hydrogen ion activity.
A thin boundary or sheet. Cell membranes are lipid bilayers containing proteins; blotting membranes are synthetic supports that hold proteins or nucleic acids for detection.
Figure 15.11 Eukaryotic pre-mRNA processing. In addition to 5’ Cap and 3’ Poly-A Tail addition, introns must be precisely removed and exons joined to generate a functional mRNA. Nucleotides upstream (towards the 5’cap) of the translation START codon are part of the 5’ untranslated region (5’ UTR). Nucleotides downstream (towards 3’end) of the STOP codon form the 3’ UTR. Both 5’ and 3’ UTRs are important for regulating translation initiation and mRNA stability. Credit: Rao, A., Ryan, K. Fletcher, S. and Tag, A. Department of Biology, Texas A&M University.
Rao, A., Ryan, K. Fletcher, S. and Tag, A. Department of Biology, Texas A&M University.; Mary Ann Clark, Matthew Douglas, and Jung Choi, Biology 2e, OpenStax. · CC BY-NC-SA 4.0
· Original image ↗ · Access for free ↗
Figure 4.18 - Kinetics of an enzyme obeying Michaelis-Menten kinetics. Image by Aleia Kim
Kevin Ahern, Indira Rajagopal, and Taralyn Tan, Biochemistry Free For All, Oregon State University, via Biology LibreTexts. Image by Aleia Kim · CC BY-NC-SA 4.0
· Original image ↗ · Access for free ↗
Figure 12.19 Reaction diagrams for an endothermic process in the absence (red curve) and presence (blue curve) of a catalyst. The catalyzed pathway involves a two-step mechanism (note the presence of two transition states) and an intermediate species (represented by the valley between the two transitions states).
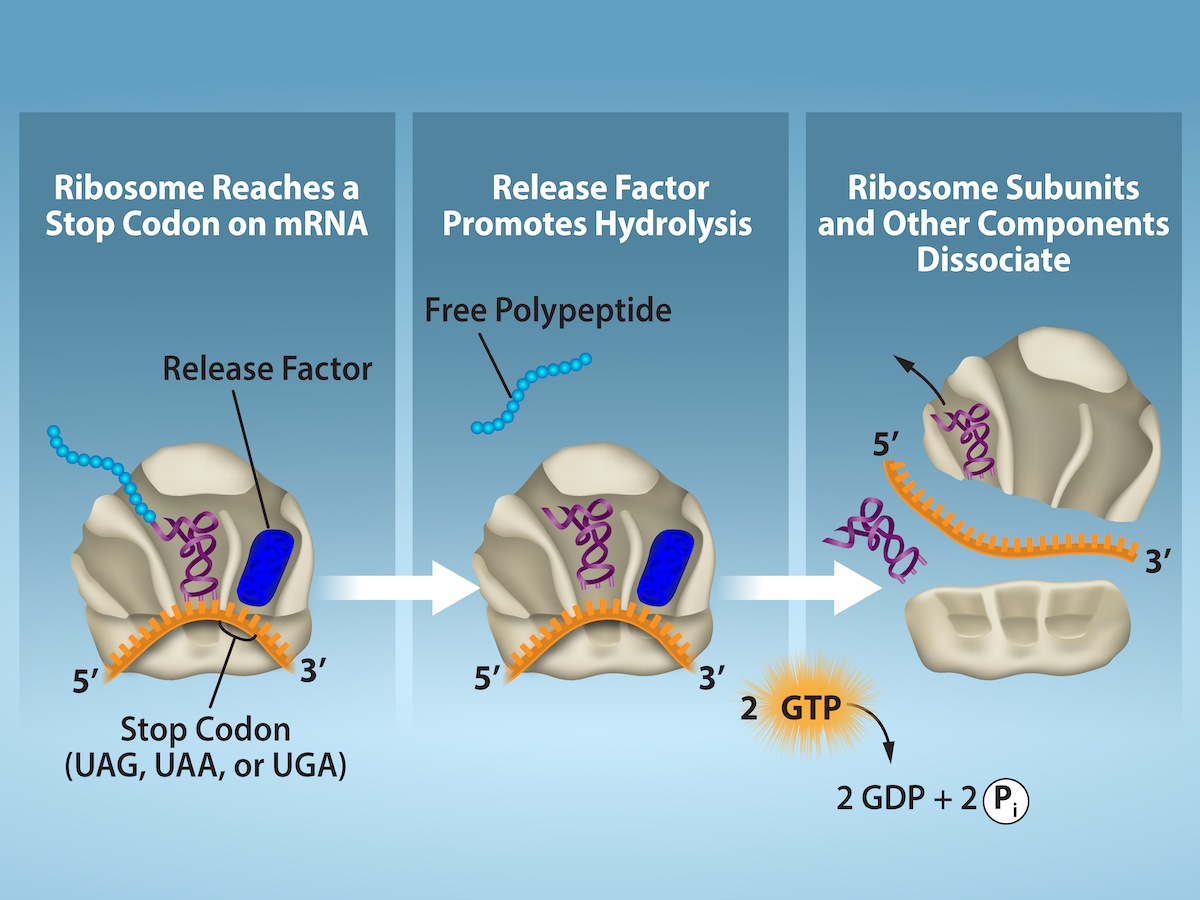
Figure 15.19 Translation Termination is Active. Translation is terminated when a STOP codon is in the A-site of the ribosome. Since there are no tRNAs corresponding to the STOP codons, the Release Factor protein enters and catalyzes the hydrolysis between the last amino acid and its tRNA. This hydrolysis releases the free carboxyl terminus (C-term) of the protein. Additional factors use the energy in GTP hydrolysis to disassemble the large and small ribosomal subunits and mRNA. Credit: Rao, A. and Ryan, K. Department of Biology, Texas A&M University.
Rao, A. and Ryan, K. Department of Biology, Texas A&M University.; Mary Ann Clark, Matthew Douglas, and Jung Choi, Biology 2e, OpenStax. · CC BY-NC-SA 4.0
· Original image ↗ · Access for free ↗
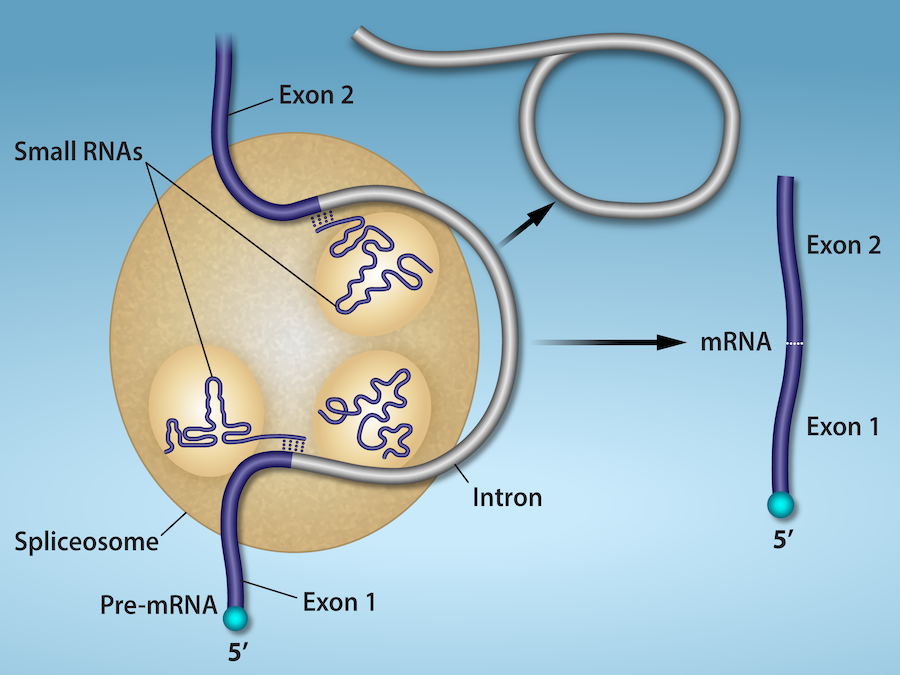
Figure 15.13 Pre-mRNA splicing involves the precise removal of introns from the primary RNA transcript. The splicing process is catalyzed by protein complexes called spliceosomes that are composed of proteins and RNA molecules called small nuclear RNAs (snRNAs). Spliceosomes recognize sequences at the 5' and 3' end of the intron. Rao, A. and Ryan, K. Department of Biology, Texas A&M University.
Rao, A. and Ryan, K. Department of Biology, Texas A&M University.; Mary Ann Clark, Matthew Douglas, and Jung Choi, Biology 2e, OpenStax. · CC BY-NC-SA 4.0
· Original image ↗ · Access for free ↗
RNA stability
Persistence of an RNA before degradation; greater stability generally means a longer lifetime or half-life under specified conditions.
Figure 16.13 RNA-binding proteins. The protein-coding region of this processed mRNA is flanked by 5' and 3' untranslated regions (UTRs). The presence of RNA-binding proteins at the 5' or 3' UTR influences the stability of the RNA molecule.
Figure 4.44 - Kinetic profile of an allosteric enzyme whose activity is controlled by a homotropic effector. Image by Aleia Kim
Kevin Ahern, Indira Rajagopal, and Taralyn Tan, Biochemistry Free For All, Oregon State University, via Biology LibreTexts. Image by Aleia Kim · CC BY-NC-SA 4.0
· Original image ↗ · Access for free ↗
Figure 7.45 - Non-homologous end joining (left) versus homologous recombination (right) - Wikipedia
Wikipedia, as credited by Kevin Ahern, Indira Rajagopal, and Taralyn Tan, Biochemistry Free For All, Oregon State University, via Biology LibreTexts. · Source attribution
· Original image ↗ · Access for free ↗
The amount of a substance that can dissolve in a solvent under specified conditions. Soluble means able to dissolve; insoluble means only very slightly soluble in that solvent.
Figure 15.4 This figure shows the genetic code for translating each nucleotide triplet in mRNA into an amino acid or a termination signal in a protein. (credit: modification of work by NIH)
Figure 15.7 Messenger RNA is a copy of protein-coding information in the coding strand of DNA, with the substitution of U in the RNA for T in the coding sequence. However, new RNA nucleotides base pair with the nucleotides of the template strand. RNA is synthesized in its 5'-3' direction, using the enzyme RNA polymerase. As the template is read, the DNA unwinds ahead of the polymerase and then rewinds behind it.
Figure 15.14 This is a space-filling model of a tRNA molecule that adds the amino acid phenylalanine to a growing polypeptide chain. The anticodon AAG binds the Codon UUC on the mRNA. The amino acid phenylalanine is attached to the other end of the tRNA.
A fleeting, high-energy arrangement at a reaction barrier. It is an energy maximum along the reaction path, rather than a stable reaction intermediate.
Figure 12.19 Reaction diagrams for an endothermic process in the absence (red curve) and presence (blue curve) of a catalyst. The catalyzed pathway involves a two-step mechanism (note the presence of two transition states) and an intermediate species (represented by the valley between the two transitions states).
Figure 15.18 Translation begins when an initiator tRNA anticodon recognizes a start codon on mRNA bound to a small ribosomal subunit. The large ribosomal subunit joins the small subunit, and a second tRNA is recruited. As the mRNA moves relative to the ribosome, successive tRNAs move through the ribosome and the polypeptide chain is formed. Entry of a release factor into the A site terminates translation and the components dissociate.
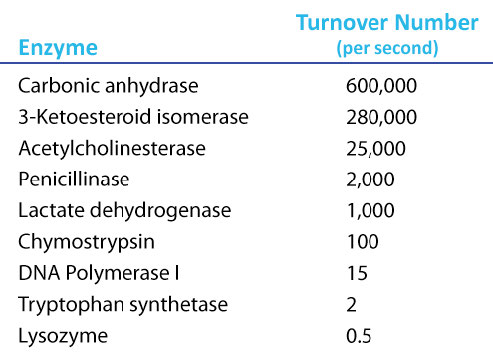
Figure 4.21 - Kcat (turnover number) values for several enzymes. Image by Aleia Kim
Kevin Ahern, Indira Rajagopal, and Taralyn Tan, Biochemistry Free For All, Oregon State University, via Biology LibreTexts. Image by Aleia Kim · CC BY-NC-SA 4.0
· Original image ↗ · Access for free ↗
No matching terms. Try a different name or abbreviation.
5.3 Enthalpy
OpenStax · 5.3 Enthalpy ↗ Instructional page including learning objectives, examples, figures, source tables and questions. Site navigation and embedded media players are omitted; source media links remain available.
Thermochemistry is a branch of chemical thermodynamics, the science that deals with the relationships between heat, work, and other forms of energy in the context of chemical and physical processes. As we concentrate on thermochemistry in this chapter, we need to consider some widely used concepts of thermodynamics.
Substances act as reservoirs of energy, meaning that energy can be added to them or removed from them. Energy is stored in a substance when the kinetic energy of its atoms or molecules is raised. The greater kinetic energy may be in the form of increased translations (travel or straight-line motions), vibrations, or rotations of the atoms or molecules. When thermal energy is lost, the intensities of these motions decrease and the kinetic energy falls. The total of all possible kinds of energy present in a substance is called the internal energy (U), sometimes symbolized as E.
As a system undergoes a change, its internal energy can change, and energy can be transferred from the system to the surroundings, or from the surroundings to the system. Energy is transferred into a system when it absorbs heat (q) from the surroundings or when the surroundings do work (w) on the system. For example, energy is transferred into room-temperature metal wire if it is immersed in hot water (the wire absorbs heat from the water), or if you rapidly bend the wire back and forth (the wire becomes warmer because of the work done on it). Both processes increase the internal energy of the wire, which is reflected in an increase in the wire’s temperature. Conversely, energy is transferred out of a system when heat is lost from the system, or when the system does work on the surroundings.
The relationship between internal energy, heat, and work can be represented by the equation:
as shown in Figure 5.19. This is one version of the first law of thermodynamics, and it shows that the internal energy of a system changes through heat flow into or out of the system (positive q is heat flow in; negative q is heat flow out) or work done on or by the system. The work, w, is positive if it is done on the system and negative if it is done by the system.
Figure 5.19 The internal energy, U , of a system can be changed by heat flow and work. If heat flows into the system, q in , or work is done on the system, w on , its internal energy increases, Δ U > 0. If heat flows out of the system, q out , or work is done by the system, w by , its internal energy decreases, Δ U < 0.
A type of work called expansion work (or pressure-volume work) occurs when a system pushes back the surroundings against a restraining pressure, or when the surroundings compress the system. An example of this occurs during the operation of an internal combustion engine. The reaction of gasoline and oxygen is exothermic. Some of this energy is given off as heat, and some does work pushing the piston in the cylinder. The substances involved in the reaction are the system, and the engine and the rest of the universe are the surroundings. The system loses energy by both heating and doing work on the surroundings, and its internal energy decreases. (The engine is able to keep the car moving because this process is repeated many times per second while the engine is running.) We will consider how to determine the amount of work involved in a chemical or physical change in the chapter on thermodynamics.
Link to Learning
This view of an internal combustion engine illustrates the conversion of energy produced by the exothermic combustion reaction of a fuel such as gasoline into energy of motion.
As discussed, the relationship between internal energy, heat, and work can be represented as ΔU = q + w. Internal energy is an example of a state function (or state variable), whereas heat and work are not state functions. The value of a state function depends only on the state that a system is in, and not on how that state is reached. If a quantity is not a state function, then its value does depend on how the state is reached. An example of a state function is altitude or elevation. If you stand on the summit of Mt. Kilimanjaro, you are at an altitude of 5895 m, and it does not matter whether you hiked there or parachuted there. The distance you traveled to the top of Kilimanjaro, however, is not a state function. You could climb to the summit by a direct route or by a more roundabout, circuitous path (Figure 5.20). The distances traveled would differ (distance is not a state function) but the elevation reached would be the same (altitude is a state function).
Figure 5.20 Paths X and Y represent two different routes to the summit of Mt. Kilimanjaro. Both have the same change in elevation (altitude or elevation on a mountain is a state function; it does not depend on path), but they have very different distances traveled (distance walked is not a state function; it depends on the path). (credit: modification of work by Paul Shaffner)
Paul Flowers, Klaus Theopold, Richard Langley, and William R. Robinson, Chemistry 2E, OpenStax. (credit: modification of work by Paul Shaffner) · CC BY-NC-SA 4.0
· Original image ↗ · Access for free ↗
Chemists ordinarily use a property known as enthalpy (H) to describe the thermodynamics of chemical and physical processes. Enthalpy is defined as the sum of a system’s internal energy (U) and the mathematical product of its pressure (P) and volume (V):
Enthalpy is also a state function. Enthalpy values for specific substances cannot be measured directly; only enthalpychanges for chemical or physical processes can be determined. For processes that take place at constant pressure (a common condition for many chemical and physical changes), the enthalpy change (ΔH) is:
The mathematical productPΔV represents work (w), namely, expansion or pressure-volume work as noted. By their definitions, the arithmetic signs of ΔV and w will always be opposite:
Substituting this equation and the definition of internal energy into the enthalpy-change equation yields:
where qp is the heat of reaction under conditions of constant pressure.
And so, if a chemical or physical process is carried out at constant pressure with the only work done caused by expansion or contraction, then the heat flow (qp) and enthalpy change (ΔH) for the process are equal.
The heat given off when you operate a Bunsen burner is equal to the enthalpy change of the methane combustion reaction that takes place, since it occurs at the essentially constant pressure of the atmosphere. On the other hand, the heat produced by a reaction measured in a bomb calorimeter (Figure 5.17) is not equal to ΔH because the closed, constant-volume metal container prevents the pressure from remaining constant (it may increase or decrease if the reaction yields increased or decreased amounts of gaseous species). Chemists usually perform experiments under normal atmospheric conditions, at constant external pressure with q = ΔH, which makes enthalpy the most convenient choice for determining heat changes for chemical reactions.
The following conventions apply when using ΔH:
A negative value of an enthalpy change, ΔH < 0, indicates an exothermic reaction; a positive value, ΔH > 0, indicates an endothermicreaction. If the direction of a chemical equation is reversed, the arithmetic sign of its ΔH is changed (a process that is endothermic in one direction is exothermic in the opposite direction).
Chemists use a thermochemical equation to represent the changes in both matter and energy. In a thermochemical equation, the enthalpy change of a reaction is shown as a ΔH value following the equation for the reaction. This ΔH value indicates the amount of heat associated with the reaction involving the number of moles of reactants and productsas shown in the chemical equation. For example, consider this equation:
This equation indicates that when 1 mole of hydrogen gas and mole of oxygen gas at some temperature and pressure change to 1 mole of liquid water at the same temperature and pressure, 286 kJ of heat are released to the surroundings. If the coefficients of the chemical equation are multiplied by some factor, the enthalpy change must be multiplied by that same factor (ΔH is an extensive property):
The enthalpy change of a reaction depends on the physical states of the reactants and products, so these must be shown. For example, when 1 mole of hydrogen gas and mole of oxygen gas change to 1 mole of liquid water at the same temperature and pressure, 286 kJ of heat are released. If gaseous water forms, only 242 kJ of heat are released.
Example
5.8
Writing Thermochemical Equations
When 0.0500 mol of HCl(aq) reacts with 0.0500 mol of NaOH(aq) to form 0.0500 mol of NaCl(aq), 2.9 kJ of heat are produced. Write a balanced thermochemical equation for the reaction of one mole of HCl.
For the reaction of 0.0500 mol acid (HCl), q = −2.9 kJ. The reactants are provided in stoichiometric amounts (same molar ratio as in the balanced equation), and so the amount of acid may be used to calculate a molar enthalpy change. Since ΔH is an extensive property, it is proportional to the amount of acid neutralized:
The thermochemical equation is then
Check Your Learning
When 1.34 g Zn(s) reacts with 60.0 mL of 0.750 M HCl(aq), 3.14 kJ of heat are produced. Determine the enthalpy change per mole of zinc reacting for the reaction:
Be sure to take both stoichiometry and limiting reactants into account when determining the ΔH for a chemical reaction.
Example
5.9
Writing Thermochemical Equations
A gummy bear contains 2.67 g sucrose, C12H22O11. When it reacts with 7.19 g potassium chlorate, KClO3, 43.7 kJ of heat are produced. Write a thermochemical equation for the reaction of one mole of sucrose:
Unlike the previous example exercise, this one does not involve the reaction of stoichiometric amounts of reactants, and so the limiting reactant must be identified (it limits the yield of the reaction and the amount of thermal energy produced or consumed).
The provided molar ratio of perchlorate-to-sucrose is then
The balanced equation indicates 8 mol KClO3 are required for reaction with 1 mol C12H22O11. Since the provided amount of KClO3 is less than the stoichiometric amount, it is the limiting reactant and may be used to compute the enthalpy change:
Because the equation, as written, represents the reaction of 8 mol KClO3, the enthalpy change is
When 1.42 g of iron reacts with 1.80 g of chlorine, 3.22 g of FeCl2(s) and 8.60 kJ of heat is produced. What is the enthalpy change for the reaction when 1 mole of FeCl2(s) is produced?
Enthalpy changes are typically tabulated for reactions in which both the reactants and products are at the same conditions. A standard state is a commonly accepted set of conditions used as a reference point for the determination of properties under other different conditions. For chemists, the IUPAC standard state refers to materials under a pressure of 1 bar and solutions at 1 M, and does not specify a temperature. Many thermochemical tables list values with a standard state of 1 atm. Because the ΔH of a reaction changes very little with such small changes in pressure (1 bar = 0.987 atm), ΔH values (except for the most precisely measured values) are essentially the same under both sets of standard conditions. We will include a superscripted “o” in the enthalpy change symbol to designate standard state. Since the usual (but not technically standard) temperature is 298.15 K, this temperature will be assumed unless some other temperature is specified. Thus, the symbol is used to indicate an enthalpy change for a process occurring under these conditions. (The symbol ΔH is used to indicate an enthalpy change for a reaction occurring under nonstandard conditions.)
The enthalpy changes for many types of chemical and physical processes are available in the reference literature, including those for combustion reactions, phase transitions, and formation reactions. As we discuss these quantities, it is important to pay attention to the extensive nature of enthalpy and enthalpy changes. Since the enthalpy change for a given reaction is proportional to the amounts of substances involved, it may be reported on that basis (i.e., as the ΔH for specific amounts of reactants). However, we often find it more useful to divide one extensive property (ΔH) by another (amount of substance), and report a per-amount intensive value of ΔH, often “normalized” to a per-mole basis. (Note that this is similar to determining the intensive property specific heat from the extensive property heat capacity, as seen previously.)
Standard enthalpy of combustion is the enthalpy change when 1 mole of a substance burns (combines vigorously with oxygen) under standard state conditions; it is sometimes called “heat of combustion.” For example, the enthalpy of combustion of ethanol, −1366.8 kJ/mol, is the amount of heat produced when one mole of ethanol undergoes complete combustion at 25 °C and 1 atmosphere pressure, yielding products also at 25 °C and 1 atm.
Enthalpies of combustion for many substances have been measured; a few of these are listed in Table 5.2. Many readily available substances with large enthalpies of combustion are used as fuels, including hydrogen, carbon (as coal or charcoal), and hydrocarbons (compounds containing only hydrogen and carbon), such as methane, propane, and the major components of gasoline.
As Figure 5.21 suggests, the combustion of gasoline is a highly exothermic process. Let us determine the approximate amount of heat produced by burning 1.00 L of gasoline, assuming the enthalpy of combustion of gasoline is the same as that of isooctane, a common component of gasoline. The density of isooctane is 0.692 g/mL.
Figure 5.21 The combustion of gasoline is very exothermic. (credit: modification of work by “AlexEagle”/Flickr)
Paul Flowers, Klaus Theopold, Richard Langley, and William R. Robinson, Chemistry 2E, OpenStax. (credit: modification of work by “AlexEagle”/Flickr) · CC BY-NC-SA 4.0
· Original image ↗ · Access for free ↗
Starting with a known amount (1.00 L of isooctane), we can perform conversions between units until we arrive at the desired amount of heat or energy. The enthalpy of combustion of isooctane provides one of the necessary conversions. Table 5.2 gives this value as −5460 kJ per 1 mole of isooctane (C8H18).
Using these data,
The combustion of 1.00 L of isooctane produces 33,100 kJ of heat. (This amount of energy is enough to melt 99.2 kg, or about 218 lbs, of ice.)
Note: If you do this calculation one step at a time, you would find:
Check Your Learning
How much heat is produced by the combustion of 125 g of acetylene?
Emerging Algae-Based Energy Technologies (Biofuels)
As reserves of fossil fuels diminish and become more costly to extract, the search is ongoing for replacement fuel sources for the future. Among the most promising biofuels are those derived from algae (Figure 5.22). The species of algae used are nontoxic, biodegradable, and among the world’s fastest growing organisms. About 50% of algal weight is oil, which can be readily converted into fuel such as biodiesel. Algae can yield 26,000 gallons of biofuel per hectare—much more energy per acre than other crops. Some strains of algae can flourish in brackish water that is not usable for growing other crops. Algae can produce biodiesel, biogasoline, ethanol, butanol, methane, and even jet fuel.
Figure 5.22 (a) Tiny algal organisms can be (b) grown in large quantities and eventually (c) turned into a useful fuel such as biodiesel. (credit a: modification of work by Micah Sittig; credit b: modification of work by Robert Kerton; credit c: modification of work by John F. Williams)
Paul Flowers, Klaus Theopold, Richard Langley, and William R. Robinson, Chemistry 2E, OpenStax. (credit a: modification of work by Micah Sittig; credit b: modification of work by Robert Kerton; credit c: modification of work by John F. Williams) · CC BY-NC-SA 4.0
· Original image ↗ · Access for free ↗
According to the US Department of Energy, only 39,000 square kilometers (about 0.4% of the land mass of the US or less than
of the area used to grow corn) can produce enough algal fuel to replace all the petroleum-based fuel used in the US. The cost of algal fuels is becoming more competitive—for instance, the US Air Force is producing jet fuel from algae at a total cost of under $5 per gallon.3 The process used to produce algal fuel is as follows: grow the algae (which use sunlight as their energy source and CO2 as a raw material); harvest the algae; extract the fuel compounds (or precursor compounds); process as necessary (e.g., perform a transesterificationreaction to make biodiesel); purify; and distribute (Figure 5.23).
Figure 5.23 Algae convert sunlight and carbon dioxide into oil that is harvested, extracted, purified, and transformed into a variety of renewable fuels.
A standard enthalpy of formation is an enthalpy change for a reaction in which exactly 1 mole of a pure substance is formed from free elements in their most stable states under standard state conditions. These values are especially useful for computing or predicting enthalpy changes for chemical reactions that are impractical or dangerous to carry out, or for processes for which it is difficult to make measurements. If we have values for the appropriate standard enthalpies of formation, we can determine the enthalpy change for any reaction, which we will practice in the next section on Hess’s law.
starting with the reactants at a pressure of 1 atm and 25 °C (with the carbon present as graphite, the most stable form of carbon under these conditions) and ending with one mole of CO2, also at 1 atm and 25 °C. For nitrogen dioxide, NO2(g), is 33.2 kJ/mol. This is the enthalpy change for the reaction:
A reaction equation with
mole of N2 and 1 mole of O2 is correct in this case because the standard enthalpy of formation always refers to 1 mole of product, NO2(g).
You will find a table of standard enthalpies of formation of many common substances in Appendix G. These values indicate that formation reactions range from highly exothermic (such as −2984 kJ/mol for the formation of P4O10) to strongly endothermic (such as +226.7 kJ/mol for the formation of acetylene, C2H2). By definition, the standard enthalpy of formation of an element in its most stable form is equal to zero under standard conditions, which is 1 atm for gases and 1 M for solutions.
Ozone, O3(g), forms from oxygen, O2(g), by an endothermic process. Ultraviolet radiation is the source of the energy that drives this reaction in the upper atmosphere. Assuming that both the reactants and products of the reaction are in their standard states, determine the standard enthalpy of formation, of ozone from the following information:
For the formation of 2 mol of O3(g), This ratio, can be used as a conversion factor to find the heat produced when 1 mole of O3(g) is formed, which is the enthalpy of formation for O3(g):
Therefore,
Check Your Learning
Hydrogen gas, H2, reacts explosively with gaseous chlorine, Cl2, to form hydrogen chloride, HCl(g). What is the enthalpy change for the reaction of 1 mole of H2(g) with 1 mole of Cl2(g) if both the reactants and products are at standard state conditions? The standard enthalpy of formation of HCl(g) is −92.3 kJ/mol.
There are two ways to determine the amount of heat involved in a chemical change: measure it experimentally, or calculate it from other experimentally determined enthalpy changes. Some reactions are difficult, if not impossible, to investigate and make accurate measurements for experimentally. And even when a reaction is not hard to perform or measure, it is convenient to be able to determine the heat involved in a reaction without having to perform an experiment.
This type of calculation usually involves the use of Hess’s law, which states: If a process can be written as the sum of several stepwise processes, the enthalpy change of the total process equals the sum of the enthalpy changes of the various steps. Hess’s law is valid because enthalpy is a state function: Enthalpy changes depend only on where a chemical process starts and ends, but not on the path it takes from start to finish. For example, we can think of the reaction of carbon with oxygen to form carbon dioxide as occurring either directly or by a two-step process. The direct process is written:
In the two-step process, first carbon monoxide is formed:
Then, carbon monoxide reacts further to form carbon dioxide:
The equation describing the overall reaction is the sum of these two chemical changes:
Because the CO produced in Step 1 is consumed in Step 2, the net change is:
The result is shown in Figure 5.24. We see that ΔH of the overall reaction is the same whether it occurs in one step or two. This finding (overall ΔH for the reaction = sum of ΔH values for reaction “steps” in the overall reaction) is true in general for chemical and physical processes.
Figure 5.24 The formation of CO 2 ( g ) from its elements can be thought of as occurring in two steps, which sum to the overall reaction, as described by Hess’s law. The horizontal blue lines represent enthalpies. For an exothermic process, the products are at lower enthalpy than are the reactants.
When 2 moles of NO2 (twice as much) are formed, the ΔH will be twice as large:
In general, if we multiply or divide an equation by a number, then the enthalpy change should also be multiplied or divided by the same number.
ΔH for a reaction in one direction is equal in magnitude and opposite in sign to ΔH for the reaction in the reverse direction. For example, given that:
Determine the enthalpy of formation,
of FeCl3(s) from the enthalpy changes of the following two-step process that occurs under standard state conditions:
We are trying to find the standard enthalpy of formation of FeCl3(s), which is equal to ΔH° for the reaction:
Looking at the reactions, we see that the reaction for which we want to find ΔH° is the sum of the two reactions with known ΔH values, so we must sum their ΔHs:
The enthalpy of formation, of FeCl3(s) is −399.5 kJ/mol.
Here is a less straightforward example that illustrates the thought process involved in solving many Hess’s law problems. It shows how we can find many standard enthalpies of formation (and other values of ΔH) if they are difficult to determine experimentally.
Our goal is to manipulate and combine reactions(ii), (iii), and (iv) such that they add up to reaction(i). Going from left to right in (i), we first see that ClF(g) is needed as a reactant. This can be obtained by multiplying reaction(iii) by which means that the ΔH° change is also multiplied by
Next, we see that F2 is also needed as a reactant. To get this, reverse and halve reaction(ii), which means that the ΔH° changes sign and is halved:
To get ClF3 as a product, reverse (iv), changing the sign of ΔH°:
Now check to make sure that these reactions add up to the reaction we want:
Reactants
and
cancel out product O2; product cancels reactant and reactant is cancelled by products and OF2. This leaves only reactants ClF(g) and F2(g) and product ClF3(g), which are what we want. Since summing these three modified reactions yields the reaction of interest, summing the three modified ΔH° values will give the desired ΔH°:
Check Your Learning
Aluminum chloride can be formed from its elements:
We also can use Hess’s law to determine the enthalpy change of any reaction if the corresponding enthalpies of formation of the reactants and products are available. The stepwise reactions we consider are: (i) decompositions of the reactants into their component elements (for which the enthalpy changes are proportional to the negative of the enthalpies of formation of the reactants), followed by (ii) re-combinations of the elements to give the products (with the enthalpy changes proportional to the enthalpies of formation of the products). The standard enthalpy change of the overall reaction is therefore equal to: (ii) the sum of the standard enthalpies of formation of all the products plus (i) the sum of the negatives of the standard enthalpies of formation of the reactants. This is usually rearranged slightly to be written as follows, with ∑ representing “the sum of” and n standing for the stoichiometric coefficients:
The following example shows in detail why this equation is valid, and how to use it to calculate the enthalpy change for a reaction of interest.
Use the special form of Hess’s law given previously, and values from Appendix G:
Solution: Supporting Why the General Equation Is Valid
Alternatively, we can write this reaction as the sum of the decompositions of 3NO2(g) and 1H2O(l) into their constituent elements, and the formation of 2HNO3(aq) and 1NO(g) from their constituent elements. Writing out these reactions, and noting their relationships to the values for these compounds (from Appendix G ), we have:
Summing these reaction equations gives the reaction we are interested in:
Summing their enthalpy changes gives the value we want to determine:
Note that this result was obtained by (1) multiplying the of each product by its stoichiometric coefficient and summing those values, (2) multiplying the of each reactant by its stoichiometric coefficient and summing those values, and then (3) subtracting the result found in (2) from the result found in (1). This is also the procedure in using the general equation, as shown.
Check Your Learning
Calculate the heat of combustion of 1 mole of ethanol, C2H5OH(l), when H2O(l) and CO2(g) are formed. Use the following enthalpies of formation: C2H5OH(l), −278 kJ/mol; H2O(l), −286 kJ/mol; and CO2(g), −394 kJ/mol.
OpenStax · 16.4 Free Energy ↗ Instructional page including learning objectives, examples, figures, source tables and questions. Site navigation and embedded media players are omitted; source media links remain available.
One of the challenges of using the second law of thermodynamics to determine if a process is spontaneous is that it requires measurements of the entropy change for the system and the entropy change for the surroundings. An alternative approach involving a new thermodynamic property defined in terms of system properties only was introduced in the late nineteenth century by American mathematician Josiah Willard Gibbs. This new property is called the Gibbs free energy (G) (or simply the free energy), and it is defined in terms of a system’s enthalpy and entropy as the following:
(For simplicity’s sake, the subscript “sys” will be omitted henceforth.)
The relationship between this system property and the spontaneity of a process may be understood by recalling the previously derived second law expression:
The first law requires that qsurr = −qsys, and at constant pressure qsys = ΔH, so this expression may be rewritten as:
Multiplying both sides of this equation by −T, and rearranging yields the following:
Comparing this equation to the previous one for free energy change shows the following relation:
The free energy change is therefore a reliable indicator of the spontaneity of a process, being directly related to the previously identified spontaneity indicator, ΔSuniv. Table 16.3 summarizes the relation between the spontaneity of a process and the arithmetic signs of these indicators.
Relation between Process Spontaneity and Signs of Thermodynamic Properties
In addition to indicating spontaneity, the free energy change also provides information regarding the amount of useful work (w) that may be accomplished by a spontaneous process. Although a rigorous treatment of this subject is beyond the scope of an introductory chemistry text, a brief discussion is helpful for gaining a better perspective on this important thermodynamic property.
For this purpose, consider a spontaneous, exothermic process that involves a decrease in entropy. The free energy change, as defined by
may be interpreted as representing the difference between the enthalpy change of the process, ΔH, and the energy lost to the surroundings, TΔS. The difference between the energy produced and the energy lost is the energy available (or “free”) to do useful work by the process, ΔG. If the process somehow could be made to take place under conditions of thermodynamic reversibility, the amount of work that could be done would be maximal:
where refers to all types of work except expansion (pressure-volume) work.
However, as noted previously in this chapter, such conditions are not realistic. In addition, the technologies used to extract work from a spontaneous process (e.g., batteries) are never 100% efficient, and so the work done by these processes is always less than the theoretical maximum. Similar reasoning may be applied to a nonspontaneous process, for which the free energy change represents the minimum amount of work that must be done on the system to carry out the process.
Free energy is a state function, so its value depends only on the conditions of the initial and final states of the system. A convenient and common approach to the calculation of free energy changes for physical and chemical reactions is by use of widely available compilations of standard state thermodynamic data. One method involves the use of standard enthalpies and entropies to compute standard free energy changes, ΔG°, according to the following relation.
Example
16.7
Using Standard Enthalpy and Entropy Changes to Calculate ΔG°
Use standard enthalpy and entropy data from Appendix G to calculate the standard free energy change for the vaporization of water at room temperature (298 K). What does the computed value for ΔG° say about the spontaneity of this process?
At 298 K (25 °C) so boiling is nonspontaneous (not spontaneous).
Check Your Learning
Use standard enthalpy and entropy data from Appendix G to calculate the standard free energy change for the reaction shown here (298 K). What does the computed value for ΔG° say about the spontaneity of this process?
Answer:
the reaction is nonspontaneous (not spontaneous) at 25 °C.
The standard free energy change for a reaction may also be calculated from standard free energy of formation ΔGf° values of the reactants and products involved in the reaction. The standard free energy of formation is the free energy change that accompanies the formation of one mole of a substance from its elements in their standard states. Similar to the standard enthalpy of formation, is by definition zero for elemental substances in their standard states. The approach used to calculate for a reaction from values is the same as that demonstrated previously for enthalpy and entropy changes. For the reaction
the standard free energy change at room temperature may be calculated as
Example
16.8
Using Standard Free Energies of Formation to Calculate ΔG°
Consider the decomposition of yellow mercury(II) oxide.
Calculate the standard free energy change at room temperature, using (a) standard free energies of formation and (b) standard enthalpies of formation and standard entropies. Do the results indicate the reaction to be spontaneous or nonspontaneous under standard conditions?
Both ways to calculate the standard free energy change at 25 °C give the same numerical value (to three significant figures), and both predict that the process is nonspontaneous (not spontaneous) at room temperature.
Check Your Learning
Calculate ΔG° using (a) free energies of formation and (b) enthalpies of formation and entropies (Appendix G). Do the results indicate the reaction to be spontaneous or nonspontaneous at 25 °C?
The use of free energies of formation to compute free energy changes for reactions as described above is possible because G is a state function, and the approach is analogous to the use of Hess’ Law in computing enthalpy changes (see the chapter on thermochemistry). Consider the vaporization of water as an example:
An equation representing this process may be derived by adding the formation reactions for the two phases of water (necessarily reversing the reaction for the liquid phase). The free energy change for the sum reaction is the sum of free energy changes for the two added reactions:
This approach may also be used in cases where a nonspontaneous reaction is enabled by coupling it to a spontaneous reaction. For example, the production of elemental zinc from zinc sulfide is thermodynamically unfavorable, as indicated by a positive value for ΔG°:
The industrial process for production of zinc from sulfidic ores involves coupling this decomposition reaction to the thermodynamically favorable oxidation of sulfur:
The coupled reaction exhibits a negative free energy change and is spontaneous:
This process is typically carried out at elevated temperatures, so this result obtained using standard free energy values is just an estimate. The gist of the calculation, however, holds true.
As was previously demonstrated in this chapter’s section on entropy, the spontaneity of a process may depend upon the temperature of the system. Phase transitions, for example, will proceed spontaneously in one direction or the other depending upon the temperature of the substance in question. Likewise, some chemical reactions can also exhibit temperature dependent spontaneities. To illustrate this concept, the equation relating free energy change to the enthalpy and entropy changes for the process is considered:
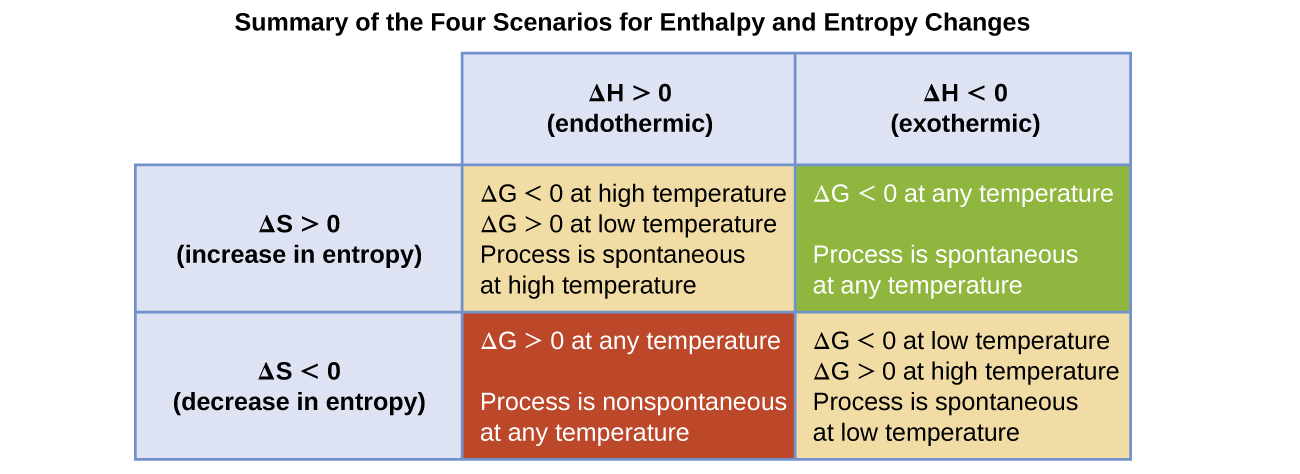
The spontaneity of a process, as reflected in the arithmetic sign of its free energy change, is then determined by the signs of the enthalpy and entropy changes and, in some cases, the absolute temperature. Since T is the absolute (kelvin) temperature, it can only have positive values. Four possibilities therefore exist with regard to the signs of the enthalpy and entropy changes:
Both ΔH and ΔS are positive. This condition describes an endothermic process that involves an increase in system entropy. In this case, ΔG will be negative if the magnitude of the TΔS term is greater than ΔH. If the TΔS term is less than ΔH, the free energy change will be positive. Such a process is spontaneous at high temperatures and nonspontaneous at low temperatures.
Both ΔH and ΔS are negative. This condition describes an exothermic process that involves a decrease in system entropy. In this case, ΔG will be negative if the magnitude of the TΔS term is less than ΔH. If the TΔS term’s magnitude is greater than ΔH, the free energy change will be positive. Such a process is spontaneous at low temperatures and nonspontaneous at high temperatures.
ΔH is positive and ΔS is negative. This condition describes an endothermic process that involves a decrease in system entropy. In this case, ΔG will be positive regardless of the temperature. Such a process is nonspontaneous at all temperatures.
ΔH is negative and ΔS is positive. This condition describes an exothermic process that involves an increase in system entropy. In this case, ΔG will be negative regardless of the temperature. Such a process is spontaneous at all temperatures.
These four scenarios are summarized in Figure 16.12.
Combustion processes are exothermic (ΔH < 0). This particular reaction involves an increase in entropy due to the accompanying increase in the amount of gaseous species (net gain of one mole of gas, ΔS > 0). The reaction is therefore spontaneous (ΔG < 0) at all temperatures.
Check Your Learning
Popular chemical hand warmers generate heat by the air-oxidation of iron:
How does the spontaneity of this process depend upon temperature?
Answer:
ΔH and ΔS are negative; the reaction is spontaneous at low temperatures.
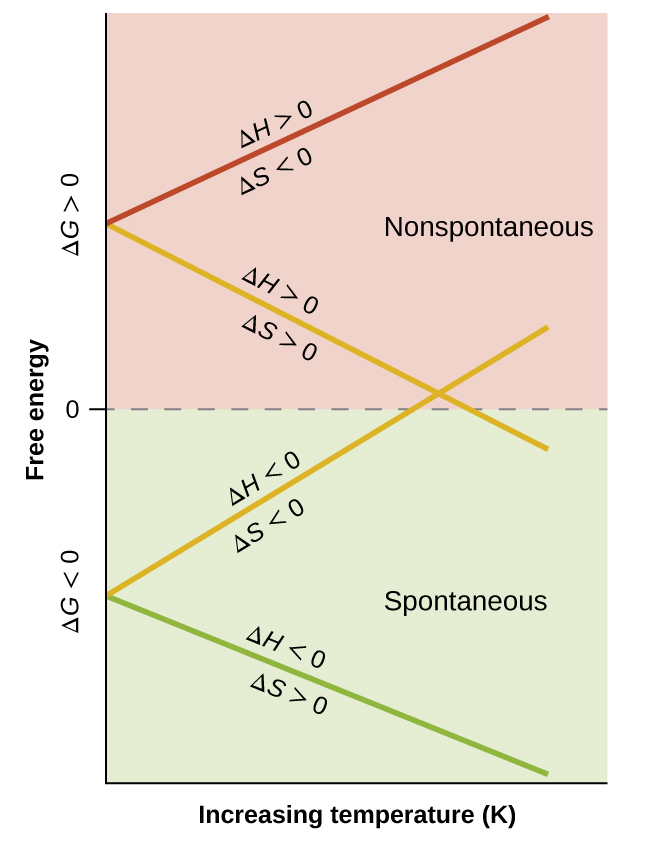
When considering the conclusions drawn regarding the temperature dependence of spontaneity, it is important to keep in mind what the terms “high” and “low” mean. Since these terms are adjectives, the temperatures in question are deemed high or low relative to some reference temperature. A process that is nonspontaneous at one temperature but spontaneous at another will necessarily undergo a change in “spontaneity” (as reflected by its ΔG) as temperature varies. This is clearly illustrated by a graphical presentation of the free energy change equation, in which ΔG is plotted on the y axis versus T on the x axis:
Such a plot is shown in Figure 16.13. A process whose enthalpy and entropy changes are of the same arithmetic sign will exhibit a temperature-dependent spontaneity as depicted by the two yellow lines in the plot. Each line crosses from one spontaneity domain (positive or negative ΔG) to the other at a temperature that is characteristic of the process in question. This temperature is represented by the x-intercept of the line, that is, the value of T for which ΔG is zero:
So, saying a process is spontaneous at “high” or “low” temperatures means the temperature is above or below, respectively, that temperature at which ΔG for the process is zero. As noted earlier, the condition of ΔG = 0 describes a system at equilibrium.
As defined in the chapter on liquids and solids, the boiling point of a liquid is the temperature at which its liquid and gaseous phases are in equilibrium (that is, when vaporization and condensation occur at equal rates). Use the information in Appendix G to estimate the boiling point of water.
The accepted value for water’s normal boiling point is 373.2 K (100.0 °C), and so this calculation is in reasonable agreement. Note that the values for enthalpy and entropy changes data used were derived from standard data at 298 K (Appendix G). If desired, you could obtain more accurate results by using enthalpy and entropy changes determined at (or at least closer to) the actual boiling point.
The free energy change for a process may be viewed as a measure of its driving force. A negative value for ΔG represents a driving force for the process in the forward direction, while a positive value represents a driving force for the process in the reverse direction. When ΔG is zero, the forward and reverse driving forces are equal, and the process occurs in both directions at the same rate (the system is at equilibrium).
In the chapter on equilibrium the reaction quotient, Q, was introduced as a convenient measure of the status of an equilibrium system. Recall that Q is the numerical value of the mass action expression for the system, and that you may use its value to identify the direction in which a reaction will proceed in order to achieve equilibrium. When Q is lesser than the equilibrium constant, K, the reaction will proceed in the forward direction until equilibrium is reached and Q = K. Conversely, if Q > K, the process will proceed in the reverse direction until equilibrium is achieved.
The free energy change for a process taking place with reactants and products present under nonstandard conditions (pressures other than 1 bar; concentrations other than 1 M) is related to the standard free energy change according to this equation:
Since the computed value for ΔG is positive, the reaction is nonspontaneous under these conditions.
Check Your Learning
Calculate the free energy change for this same reaction at 875 °C for a mixture containing each gas at a partial pressure of 1.88 atm. Is the reaction spontaneous under these conditions?
Given that the standard free energies of formation of Ag+(aq), Cl−(aq), and AgCl(s) are 77.1 kJ/mol, −131.2 kJ/mol, and −109.8 kJ/mol, respectively, calculate the solubility product, Ksp, for AgCl.
To further illustrate the relation between these two essential thermodynamic concepts, consider the observation that reactions spontaneously proceed in a direction that ultimately establishes equilibrium. As may be shown by plotting the free energy versus the extent of the reaction (for example, as reflected in the value of Q), equilibrium is established when the system’s free energy is minimized (Figure 16.14). If a system consists of reactants and products in nonequilibrium amounts (Q ≠ K), the reaction will proceed spontaneously in the direction necessary to establish equilibrium.
Figure 16.14 These plots show the free energy versus reaction progress for systems whose standard free energy changes are (a) negative, (b) positive, and (c) zero. Nonequilibrium systems will proceed spontaneously in whatever direction is necessary to minimize free energy and establish equilibrium.
OpenStax · 10.4 Phase Diagrams ↗ Instructional page including learning objectives, examples, figures, source tables and questions. Site navigation and embedded media players are omitted; source media links remain available.
Learning Objectives
By the end of this section, you will be able to:
Explain the construction and use of a typical phase diagram
Use phase diagrams to identify stable phases at given temperatures and pressures, and to describe phase transitions resulting from changes in these properties
Describe the supercritical fluid phase of matter
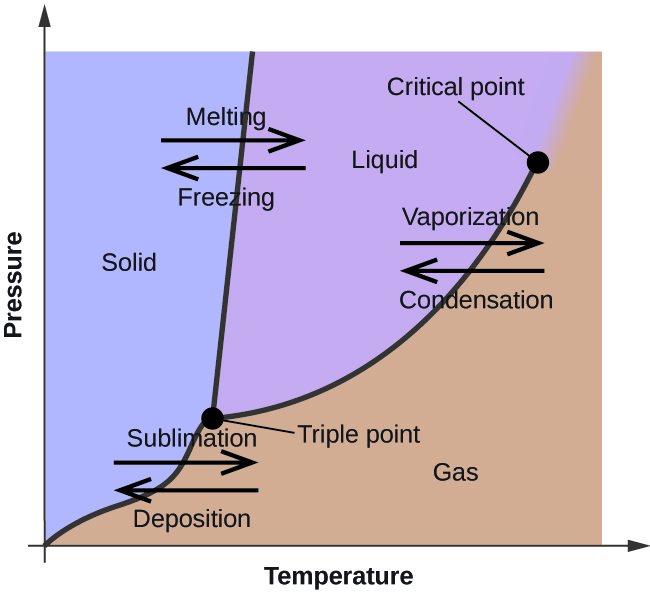
In the previous module, the variation of a liquid’s equilibriumvapor pressure with temperature was described. Considering the definition of boiling point, plots of vapor pressure versus temperature represent how the boiling point of the liquid varies with pressure. Also described was the use of heating and cooling curves to determine a substance’s melting (or freezing) point. Making such measurements over a wide range of pressures yields data that may be presented graphically as a phase diagram. A phase diagram combines plots of pressure versus temperature for the liquid-gas, solid-liquid, and solid-gas phase-transition equilibria of a substance. These diagrams indicate the physical states that exist under specific conditions of pressure and temperature, and also provide the pressure dependence of the phase-transition temperatures (melting points, sublimation points, boiling points). A typical phase diagram for a pure substance is shown in Figure 10.30.
Figure 10.30 — 10.4 Phase Diagrams
Figure 10.30 The physical state of a substance and its phase-transition temperatures are represented graphically in a phase diagram.
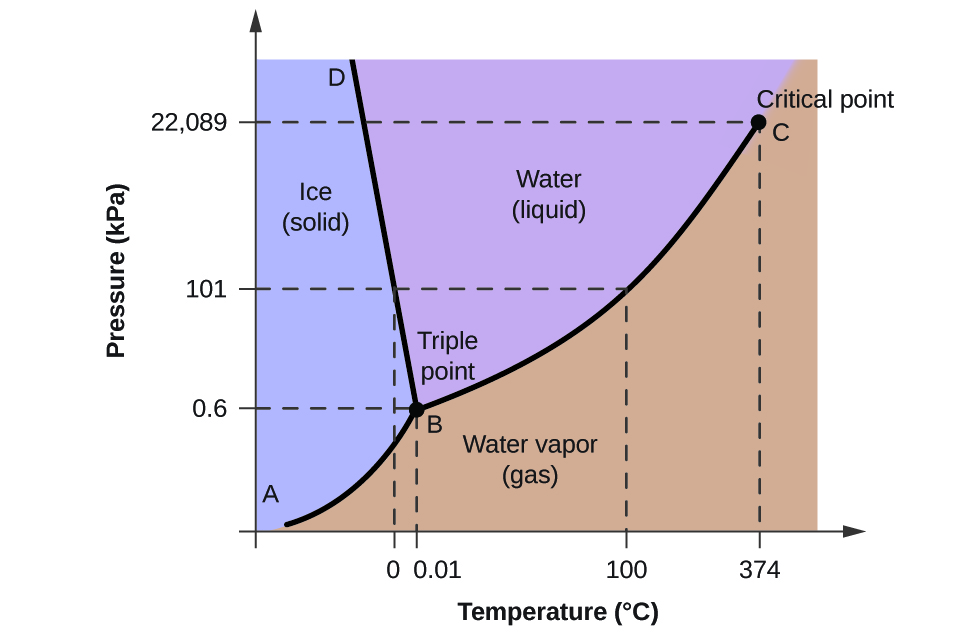
To illustrate the utility of these plots, consider the phase diagram for water shown in Figure 10.31.
Figure 10.31 — 10.4 Phase Diagrams
Figure 10.31 The pressure and temperature axes on this phase diagram of water are not drawn to constant scale in order to illustrate several important properties.
We can use the phase diagram to identify the physical state of a sample of water under specified conditions of pressure and temperature. For example, a pressure of 50 kPa and a temperature of −10 °C correspond to the region of the diagram labeled “ice.” Under these conditions, water exists only as a solid (ice). A pressure of 50 kPa and a temperature of 50 °C correspond to the “water” region—here, water exists only as a liquid. At 25 kPa and 200 °C, water exists only in the gaseous state. Note that on the H2O phase diagram, the pressure and temperature axes are not drawn to a constant scale in order to permit the illustration of several important features as described here.
The curve BC in Figure 10.31 is the plot of vapor pressure versus temperature as described in the previous module of this chapter. This “liquid-vapor” curve separates the liquid and gaseous regions of the phase diagram and provides the boiling point for water at any pressure. For example, at 1 atm, the boiling point is 100 °C. Notice that the liquid-vapor curve terminates at a temperature of 374 °C and a pressure of 218 atm, indicating that water cannot exist as a liquid above this temperature, regardless of the pressure. The physical properties of water under these conditions are intermediate between those of its liquid and gaseous phases. This unique state of matter is called a supercritical fluid, a topic that will be described in the next section of this module.
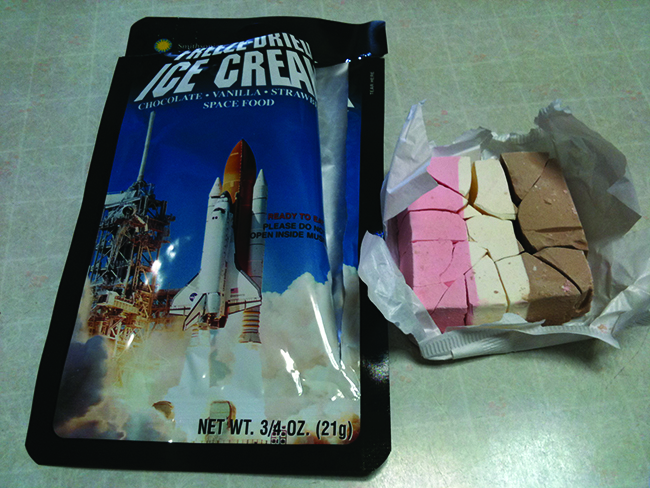
The solid-vapor curve, labeled AB in Figure 10.31, indicates the temperatures and pressures at which ice and water vapor are in equilibrium. These temperature-pressure data pairs correspond to the sublimation, or deposition, points for water. If we could zoom in on the solid-gas line in Figure 10.31, we would see that ice has a vapor pressure of about 0.20 kPa at −10 °C. Thus, if we place a frozen sample in a vacuum with a pressure less than 0.20 kPa, ice will sublime. This is the basis for the “freeze-drying” process often used to preserve foods, such as the ice cream shown in Figure 10.32.
Figure 10.32 — 10.4 Phase Diagrams
Figure 10.32 Freeze-dried foods, like this ice cream, are dehydrated by sublimation at pressures below the triple point for water. (credit: ʺlwaoʺ/Flickr)
The solid-liquid curve labeled BD shows the temperatures and pressures at which ice and liquid water are in equilibrium, representing the melting/freezing points for water. Note that this curve exhibits a slight negative slope (greatly exaggerated for clarity), indicating that the melting point for water decreases slightly as pressure increases. Water is an unusual substance in this regard, as most substances exhibit an increase in melting point with increasing pressure. This behavior is partly responsible for the movement of glaciers, like the one shown in Figure 10.33. The bottom of a glacier experiences an immense pressure due to its weight that can melt some of the ice, forming a layer of liquid water on which the glacier may more easily slide.
Figure 10.33 — 10.4 Phase Diagrams
Figure 10.33 The immense pressures beneath glaciers result in partial melting to produce a layer of water that provides lubrication to assist glacial movement. This satellite photograph shows the advancing edge of the Perito Moreno glacier in Argentina. (credit: NASA)
The point of intersection of all three curves is labeled B in Figure 10.31. At the pressure and temperature represented by this point, three phases of water coexist in equilibrium. This temperature-pressure data pair is called the triple point. At pressures lower than the triple point, water cannot exist as a liquid, regardless of the temperature.
Example
10.11
Determining the State of Water
Using the phase diagram for water given in Figure 10.31, determine the state of water at the following temperatures and pressures:
Using the phase diagram for water, we can determine that the state of water at each temperature and pressure given are as follows: (a) solid; (b) liquid; (c) liquid; (d) gas; (e) solid; (f) gas.
Check Your Learning
What phase changes can water undergo as the temperature changes if the pressure is held at 0.3 kPa? If the pressure is held at 50 kPa?
Answer:
At 0.3 kPa: at −58 °C. At 50 kPa: at 0 °C, l ⟶ g at 78 °C
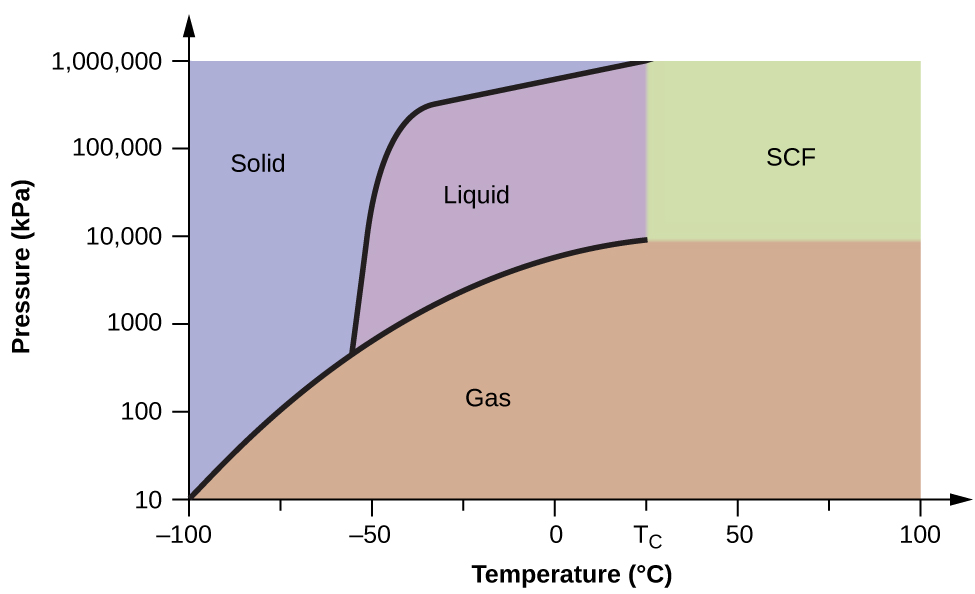
Consider the phase diagram for carbon dioxide shown in Figure 10.34 as another example. The solid-liquid curve exhibits a positive slope, indicating that the melting point for CO2 increases with pressure as it does for most substances (water being a notable exception as described previously). Notice that the triple point is well above 1 atm, indicating that carbon dioxide cannot exist as a liquid under ambient pressure conditions. Instead, cooling gaseous carbon dioxide at 1 atm results in its deposition into the solid state. Likewise, solid carbon dioxide does not melt at 1 atm pressure but instead sublimes to yield gaseous CO2. Finally, notice that the critical point for carbon dioxide is observed at a relatively modest temperature and pressure in comparison to water.
Figure 10.34 — 10.4 Phase Diagrams
Figure 10.34 A phase diagram for carbon dioxide is shown. The pressure axis is plotted on a logarithmic scale to accommodate the large range of values.
Using the phase diagram for carbon dioxide provided, we can determine that the state of CO2 at each temperature and pressure given are as follows: (a) liquid; (b) solid; (c) gas; (d) liquid; (e) gas; (f) gas.
Check Your Learning
Identify the phase changes that carbon dioxide will undergo as its temperature is increased from −100 °C while holding its pressure constant at 1500 kPa. At 50 kPa. At what approximate temperatures do these phase changes occur?
Answer:
at 1500 kPa: at −55 °C, at −10 °C;
at 50 kPa: at −60 °C
Supercritical Fluids
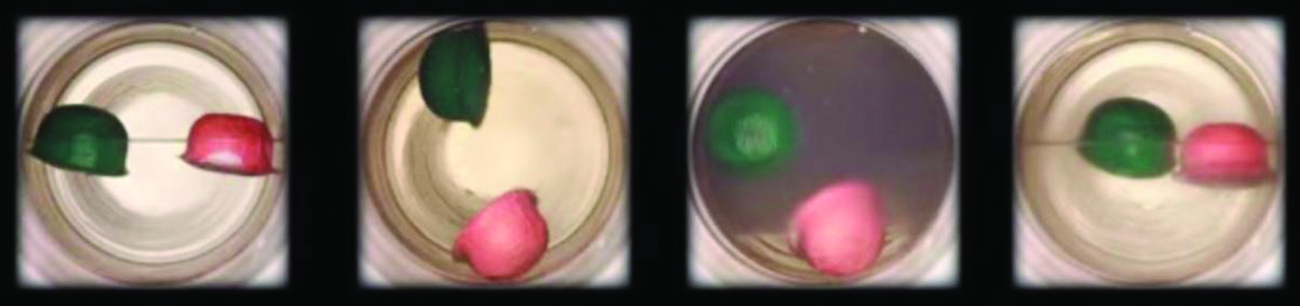
If we place a sample of water in a sealed container at 25 °C, remove the air, and let the vaporization-condensationequilibrium establish itself, we are left with a mixture of liquid water and water vapor at a pressure of 0.03 atm. A distinct boundary between the more dense liquid and the less dense gas is clearly observed. As we increase the temperature, the pressure of the water vapor increases, as described by the liquid-gas curve in the phase diagram for water (Figure 10.31), and a two-phase equilibrium of liquid and gaseous phases remains. At a temperature of 374 °C, the vapor pressure has risen to 218 atm, and any further increase in temperature results in the disappearance of the boundary between liquid and vapor phases. All of the water in the container is now present in a single phase whose physical properties are intermediate between those of the gaseous and liquid states. This phase of matter is called a supercritical fluid, and the temperature and pressure above which this phase exists is the critical point (Figure 10.35). Above its critical temperature, a gas cannot be liquefied no matter how much pressure is applied. The pressure required to liquefy a gas at its critical temperature is called the critical pressure. The critical temperatures and critical pressures of some common substances are given in the following table.
Substance
Critical Temperature (°C)
Critical Pressure (kPa)
hydrogen
−240.0
1300
nitrogen
−147.2
3400
oxygen
−118.9
5000
carbon dioxide
31.1
7400
ammonia
132.4
11,300
sulfur dioxide
157.2
7800
water
374.0
22,000
Figure 10.35 — 10.4 Phase Diagrams
Figure 10.35 (a) A sealed container of liquid carbon dioxide slightly below its critical point is heated, resulting in (b) the formation of the supercritical fluid phase. Cooling the supercritical fluid lowers its temperature and pressure below the critical point, resulting in the reestablishment of separate liquid and gaseous phases (c and d). Colored floats illustrate differences in density between the liquid, gaseous, and supercritical fluid states. (credit: modification of work by “mrmrobin”/YouTube)
Paul Flowers, Klaus Theopold, Richard Langley, and William R. Robinson, Chemistry 2E, OpenStax. (credit: modification of work by “mrmrobin”/YouTube) · CC BY-NC-SA 4.0
· Original image ↗ · Access for free ↗
Like a gas, a supercritical fluid will expand and fill a container, but its density is much greater than typical gas densities, typically being close to those for liquids. Similar to liquids, these fluids are capable of dissolving nonvolatile solutes. They exhibit essentially no surface tension and very low viscosities, however, so they can more effectively penetrate very small openings in a solid mixture and remove soluble components. These properties make supercritical fluids extremely useful solvents for a wide range of applications. For example, supercritical carbon dioxide has become a very popular solvent in the food industry, being used to decaffeinate coffee, remove fats from potato chips, and extract flavor and fragrance compounds from citrus oils. It is nontoxic, relatively inexpensive, and not considered to be a pollutant. After use, the CO2 can be easily recovered by reducing the pressure and collecting the resulting gas.
Example
10.13
The Critical Temperature of Carbon Dioxide
If we shake a carbon dioxide fire extinguisher on a cool day (18 °C), we can hear liquid CO2 sloshing around inside the cylinder. However, the same cylinder appears to contain no liquid on a hot summer day (35 °C). Explain these observations.
On the cool day, the temperature of the CO2 is below the critical temperature of CO2, 304 K or 31 °C, so liquid CO2 is present in the cylinder. On the hot day, the temperature of the CO2 is greater than its critical temperature of 31 °C. Above this temperature no amount of pressure can liquefy CO2 so no liquid CO2 exists in the fire extinguisher.
Check Your Learning
Ammonia can be liquefied by compression at room temperature; oxygen cannot be liquefied under these conditions. Why do the two gases exhibit different behavior?
Answer:
The critical temperature of ammonia is 405.5 K, which is higher than room temperature. The critical temperature of oxygen is below room temperature; thus oxygen cannot be liquefied at room temperature.
Chemistry in Everyday Life
Decaffeinating Coffee Using Supercritical CO2
Coffee is the world’s second most widely traded commodity, following only petroleum. Across the globe, people love coffee’s aroma and taste. Many of us also depend on one component of coffee—caffeine—to help us get going in the morning or stay alert in the afternoon. But late in the day, coffee’s stimulant effect can keep you from sleeping, so you may choose to drink decaffeinated coffee in the evening.
Since the early 1900s, many methods have been used to decaffeinate coffee. All have advantages and disadvantages, and all depend on the physical and chemical properties of caffeine. Because caffeine is a somewhat polarmolecule, it dissolves well in water, a polar liquid. However, since many of the other 400-plus compounds that contribute to coffee’s taste and aroma also dissolve in H2O, hot water decaffeination processes can also remove some of these compounds, adversely affecting the smell and taste of the decaffeinated coffee. Dichloromethane (CH2Cl2) and ethyl acetate (CH3CO2C2H5) have similar polarity to caffeine, and are therefore very effective solvents for caffeine extraction, but both also remove some flavor and aroma components, and their use requires long extraction and cleanup times. Because both of these solvents are toxic, health concerns have been raised regarding the effect of residual solvent remaining in the decaffeinated coffee.
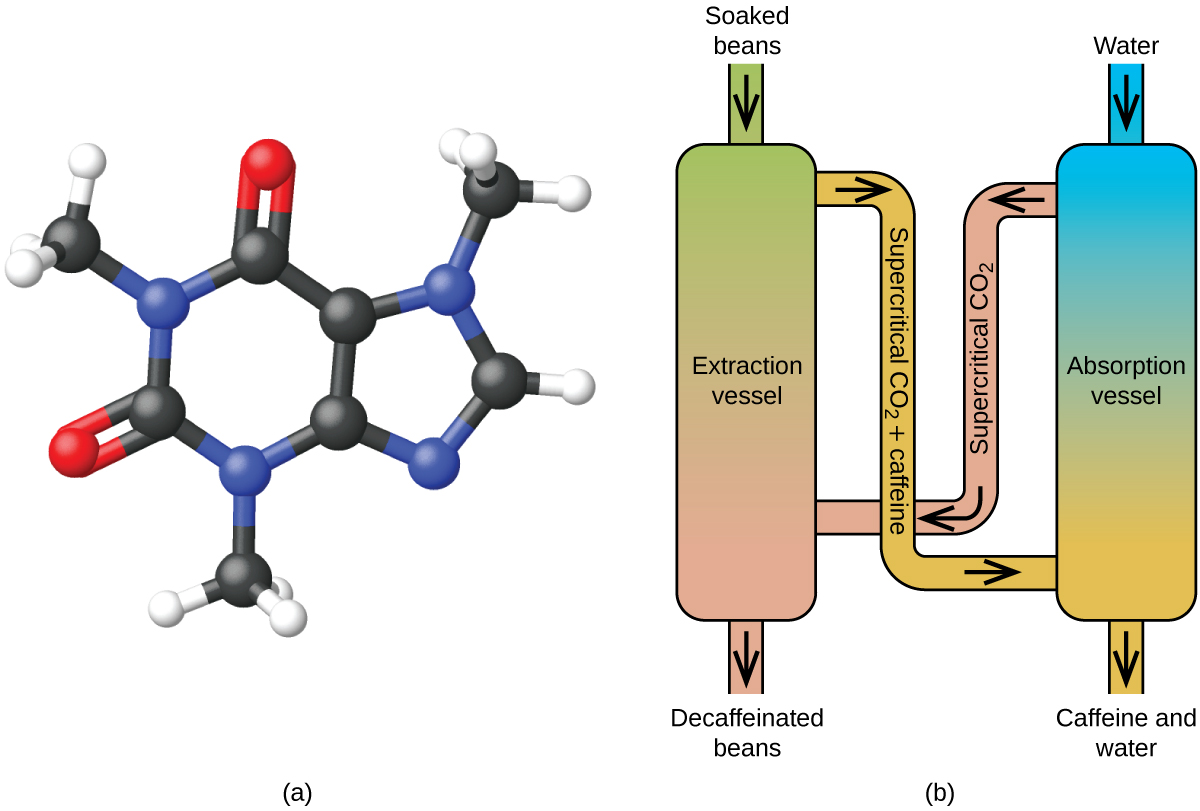
Supercritical fluid extraction using carbon dioxide is now being widely used as a more effective and environmentally friendly decaffeination method (Figure 10.36). At temperatures above 304.2 K and pressures above 7376 kPa, CO2 is a supercritical fluid, with properties of both gas and liquid. Like a gas, it penetrates deep into the coffee beans; like a liquid, it effectively dissolves certain substances. Supercritical carbon dioxide extraction of steamed coffee beans removes 97−99% of the caffeine, leaving coffee’s flavor and aroma compounds intact. Because CO2 is a gas under standard conditions, its removal from the extracted coffee beans is easily accomplished, as is the recovery of the caffeine from the extract. The caffeine recovered from coffee beans via this process is a valuable product that can be used subsequently as an additive to other foods or drugs.
Figure 10.36 — 10.4 Phase Diagrams
Figure 10.36 (a) Caffeine molecules have both polar and nonpolar regions, making it soluble in solvents of varying polarities. (b) The schematic shows a typical decaffeination process involving supercritical carbon dioxide.