For aA + bB ⇌ cC + dD, K = aCᶜaDᵈ/(aAᵃaBᵇ) using dimensionless activities relative to standard states. Introductory dilute models replace activities with appropriately standardized concentrations or partial pressures. Pure solids and pure liquids have unit activity and are omitted. The reaction quotientQ uses current values: Q < K favors net forward reaction, Q > K reverse, and Q = K equilibrium. Reversing the equation inverts K; multiplying all coefficients by n raises K to the nth power. Adding reactions multiplies their equilibrium constants.
At fixed temperature, adding a reactant changes Q and can shift composition without changing K. Compressing an ideal gas mixture at fixed temperature favors the side with fewer gas moles when counts differ; adding an inert gas at fixed volume leaves reactive partial pressures unchanged. At fixed total pressure, inert-gas addition expands volume and can shift gas equilibria. Temperature changes K: heating generally favors the endothermic direction. ΔG° = −RT ln K connects standard free energy with equilibrium, while ΔG = RT ln(Q/K) gives direction at the actual composition. A catalyst changes equilibration speed, not K.
Try before revealing the answer. For N₂O₄(g) ⇌ 2NO₂(g), a mixture has Q = 0.10 while K = 0.40 at the stated temperature. Predict the initial net direction and the effect of compressing an equilibrium mixture at constant temperature.
Worked answer
Because Q < K, the nonequilibrium mixture initially forms more NO₂. Compression of an equilibrium mixture favors the side with fewer gas molecules, N₂O₄. K stays unchanged at constant temperature; the composition changes until Q again equals K.
Figure 16.14 These plots show the free energy versus reaction progress for systems whose standard free energy changes are (a) negative, (b) positive, and (c) zero. Nonequilibrium systems will proceed spontaneously in whatever direction is necessary to minimize free energy and establish equilibrium.
A nitrogen-containing functional group. A free amino acid’s amino group is typically protonated (NH₃⁺) near physiological pH; proline’s ring nitrogen is an exception to this formula.
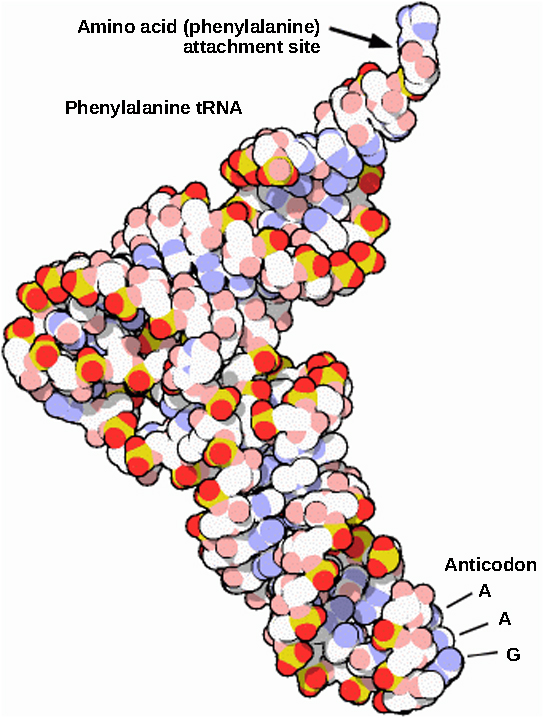
Figure 15.14 This is a space-filling model of a tRNA molecule that adds the amino acid phenylalanine to a growing polypeptide chain. The anticodon AAG binds the Codon UUC on the mRNA. The amino acid phenylalanine is attached to the other end of the tRNA.
Figure 15.4 This figure shows the genetic code for translating each nucleotide triplet in mRNA into an amino acid or a termination signal in a protein. (credit: modification of work by NIH)
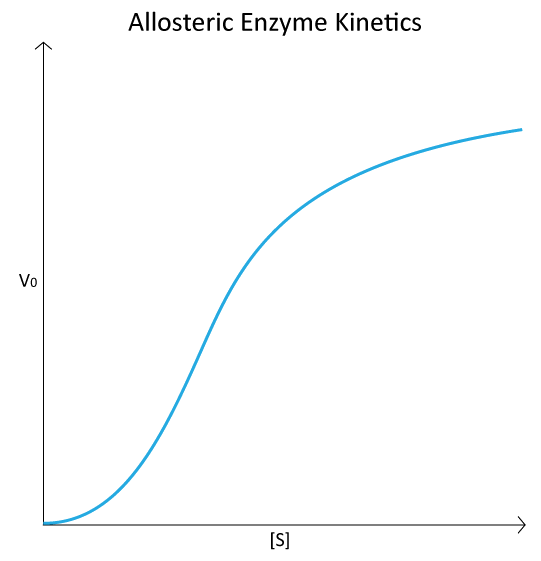
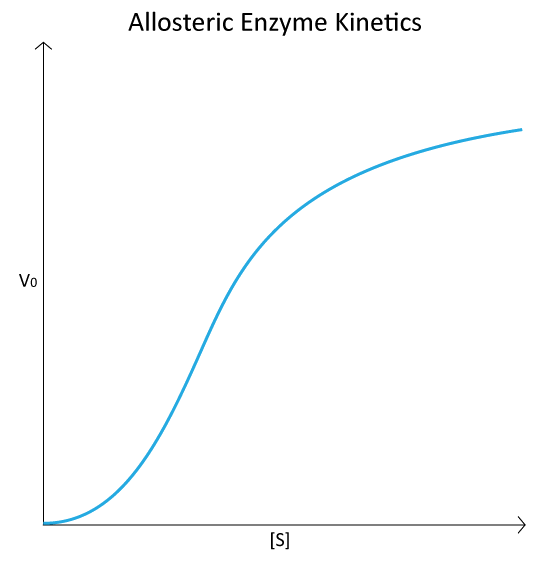
Figure 4.44 - Kinetic profile of an allosteric enzyme whose activity is controlled by a homotropic effector. Image by Aleia Kim
Kevin Ahern, Indira Rajagopal, and Taralyn Tan, Biochemistry Free For All, Oregon State University, via Biology LibreTexts. Image by Aleia Kim · CC BY-NC-SA 4.0
· Original image ↗ · Access for free ↗
An electrical property that can be positive or negative. Opposite charges attract and like charges repel; net charge is the sum of all charges on a particle.
Figure 12.19 Reaction diagrams for an endothermic process in the absence (red curve) and presence (blue curve) of a catalyst. The catalyzed pathway involves a two-step mechanism (note the presence of two transition states) and an intermediate species (represented by the valley between the two transitions states).
The difference in enthalpy between products and reactants. At constant pressure with only pressure–volume work, it equals the heat transferred to the system.
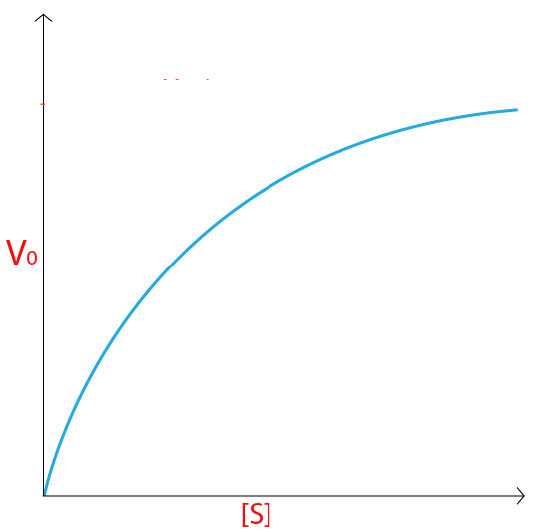
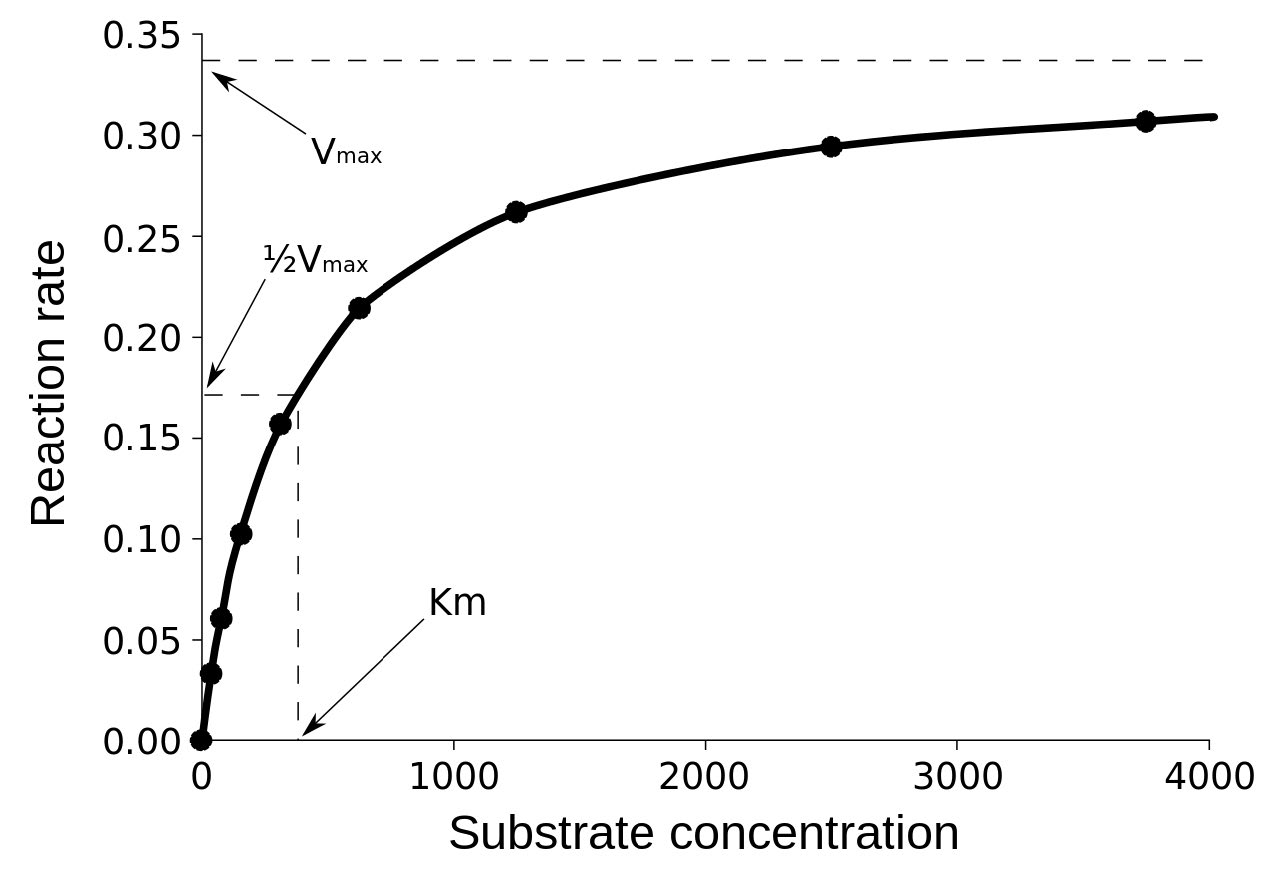
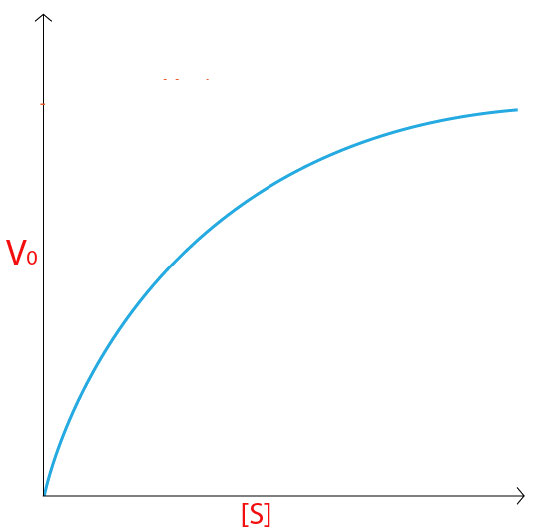
Figure 4.18 - Kinetics of an enzyme obeying Michaelis-Menten kinetics. Image by Aleia Kim
Kevin Ahern, Indira Rajagopal, and Taralyn Tan, Biochemistry Free For All, Oregon State University, via Biology LibreTexts. Image by Aleia Kim · CC BY-NC-SA 4.0
· Original image ↗ · Access for free ↗
Equilibrium
A state where opposing processes occur at equal rates, so macroscopic concentrations or other properties remain constant.
A ratio of product to reactant activities at equilibrium, each raised to its stoichiometric coefficient. At a fixed temperature, a catalyst does not change this ratio.
Figure 15.11 Eukaryotic pre-mRNA processing. In addition to 5’ Cap and 3’ Poly-A Tail addition, introns must be precisely removed and exons joined to generate a functional mRNA. Nucleotides upstream (towards the 5’cap) of the translation START codon are part of the 5’ untranslated region (5’ UTR). Nucleotides downstream (towards 3’end) of the STOP codon form the 3’ UTR. Both 5’ and 3’ UTRs are important for regulating translation initiation and mRNA stability. Credit: Rao, A., Ryan, K. Fletcher, S. and Tag, A. Department of Biology, Texas A&M University.
Rao, A., Ryan, K. Fletcher, S. and Tag, A. Department of Biology, Texas A&M University.; Mary Ann Clark, Matthew Douglas, and Jung Choi, Biology 2e, OpenStax. · CC BY-NC-SA 4.0
· Original image ↗ · Access for free ↗
A thermodynamic quantity used to predict whether a process is favorable at constant temperature and pressure. A negative change favors the forward process.
The change in Gibbs free energy during a process. At constant temperature and pressure, a negative value favors the forward reaction under the stated conditions; it does not specify reaction speed.
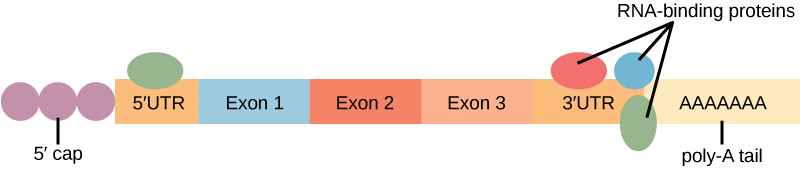
Figure 16.13 RNA-binding proteins. The protein-coding region of this processed mRNA is flanked by 5' and 3' untranslated regions (UTRs). The presence of RNA-binding proteins at the 5' or 3' UTR influences the stability of the RNA molecule.
Figure 4.18 - Kinetics of an enzyme obeying Michaelis-Menten kinetics. Image by Aleia Kim
Kevin Ahern, Indira Rajagopal, and Taralyn Tan, Biochemistry Free For All, Oregon State University, via Biology LibreTexts. Image by Aleia Kim · CC BY-NC-SA 4.0
· Original image ↗ · Access for free ↗
ideal gas
Model gas with negligible particle volume and negligible intermolecular interactions.
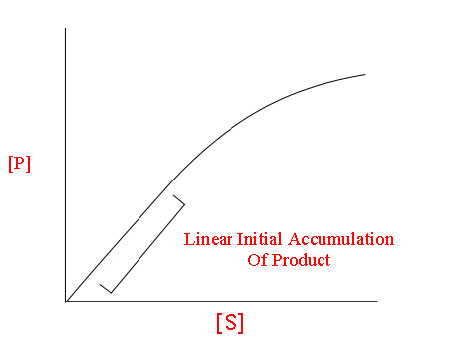
The early rate of product formation, measured before substantial substrate depletion or product accumulation, usually after the brief binding transient.
Figure 4.18 - Kinetics of an enzyme obeying Michaelis-Menten kinetics. Image by Aleia Kim
Kevin Ahern, Indira Rajagopal, and Taralyn Tan, Biochemistry Free For All, Oregon State University, via Biology LibreTexts. Image by Aleia Kim · CC BY-NC-SA 4.0
· Original image ↗ · Access for free ↗
Figure 15.11 Eukaryotic pre-mRNA processing. In addition to 5’ Cap and 3’ Poly-A Tail addition, introns must be precisely removed and exons joined to generate a functional mRNA. Nucleotides upstream (towards the 5’cap) of the translation START codon are part of the 5’ untranslated region (5’ UTR). Nucleotides downstream (towards 3’end) of the STOP codon form the 3’ UTR. Both 5’ and 3’ UTRs are important for regulating translation initiation and mRNA stability. Credit: Rao, A., Ryan, K. Fletcher, S. and Tag, A. Department of Biology, Texas A&M University.
Rao, A., Ryan, K. Fletcher, S. and Tag, A. Department of Biology, Texas A&M University.; Mary Ann Clark, Matthew Douglas, and Jung Choi, Biology 2e, OpenStax. · CC BY-NC-SA 4.0
· Original image ↗ · Access for free ↗
The exponent needed to obtain a number from a chosen fixed number. For decimal logarithms, log₁₀(100) = 2 because 10² = 100; pH uses the negative decimal logarithm of hydrogen ion activity.
A thin boundary or sheet. Cell membranes are lipid bilayers containing proteins; blotting membranes are synthetic supports that hold proteins or nucleic acids for detection.
Figure 15.11 Eukaryotic pre-mRNA processing. In addition to 5’ Cap and 3’ Poly-A Tail addition, introns must be precisely removed and exons joined to generate a functional mRNA. Nucleotides upstream (towards the 5’cap) of the translation START codon are part of the 5’ untranslated region (5’ UTR). Nucleotides downstream (towards 3’end) of the STOP codon form the 3’ UTR. Both 5’ and 3’ UTRs are important for regulating translation initiation and mRNA stability. Credit: Rao, A., Ryan, K. Fletcher, S. and Tag, A. Department of Biology, Texas A&M University.
Rao, A., Ryan, K. Fletcher, S. and Tag, A. Department of Biology, Texas A&M University.; Mary Ann Clark, Matthew Douglas, and Jung Choi, Biology 2e, OpenStax. · CC BY-NC-SA 4.0
· Original image ↗ · Access for free ↗
Figure 4.18 - Kinetics of an enzyme obeying Michaelis-Menten kinetics. Image by Aleia Kim
Kevin Ahern, Indira Rajagopal, and Taralyn Tan, Biochemistry Free For All, Oregon State University, via Biology LibreTexts. Image by Aleia Kim · CC BY-NC-SA 4.0
· Original image ↗ · Access for free ↗
Figure 12.19 Reaction diagrams for an endothermic process in the absence (red curve) and presence (blue curve) of a catalyst. The catalyzed pathway involves a two-step mechanism (note the presence of two transition states) and an intermediate species (represented by the valley between the two transitions states).
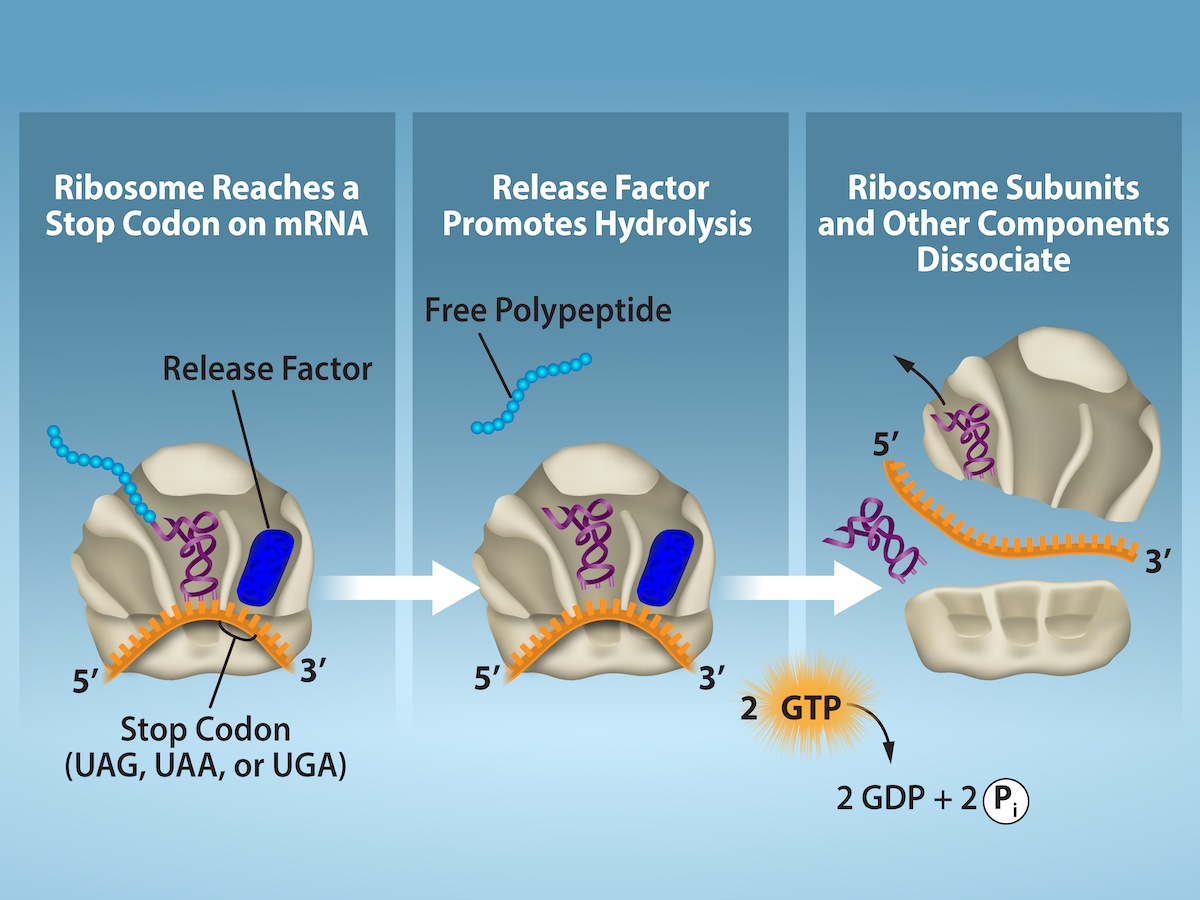
Figure 15.19 Translation Termination is Active. Translation is terminated when a STOP codon is in the A-site of the ribosome. Since there are no tRNAs corresponding to the STOP codons, the Release Factor protein enters and catalyzes the hydrolysis between the last amino acid and its tRNA. This hydrolysis releases the free carboxyl terminus (C-term) of the protein. Additional factors use the energy in GTP hydrolysis to disassemble the large and small ribosomal subunits and mRNA. Credit: Rao, A. and Ryan, K. Department of Biology, Texas A&M University.
Rao, A. and Ryan, K. Department of Biology, Texas A&M University.; Mary Ann Clark, Matthew Douglas, and Jung Choi, Biology 2e, OpenStax. · CC BY-NC-SA 4.0
· Original image ↗ · Access for free ↗
reversible process
Ideal process proceeding through equilibrium states and reversible by an infinitesimal change.
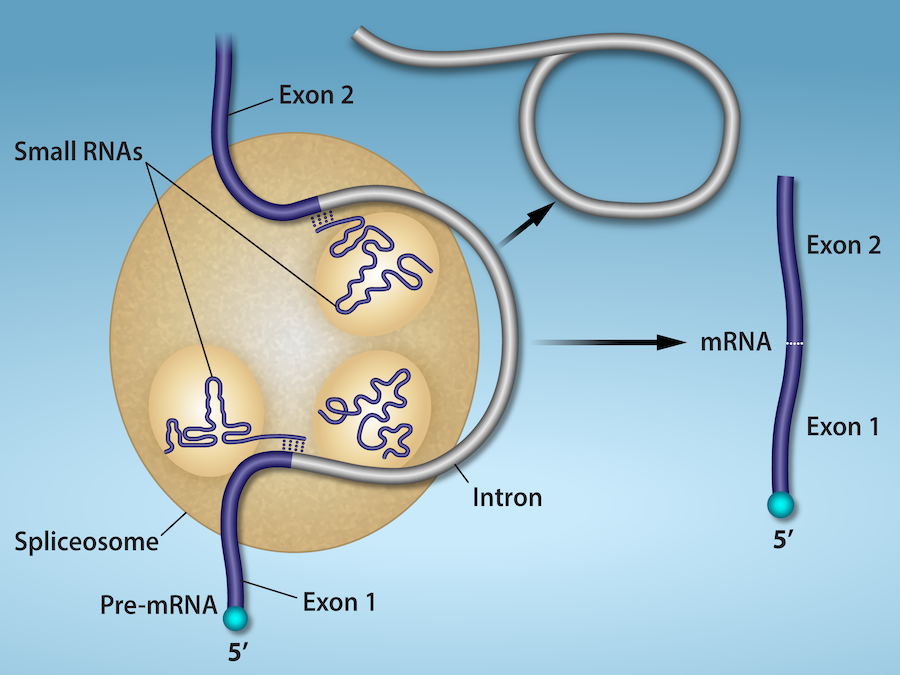
Figure 15.13 Pre-mRNA splicing involves the precise removal of introns from the primary RNA transcript. The splicing process is catalyzed by protein complexes called spliceosomes that are composed of proteins and RNA molecules called small nuclear RNAs (snRNAs). Spliceosomes recognize sequences at the 5' and 3' end of the intron. Rao, A. and Ryan, K. Department of Biology, Texas A&M University.
Rao, A. and Ryan, K. Department of Biology, Texas A&M University.; Mary Ann Clark, Matthew Douglas, and Jung Choi, Biology 2e, OpenStax. · CC BY-NC-SA 4.0
· Original image ↗ · Access for free ↗
RNA stability
Persistence of an RNA before degradation; greater stability generally means a longer lifetime or half-life under specified conditions.
Figure 16.13 RNA-binding proteins. The protein-coding region of this processed mRNA is flanked by 5' and 3' untranslated regions (UTRs). The presence of RNA-binding proteins at the 5' or 3' UTR influences the stability of the RNA molecule.
Figure 4.44 - Kinetic profile of an allosteric enzyme whose activity is controlled by a homotropic effector. Image by Aleia Kim
Kevin Ahern, Indira Rajagopal, and Taralyn Tan, Biochemistry Free For All, Oregon State University, via Biology LibreTexts. Image by Aleia Kim · CC BY-NC-SA 4.0
· Original image ↗ · Access for free ↗
Figure 7.45 - Non-homologous end joining (left) versus homologous recombination (right) - Wikipedia
Wikipedia, as credited by Kevin Ahern, Indira Rajagopal, and Taralyn Tan, Biochemistry Free For All, Oregon State University, via Biology LibreTexts. · Source attribution
· Original image ↗ · Access for free ↗
The amount of a substance that can dissolve in a solvent under specified conditions. Soluble means able to dissolve; insoluble means only very slightly soluble in that solvent.
Figure 15.4 This figure shows the genetic code for translating each nucleotide triplet in mRNA into an amino acid or a termination signal in a protein. (credit: modification of work by NIH)
Figure 15.7 Messenger RNA is a copy of protein-coding information in the coding strand of DNA, with the substitution of U in the RNA for T in the coding sequence. However, new RNA nucleotides base pair with the nucleotides of the template strand. RNA is synthesized in its 5'-3' direction, using the enzyme RNA polymerase. As the template is read, the DNA unwinds ahead of the polymerase and then rewinds behind it.
Figure 15.14 This is a space-filling model of a tRNA molecule that adds the amino acid phenylalanine to a growing polypeptide chain. The anticodon AAG binds the Codon UUC on the mRNA. The amino acid phenylalanine is attached to the other end of the tRNA.
A fleeting, high-energy arrangement at a reaction barrier. It is an energy maximum along the reaction path, rather than a stable reaction intermediate.
Figure 12.19 Reaction diagrams for an endothermic process in the absence (red curve) and presence (blue curve) of a catalyst. The catalyzed pathway involves a two-step mechanism (note the presence of two transition states) and an intermediate species (represented by the valley between the two transitions states).
Figure 15.18 Translation begins when an initiator tRNA anticodon recognizes a start codon on mRNA bound to a small ribosomal subunit. The large ribosomal subunit joins the small subunit, and a second tRNA is recruited. As the mRNA moves relative to the ribosome, successive tRNAs move through the ribosome and the polypeptide chain is formed. Entry of a release factor into the A site terminates translation and the components dissociate.
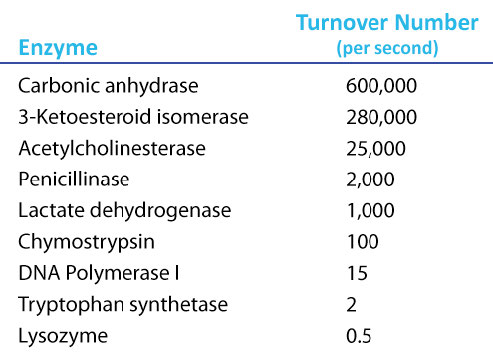
Figure 4.21 - Kcat (turnover number) values for several enzymes. Image by Aleia Kim
Kevin Ahern, Indira Rajagopal, and Taralyn Tan, Biochemistry Free For All, Oregon State University, via Biology LibreTexts. Image by Aleia Kim · CC BY-NC-SA 4.0
· Original image ↗ · Access for free ↗
vapor pressure
Equilibrium pressure of vapor above its condensed phase at a specified temperature.
No matching terms. Try a different name or abbreviation.
Chemistry 2E 13 — Summary
OpenStax · Chemistry 2E 13 — Summary ↗ Instructional page including learning objectives, examples, figures, source tables and questions. Site navigation and embedded media players are omitted; source media links remain available.
A reversible reaction is at equilibrium when the forward and reverse processes occur at equal rates. Chemical equilibria are dynamic processes characterized by constant amounts of reactant and product species.
A homogeneous equilibrium is an equilibrium in which all components are in the same phase. A heterogeneous equilibrium is an equilibrium in which components are in two or more phases.
Systems at equilibrium can be disturbed by changes to temperature, concentration, and, in some cases, volume and pressure. The system’s response to these disturbances is described by Le Châtelier’s principle: An equilibrium system subjected to a disturbance will shift in a way that counters the disturbance and re-establishes equilibrium. A catalyst will increase the rate of both the forward and reverse reactions of a reversible process, increasing the rate at which equilibrium is reached but not altering the equilibrium mixture’s composition (K does not change).
OpenStax · 16.4 Free Energy ↗ Instructional page including learning objectives, examples, figures, source tables and questions. Site navigation and embedded media players are omitted; source media links remain available.
One of the challenges of using the second law of thermodynamics to determine if a process is spontaneous is that it requires measurements of the entropy change for the system and the entropy change for the surroundings. An alternative approach involving a new thermodynamic property defined in terms of system properties only was introduced in the late nineteenth century by American mathematician Josiah Willard Gibbs. This new property is called the Gibbs free energy (G) (or simply the free energy), and it is defined in terms of a system’s enthalpy and entropy as the following:
(For simplicity’s sake, the subscript “sys” will be omitted henceforth.)
The relationship between this system property and the spontaneity of a process may be understood by recalling the previously derived second law expression:
The first law requires that qsurr = −qsys, and at constant pressure qsys = ΔH, so this expression may be rewritten as:
Multiplying both sides of this equation by −T, and rearranging yields the following:
Comparing this equation to the previous one for free energy change shows the following relation:
The free energy change is therefore a reliable indicator of the spontaneity of a process, being directly related to the previously identified spontaneity indicator, ΔSuniv. Table 16.3 summarizes the relation between the spontaneity of a process and the arithmetic signs of these indicators.
Relation between Process Spontaneity and Signs of Thermodynamic Properties
In addition to indicating spontaneity, the free energy change also provides information regarding the amount of useful work (w) that may be accomplished by a spontaneous process. Although a rigorous treatment of this subject is beyond the scope of an introductory chemistry text, a brief discussion is helpful for gaining a better perspective on this important thermodynamic property.
For this purpose, consider a spontaneous, exothermic process that involves a decrease in entropy. The free energy change, as defined by
may be interpreted as representing the difference between the enthalpy change of the process, ΔH, and the energy lost to the surroundings, TΔS. The difference between the energy produced and the energy lost is the energy available (or “free”) to do useful work by the process, ΔG. If the process somehow could be made to take place under conditions of thermodynamic reversibility, the amount of work that could be done would be maximal:
where refers to all types of work except expansion (pressure-volume) work.
However, as noted previously in this chapter, such conditions are not realistic. In addition, the technologies used to extract work from a spontaneous process (e.g., batteries) are never 100% efficient, and so the work done by these processes is always less than the theoretical maximum. Similar reasoning may be applied to a nonspontaneous process, for which the free energy change represents the minimum amount of work that must be done on the system to carry out the process.
Free energy is a state function, so its value depends only on the conditions of the initial and final states of the system. A convenient and common approach to the calculation of free energy changes for physical and chemical reactions is by use of widely available compilations of standard state thermodynamic data. One method involves the use of standard enthalpies and entropies to compute standard free energy changes, ΔG°, according to the following relation.
Example
16.7
Using Standard Enthalpy and Entropy Changes to Calculate ΔG°
Use standard enthalpy and entropy data from Appendix G to calculate the standard free energy change for the vaporization of water at room temperature (298 K). What does the computed value for ΔG° say about the spontaneity of this process?
At 298 K (25 °C) so boiling is nonspontaneous (not spontaneous).
Check Your Learning
Use standard enthalpy and entropy data from Appendix G to calculate the standard free energy change for the reaction shown here (298 K). What does the computed value for ΔG° say about the spontaneity of this process?
Answer:
the reaction is nonspontaneous (not spontaneous) at 25 °C.
The standard free energy change for a reaction may also be calculated from standard free energy of formation ΔGf° values of the reactants and products involved in the reaction. The standard free energy of formation is the free energy change that accompanies the formation of one mole of a substance from its elements in their standard states. Similar to the standard enthalpy of formation, is by definition zero for elemental substances in their standard states. The approach used to calculate for a reaction from values is the same as that demonstrated previously for enthalpy and entropy changes. For the reaction
the standard free energy change at room temperature may be calculated as
Example
16.8
Using Standard Free Energies of Formation to Calculate ΔG°
Consider the decomposition of yellow mercury(II) oxide.
Calculate the standard free energy change at room temperature, using (a) standard free energies of formation and (b) standard enthalpies of formation and standard entropies. Do the results indicate the reaction to be spontaneous or nonspontaneous under standard conditions?
Both ways to calculate the standard free energy change at 25 °C give the same numerical value (to three significant figures), and both predict that the process is nonspontaneous (not spontaneous) at room temperature.
Check Your Learning
Calculate ΔG° using (a) free energies of formation and (b) enthalpies of formation and entropies (Appendix G). Do the results indicate the reaction to be spontaneous or nonspontaneous at 25 °C?
The use of free energies of formation to compute free energy changes for reactions as described above is possible because G is a state function, and the approach is analogous to the use of Hess’ Law in computing enthalpy changes (see the chapter on thermochemistry). Consider the vaporization of water as an example:
An equation representing this process may be derived by adding the formation reactions for the two phases of water (necessarily reversing the reaction for the liquid phase). The free energy change for the sum reaction is the sum of free energy changes for the two added reactions:
This approach may also be used in cases where a nonspontaneous reaction is enabled by coupling it to a spontaneous reaction. For example, the production of elemental zinc from zinc sulfide is thermodynamically unfavorable, as indicated by a positive value for ΔG°:
The industrial process for production of zinc from sulfidic ores involves coupling this decomposition reaction to the thermodynamically favorable oxidation of sulfur:
The coupled reaction exhibits a negative free energy change and is spontaneous:
This process is typically carried out at elevated temperatures, so this result obtained using standard free energy values is just an estimate. The gist of the calculation, however, holds true.
As was previously demonstrated in this chapter’s section on entropy, the spontaneity of a process may depend upon the temperature of the system. Phase transitions, for example, will proceed spontaneously in one direction or the other depending upon the temperature of the substance in question. Likewise, some chemical reactions can also exhibit temperature dependent spontaneities. To illustrate this concept, the equation relating free energy change to the enthalpy and entropy changes for the process is considered:
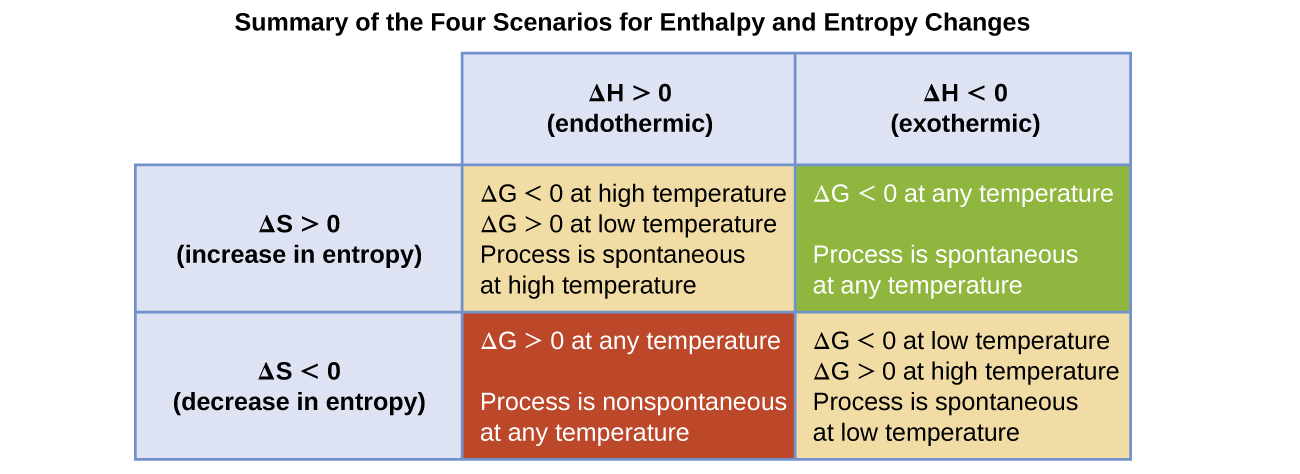
The spontaneity of a process, as reflected in the arithmetic sign of its free energy change, is then determined by the signs of the enthalpy and entropy changes and, in some cases, the absolute temperature. Since T is the absolute (kelvin) temperature, it can only have positive values. Four possibilities therefore exist with regard to the signs of the enthalpy and entropy changes:
Both ΔH and ΔS are positive. This condition describes an endothermic process that involves an increase in system entropy. In this case, ΔG will be negative if the magnitude of the TΔS term is greater than ΔH. If the TΔS term is less than ΔH, the free energy change will be positive. Such a process is spontaneous at high temperatures and nonspontaneous at low temperatures.
Both ΔH and ΔS are negative. This condition describes an exothermic process that involves a decrease in system entropy. In this case, ΔG will be negative if the magnitude of the TΔS term is less than ΔH. If the TΔS term’s magnitude is greater than ΔH, the free energy change will be positive. Such a process is spontaneous at low temperatures and nonspontaneous at high temperatures.
ΔH is positive and ΔS is negative. This condition describes an endothermic process that involves a decrease in system entropy. In this case, ΔG will be positive regardless of the temperature. Such a process is nonspontaneous at all temperatures.
ΔH is negative and ΔS is positive. This condition describes an exothermic process that involves an increase in system entropy. In this case, ΔG will be negative regardless of the temperature. Such a process is spontaneous at all temperatures.
These four scenarios are summarized in Figure 16.12.
Combustion processes are exothermic (ΔH < 0). This particular reaction involves an increase in entropy due to the accompanying increase in the amount of gaseous species (net gain of one mole of gas, ΔS > 0). The reaction is therefore spontaneous (ΔG < 0) at all temperatures.
Check Your Learning
Popular chemical hand warmers generate heat by the air-oxidation of iron:
How does the spontaneity of this process depend upon temperature?
Answer:
ΔH and ΔS are negative; the reaction is spontaneous at low temperatures.
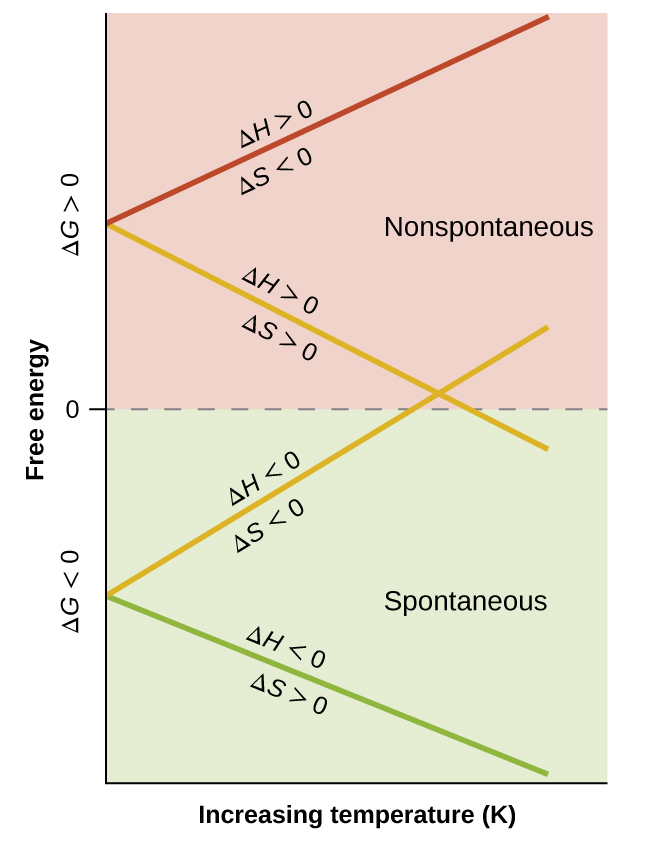
When considering the conclusions drawn regarding the temperature dependence of spontaneity, it is important to keep in mind what the terms “high” and “low” mean. Since these terms are adjectives, the temperatures in question are deemed high or low relative to some reference temperature. A process that is nonspontaneous at one temperature but spontaneous at another will necessarily undergo a change in “spontaneity” (as reflected by its ΔG) as temperature varies. This is clearly illustrated by a graphical presentation of the free energy change equation, in which ΔG is plotted on the y axis versus T on the x axis:
Such a plot is shown in Figure 16.13. A process whose enthalpy and entropy changes are of the same arithmetic sign will exhibit a temperature-dependent spontaneity as depicted by the two yellow lines in the plot. Each line crosses from one spontaneity domain (positive or negative ΔG) to the other at a temperature that is characteristic of the process in question. This temperature is represented by the x-intercept of the line, that is, the value of T for which ΔG is zero:
So, saying a process is spontaneous at “high” or “low” temperatures means the temperature is above or below, respectively, that temperature at which ΔG for the process is zero. As noted earlier, the condition of ΔG = 0 describes a system at equilibrium.
As defined in the chapter on liquids and solids, the boiling point of a liquid is the temperature at which its liquid and gaseous phases are in equilibrium (that is, when vaporization and condensation occur at equal rates). Use the information in Appendix G to estimate the boiling point of water.
The accepted value for water’s normal boiling point is 373.2 K (100.0 °C), and so this calculation is in reasonable agreement. Note that the values for enthalpy and entropy changes data used were derived from standard data at 298 K (Appendix G). If desired, you could obtain more accurate results by using enthalpy and entropy changes determined at (or at least closer to) the actual boiling point.
The free energy change for a process may be viewed as a measure of its driving force. A negative value for ΔG represents a driving force for the process in the forward direction, while a positive value represents a driving force for the process in the reverse direction. When ΔG is zero, the forward and reverse driving forces are equal, and the process occurs in both directions at the same rate (the system is at equilibrium).
In the chapter on equilibrium the reaction quotient, Q, was introduced as a convenient measure of the status of an equilibrium system. Recall that Q is the numerical value of the mass action expression for the system, and that you may use its value to identify the direction in which a reaction will proceed in order to achieve equilibrium. When Q is lesser than the equilibrium constant, K, the reaction will proceed in the forward direction until equilibrium is reached and Q = K. Conversely, if Q > K, the process will proceed in the reverse direction until equilibrium is achieved.
The free energy change for a process taking place with reactants and products present under nonstandard conditions (pressures other than 1 bar; concentrations other than 1 M) is related to the standard free energy change according to this equation:
Since the computed value for ΔG is positive, the reaction is nonspontaneous under these conditions.
Check Your Learning
Calculate the free energy change for this same reaction at 875 °C for a mixture containing each gas at a partial pressure of 1.88 atm. Is the reaction spontaneous under these conditions?
Given that the standard free energies of formation of Ag+(aq), Cl−(aq), and AgCl(s) are 77.1 kJ/mol, −131.2 kJ/mol, and −109.8 kJ/mol, respectively, calculate the solubility product, Ksp, for AgCl.
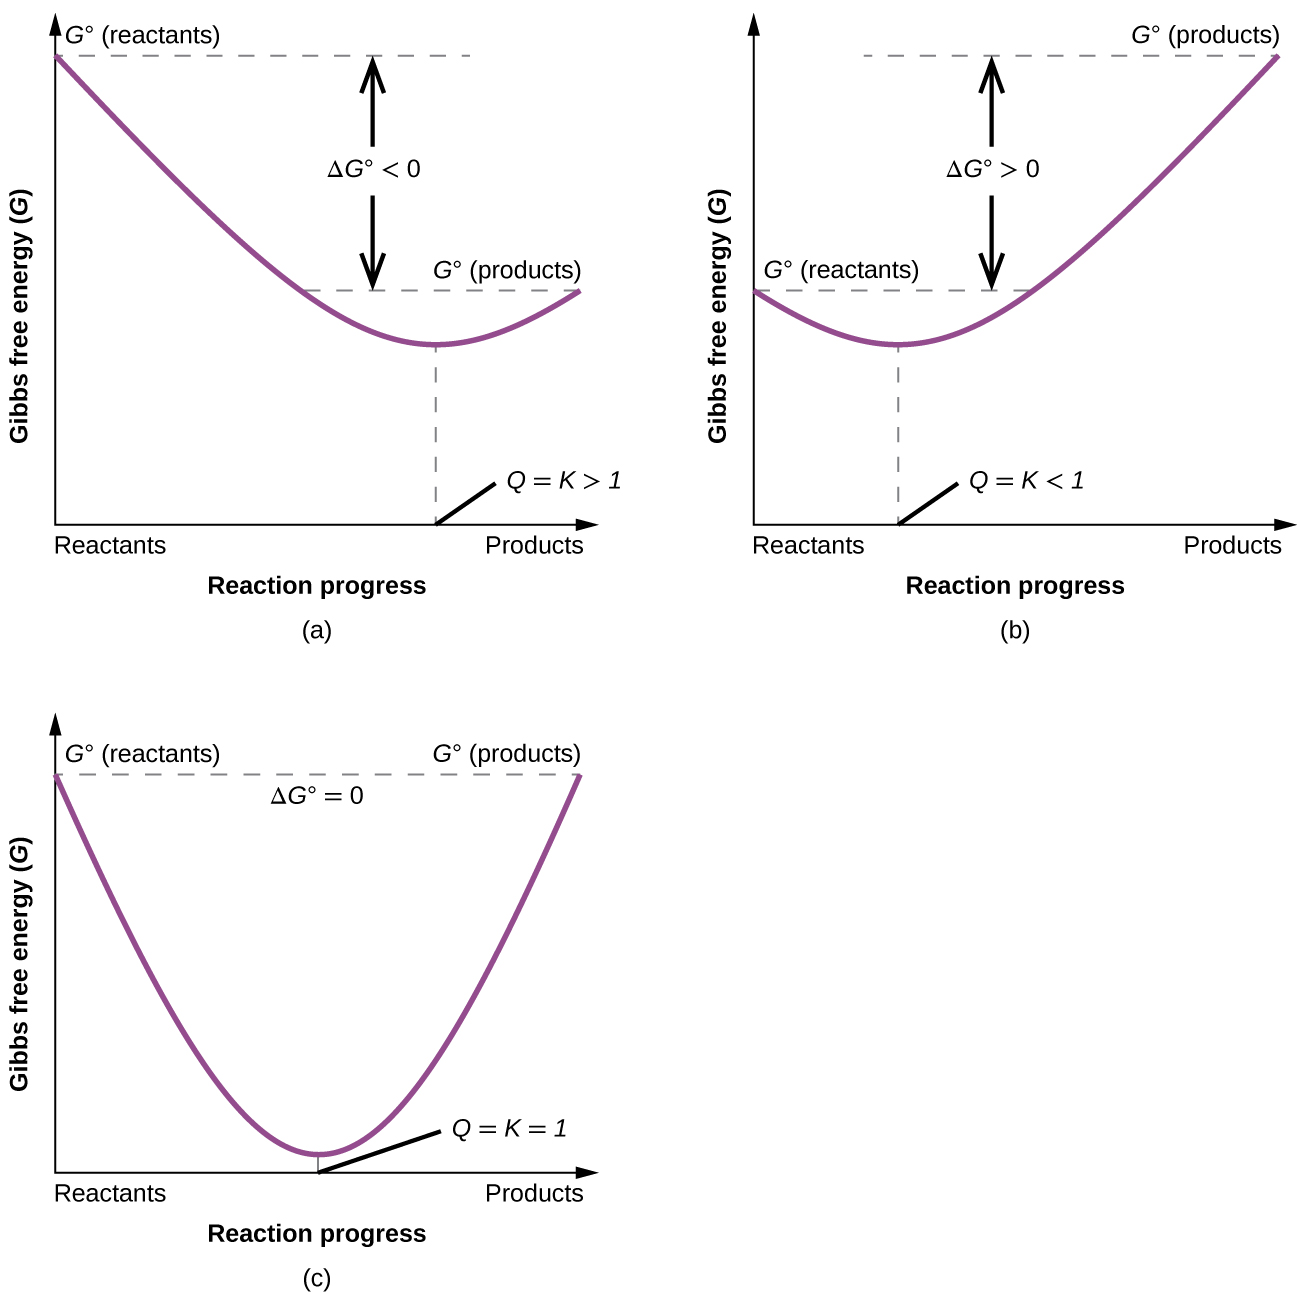
To further illustrate the relation between these two essential thermodynamic concepts, consider the observation that reactions spontaneously proceed in a direction that ultimately establishes equilibrium. As may be shown by plotting the free energy versus the extent of the reaction (for example, as reflected in the value of Q), equilibrium is established when the system’s free energy is minimized (Figure 16.14). If a system consists of reactants and products in nonequilibrium amounts (Q ≠ K), the reaction will proceed spontaneously in the direction necessary to establish equilibrium.
Figure 16.14 These plots show the free energy versus reaction progress for systems whose standard free energy changes are (a) negative, (b) positive, and (c) zero. Nonequilibrium systems will proceed spontaneously in whatever direction is necessary to minimize free energy and establish equilibrium.