Electron flow pumps protons across the inner mitochondrial membrane; ATP synthase converts the resulting electrochemical gradient into ATP.
Electron flow through the respiratory chain
NADH transfers two electrons to complex I, where FMN and iron–sulfur centers pass them to ubiquinone, or coenzyme Q. Succinate dehydrogenase is complex II: its bound FAD accepts electrons during succinate oxidation and also transfers them to Q. Reduced Q carries electrons within the membrane to complex III; cytochrome c carries them one at a time to complex IV, where oxygen is reduced to water.
Complexes I, III, and IV pump protons from matrix to intermembrane space; complex II does not. Cytochromes use heme iron, whereas iron–sulfur centers and flavins use different cofactors. Entry downstream of complex I explains the lower ATP yield from FAD-linked electrons.
Source: 7.4 Oxidative Phosphorylation · 7.7 Regulation of Cellular Respiration
Chemiosmosis links oxidation to phosphorylation
The proton-motive force combines a pH gradient and electrical potential: the matrix is relatively alkaline and negative. Protons flowing back through the Fo portion of ATP synthase rotate its machinery, changing F1 catalytic conformations to form ATP from ADP and phosphate. An intact, selectively impermeable inner membrane is essential; free proton leakage wastes stored energy.
Oxygen is the terminal electron acceptor, not the direct substrate of ATP synthase. If oxygen is unavailable, upstream carriers become reduced and electron flow slows, limiting proton pumping and ATP production. ADP/ATP exchange and phosphate import also draw on the electrochemical gradient, so ATP accounting includes transport costs.
Source: 7.4 Oxidative Phosphorylation · 7.7 Regulation of Cellular Respiration
Predict inhibitor and uncoupler experiments
Complete glucose oxidation yields CO2 and water, with about 30–32 ATP in common eukaryotic bookkeeping: 4 substrate-level ATP equivalents plus oxidative phosphorylation using roughly 2.5 ATP per NADH and 1.5 per FAD-linked pair. Cytosolic NADH shuttles account for much of the difference; proton leak and cellular conditions vary. Older 36–38 ATP totals assume larger carrier yields.
Rotenone blocks complex I, cyanide blocks complex IV, and oligomycin blocks ATP synthase. An ATP-synthase block raises backpressure and slows electron transport. An uncoupler dissipates the gradient: ATP output falls while oxygen use can increase if fuel and oxygen remain available. Adding an uncoupler cannot bypass a completely blocked electron-transfer complex.
Source: 7.4 Oxidative Phosphorylation · 7.7 Regulation of Cellular Respiration
Demand, oxidative stress, and cell death
Rising ADP after ATP use normally stimulates oxidative phosphorylation, whereas low ADP and a steep proton gradient restrain electron flow. Electron leak can partially reduce oxygen to superoxide; superoxide dismutase and peroxide-removing systems limit damage. Excess reactive oxygen species can injure lipids, proteins, and DNA, but moderate signals also participate in normal regulation.
Mitochondrial outer-membrane permeabilization can release cytochrome c into the cytosol, where it helps assemble an apoptosome and activate caspases. This apoptotic signaling role is distinct from cytochrome c’s normal electron-carrier role. Mitochondrial dysfunction can therefore affect both energy availability and survival signaling.
Source: 7.4 Oxidative Phosphorylation · 7.7 Regulation of Cellular Respiration
Practice: apply the mechanism
Question. Isolated mitochondria receive substrate and ADP. Oligomycin lowers oxygen consumption. A protonophore is then added. Predict oxygen consumption and ATP synthesis, assuming the respiratory chain remains intact.
Show reasoning
Oligomycin blocks proton return through ATP synthase, raising the gradient and slowing respiration. The protonophore provides another proton-return route, relieving backpressure, so oxygen consumption rises. ATP synthesis remains low because the gradient is dissipated and ATP synthase remains inhibited. Oxygen consumption alone therefore does not measure useful ATP output.
Source: 7.4 Oxidative Phosphorylation · 7.7 Regulation of Cellular Respiration
7.4 Oxidative Phosphorylation — figures and tables
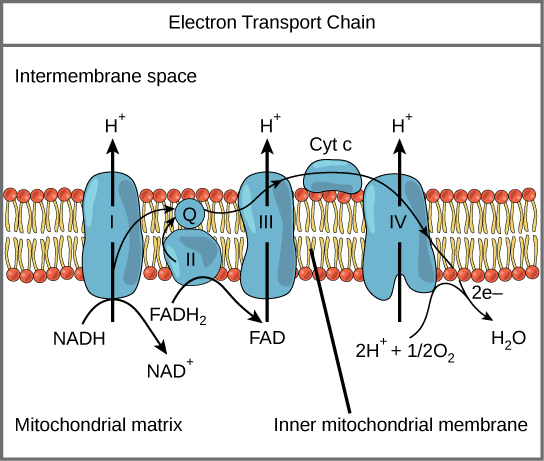
Figure 7.12 The electron transport chain is a series of electron transporters embedded in the inner mitochondrial membrane that shuttles electrons from NADH and FADH 2 to molecular oxygen. In the process, protons are pumped from the mitochondrial matrix to the intermembrane space, and oxygen is reduced to form water.
Mary Ann Clark, Matthew Douglas, and Jung Choi, Biology 2E, OpenStax. · CC BY-NC-SA 4.0 · Original image ↗ · Access for free ↗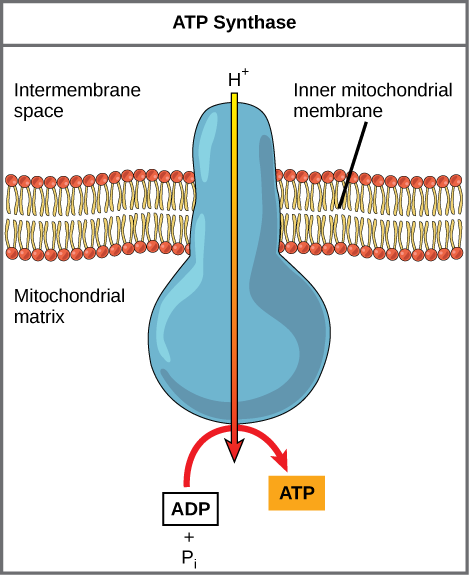
Figure 7.13 ATP synthase is a complex, molecular machine that uses a proton (H + ) gradient to form ATP from ADP and inorganic phosphate (Pi). (Credit: modification of work by Klaus Hoffmeier)
Mary Ann Clark, Matthew Douglas, and Jung Choi, Biology 2E, OpenStax. · CC BY-NC-SA 4.0 · Original image ↗ · Access for free ↗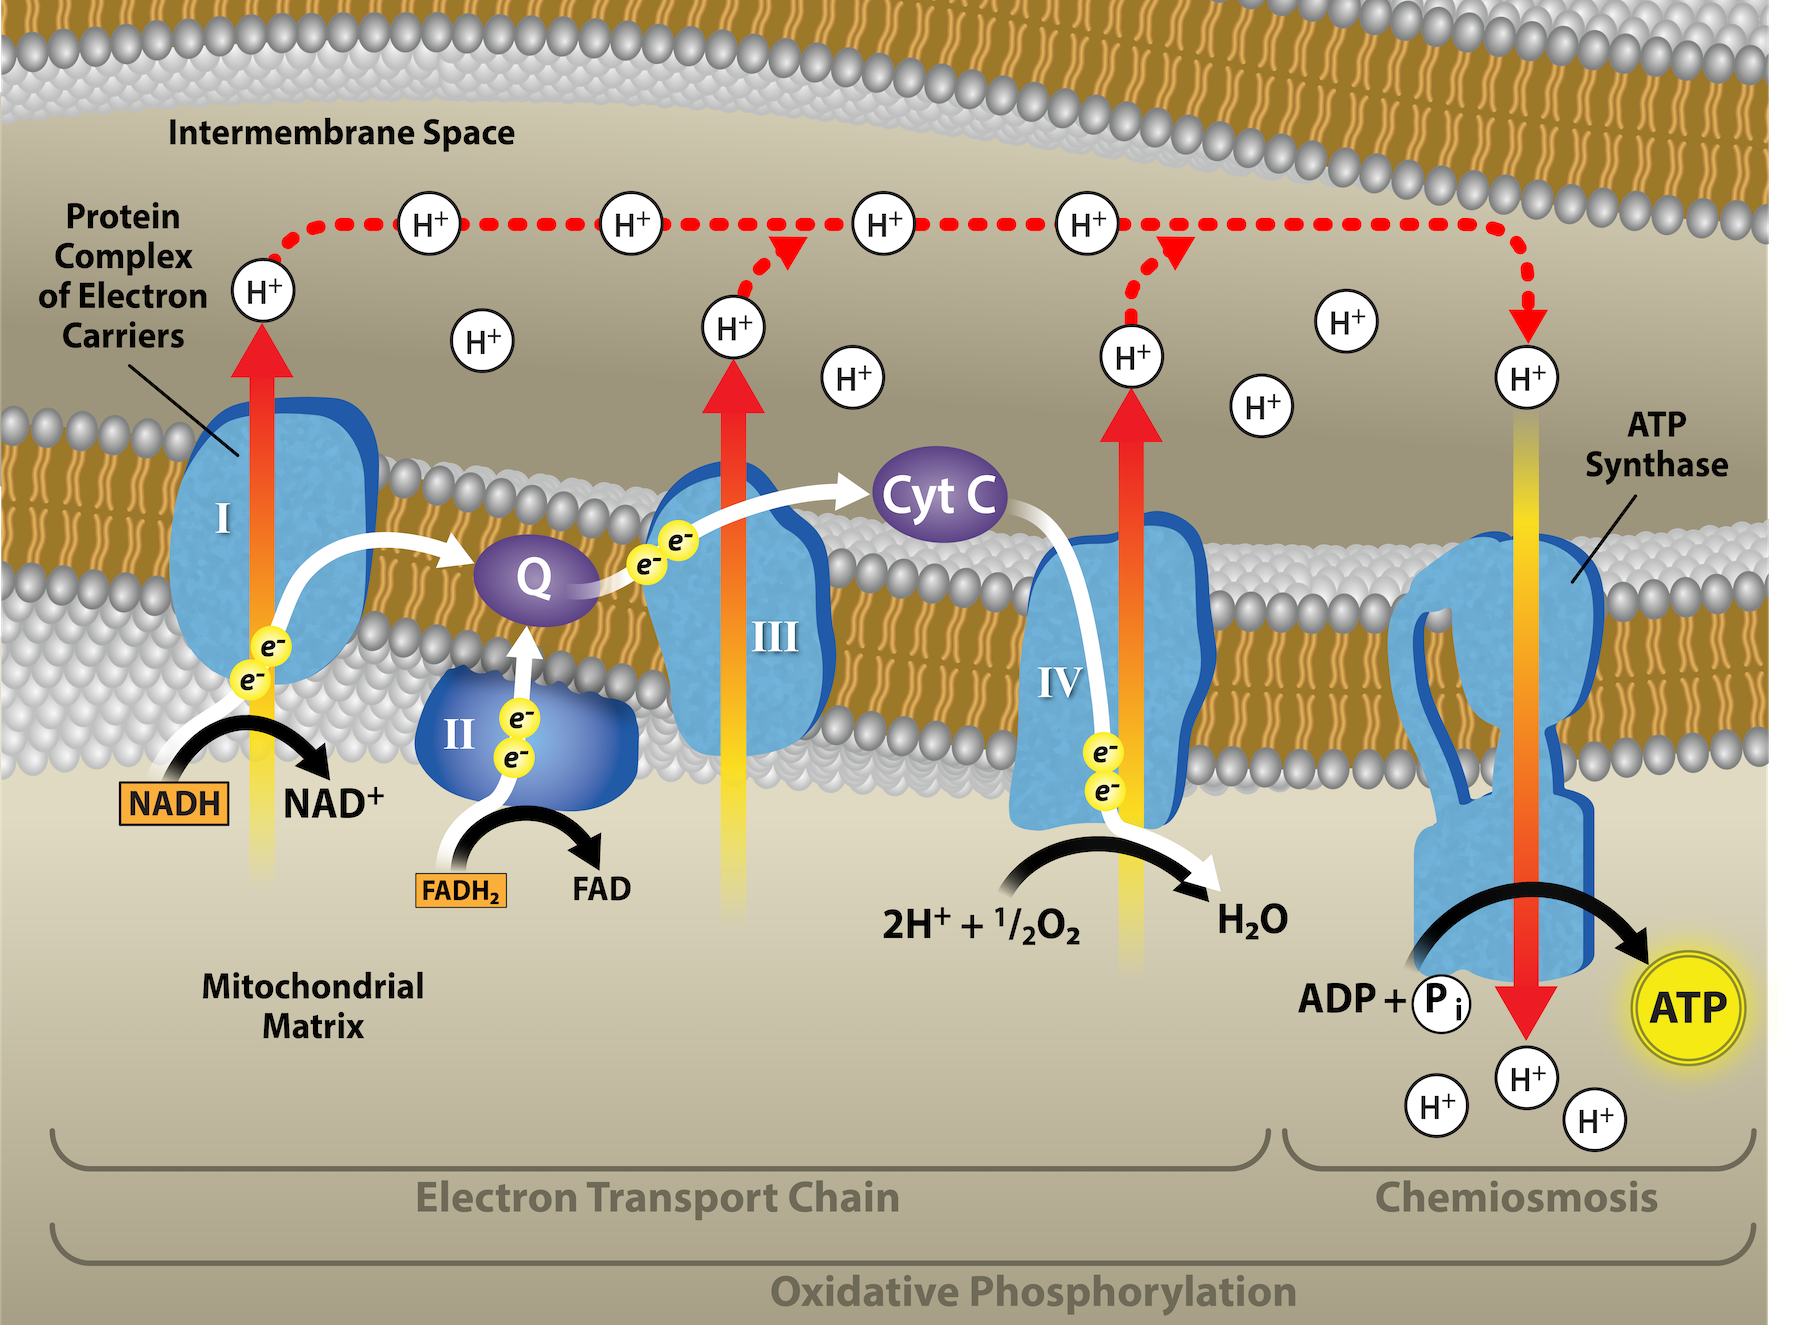
Figure 7.14 In oxidative phosphorylation, the pH gradient formed by the electron transport chain is used by ATP synthase to form ATP. Credit: Rao, A., Ryan, K., Fletcher, S. and Tag, A. Department of Biology, Texas A&M University.
Mary Ann Clark, Matthew Douglas, and Jung Choi, Biology 2E, OpenStax. · CC BY-NC-SA 4.0 · Original image ↗ · Access for free ↗Source: 7.4 Oxidative Phosphorylation
7.7 Regulation of Cellular Respiration — figures and tables
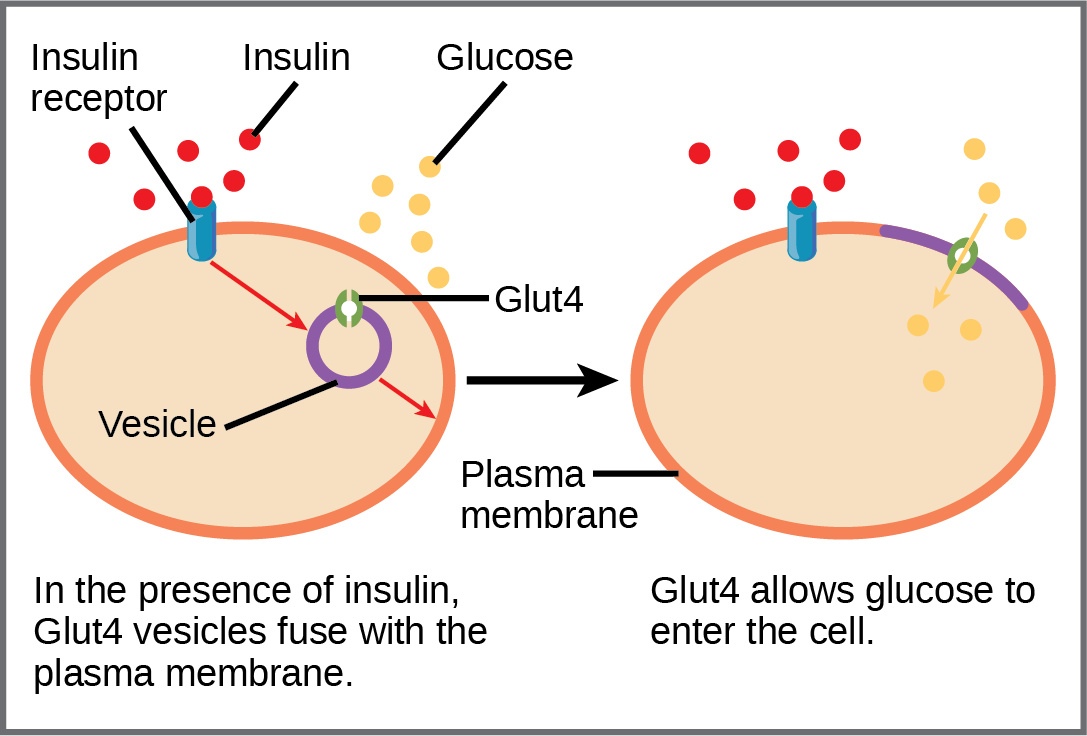
Figure 7.20 GLUT4 is a glucose transporter that is stored in vesicles. A cascade of events that occurs upon insulin binding to a receptor in the plasma membrane causes GLUT4-containing vesicles to fuse with the plasma membrane so that glucose may be transported into the cell.
Mary Ann Clark, Matthew Douglas, and Jung Choi, Biology 2E, OpenStax. · CC BY-NC-SA 4.0 · Original image ↗ · Access for free ↗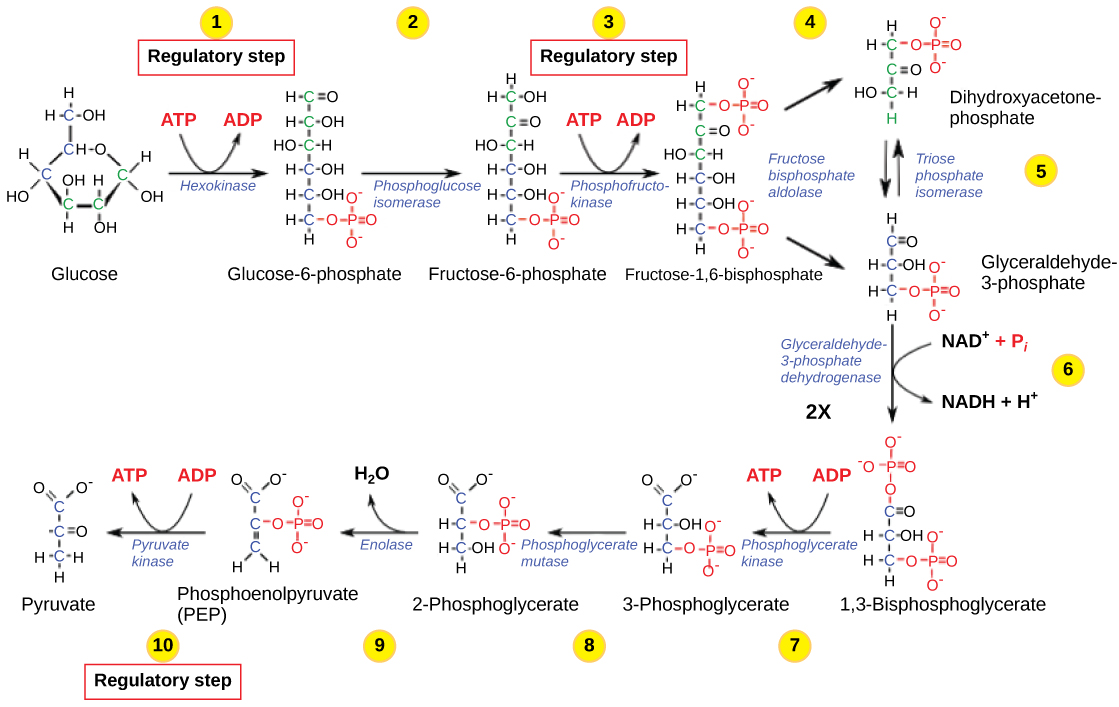
Figure 7.21 The glycolysis pathway is primarily regulated at the three key enzymatic steps (1, 3, and 10) as indicated. Note that the first two steps that are regulated occur early in the pathway and involve hydrolysis of ATP.
Mary Ann Clark, Matthew Douglas, and Jung Choi, Biology 2E, OpenStax. · CC BY-NC-SA 4.0 · Original image ↗ · Access for free ↗| Pathway | Enzyme affected | Elevated levels of effector | Effect on pathway activity |
|---|---|---|---|
| glycolysis | hexokinase | glucose-6-phosphate | decrease |
| phosphofructokinase | low-energy charge (ATP, AMP), fructose-6-phosphate via fructose-2,6-bisphosphate | increase | |
| high-energy charge (ATP, AMP), citrate, acidic pH | decrease | ||
| pyruvate kinase | fructose-1,6-bisphosphate | increase | |
| high-energy charge (ATP, AMP), alanine | decrease | ||
| pyruvate to acetyl CoA conversion | pyruvate dehydrogenase | ADP, pyruvate | increase |
| acetyl CoA, ATP, NADH | decrease | ||
| citric acid cycle | isocitrate dehydrogenase | ADP | increase |
| ATP, NADH | decrease | ||
| α-ketoglutarate dehydrogenase | calcium ions, ADP | increase | |
| ATP, NADH, succinyl CoA | decrease | ||
| electron transport chain | ADP | increase | |
| ATP | decrease |
Table 7.1. Mary Ann Clark, Matthew Douglas, and Jung Choi, Biology 2E, OpenStax.