Epinephrine promotes phosphorylation, increasing phosphorylase-mediated breakdown and decreasing synthase activity. Contraction-associated Ca2+ reinforces mobilization. Muscle lacks glucose-6-phosphatase, so most released glucose units remain phosphorylated and are used locally; liver can remove phosphate and export free glucose.
The preserved Anatomy and Physiology carbohydrate chapter uses older 36-ATP respiratory accounting, includes an inconsistent sentence that calls glycolysis’s net ATP zero, and describes the brain as using only glucose. These notes use net 2 ATP from glycolysis and approximately 30–32 from complete glucoseoxidation with modern carrier yields. During prolonged fasting the brain also uses ketones; it retains a glucose requirement. Original wording is retained for comparison.
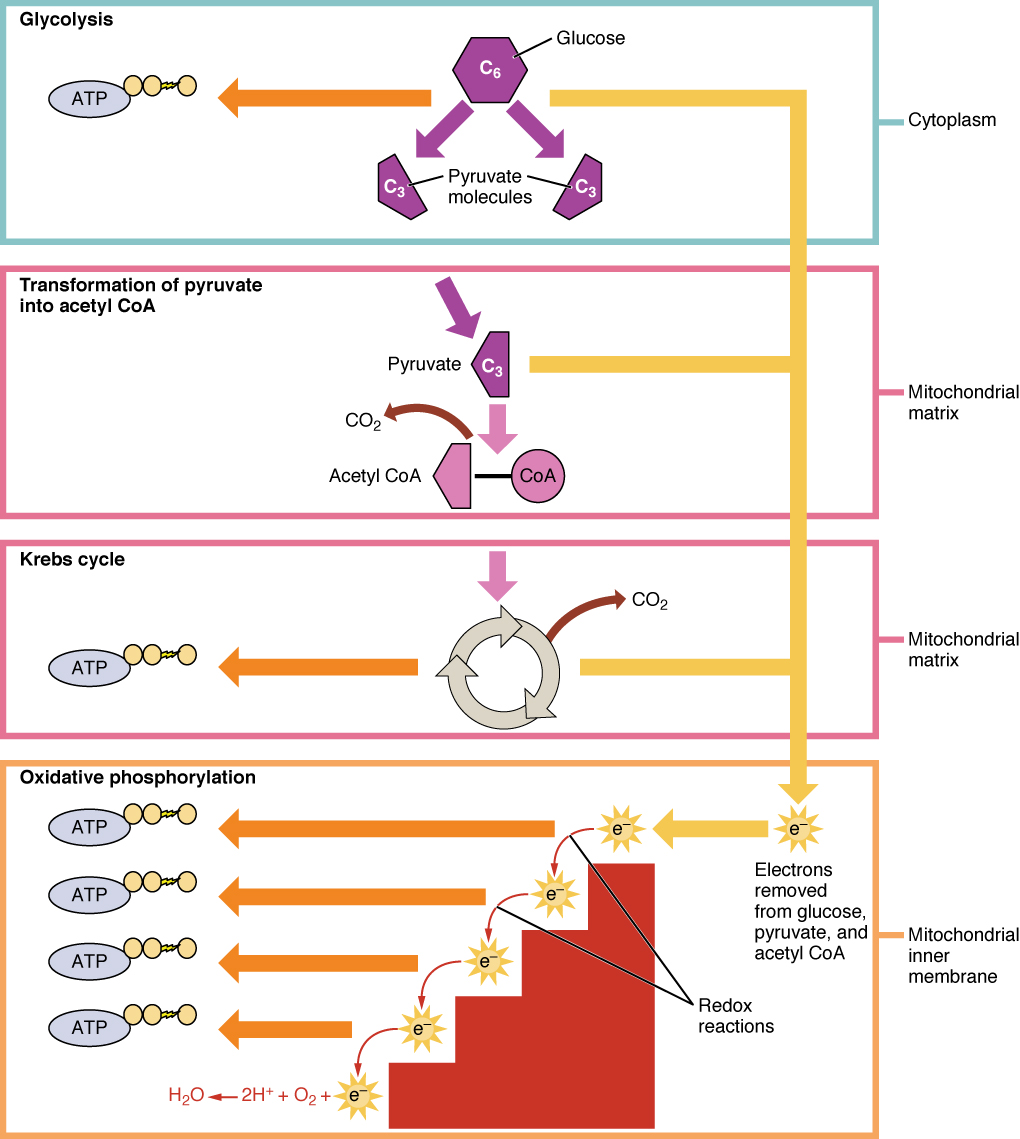
Figure 24.4 Cellular Respiration Cellular respiration oxidizes glucose molecules through glycolysis, the Krebs cycle, and oxidative phosphorylation to produce ATP.
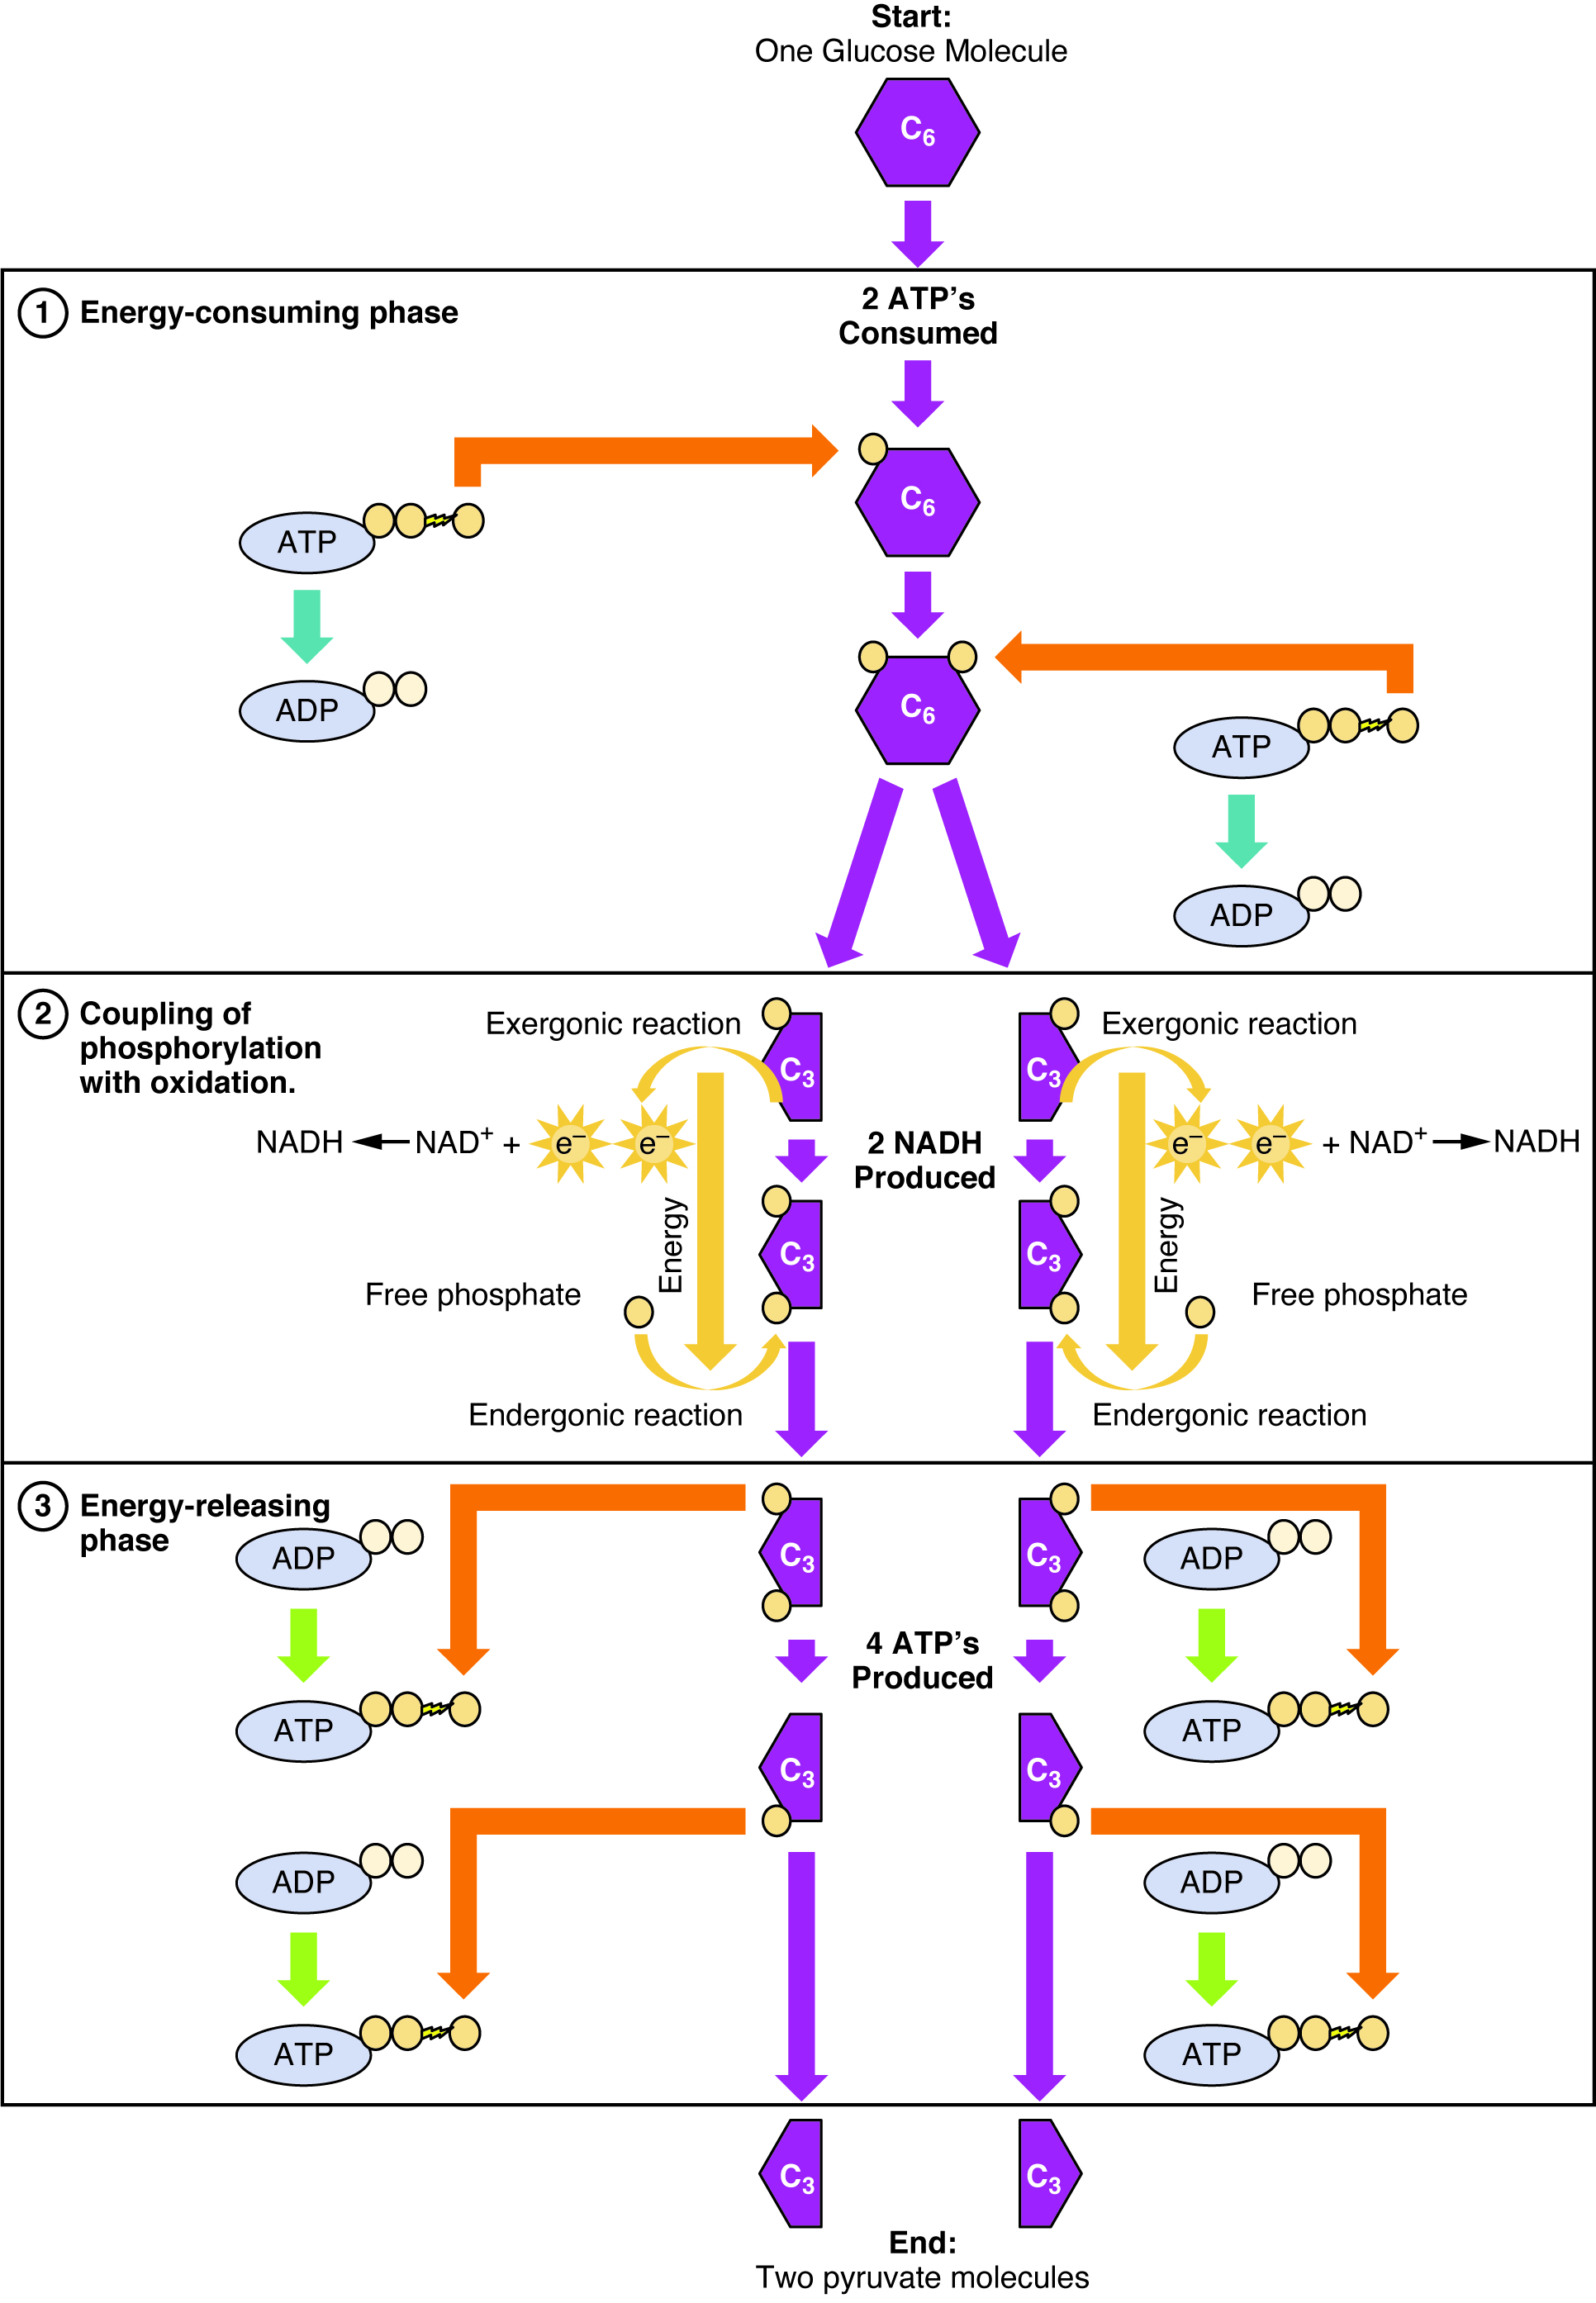
Figure 24.5 Glycolysis Overview During the energy-consuming phase of glycolysis, two ATPs are consumed, transferring two phosphates to the glucose molecule. The glucose molecule then splits into two three-carbon compounds, each containing a phosphate. During the second phase, an additional phosphate is added to each of the three-carbon compounds. The energy for this endergonic reaction is provided by the removal (oxidation) of two electrons from each three-carbon compound. During the energy-releasing phase, the phosphates are removed from both three-carbon compounds and used to produce four ATP molecules.
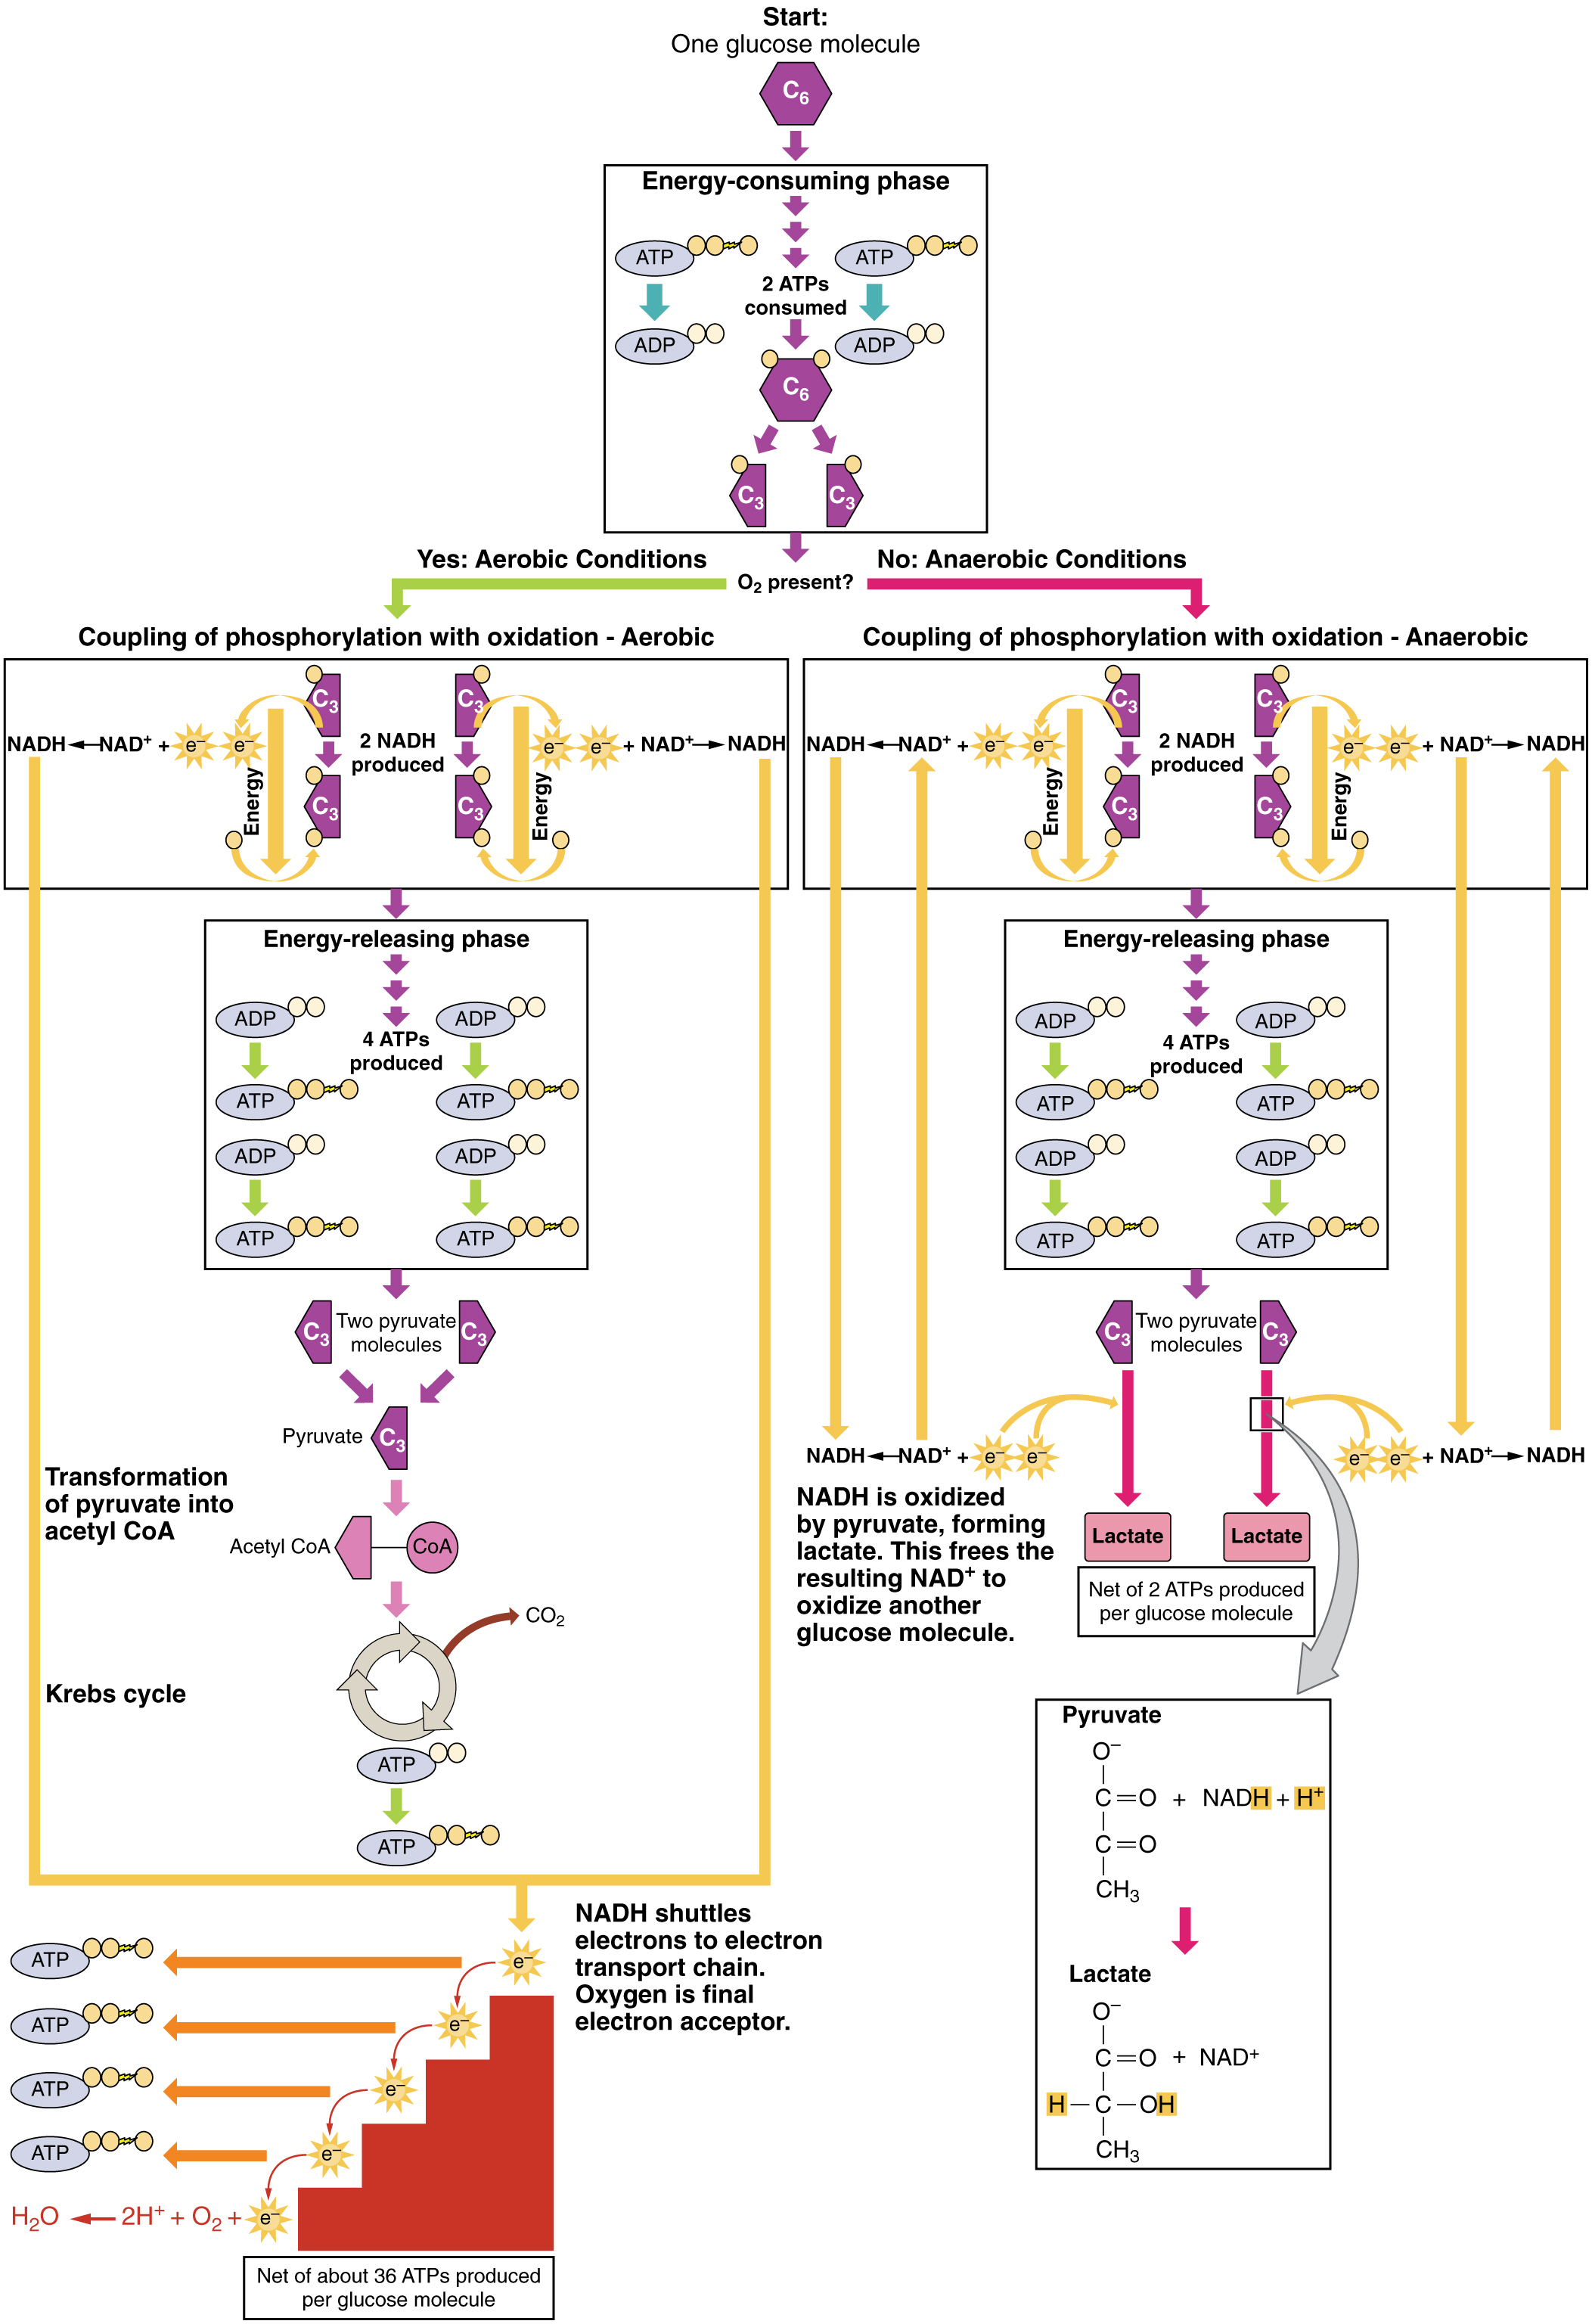
Figure 24.6 Aerobic versus Fermentation The process of fermentation converts glucose into two lactate molecules in the absence of oxygen or within erythrocytes that lack mitochondria. During fermentation, glucose is oxidized into two pyruvate molecules.
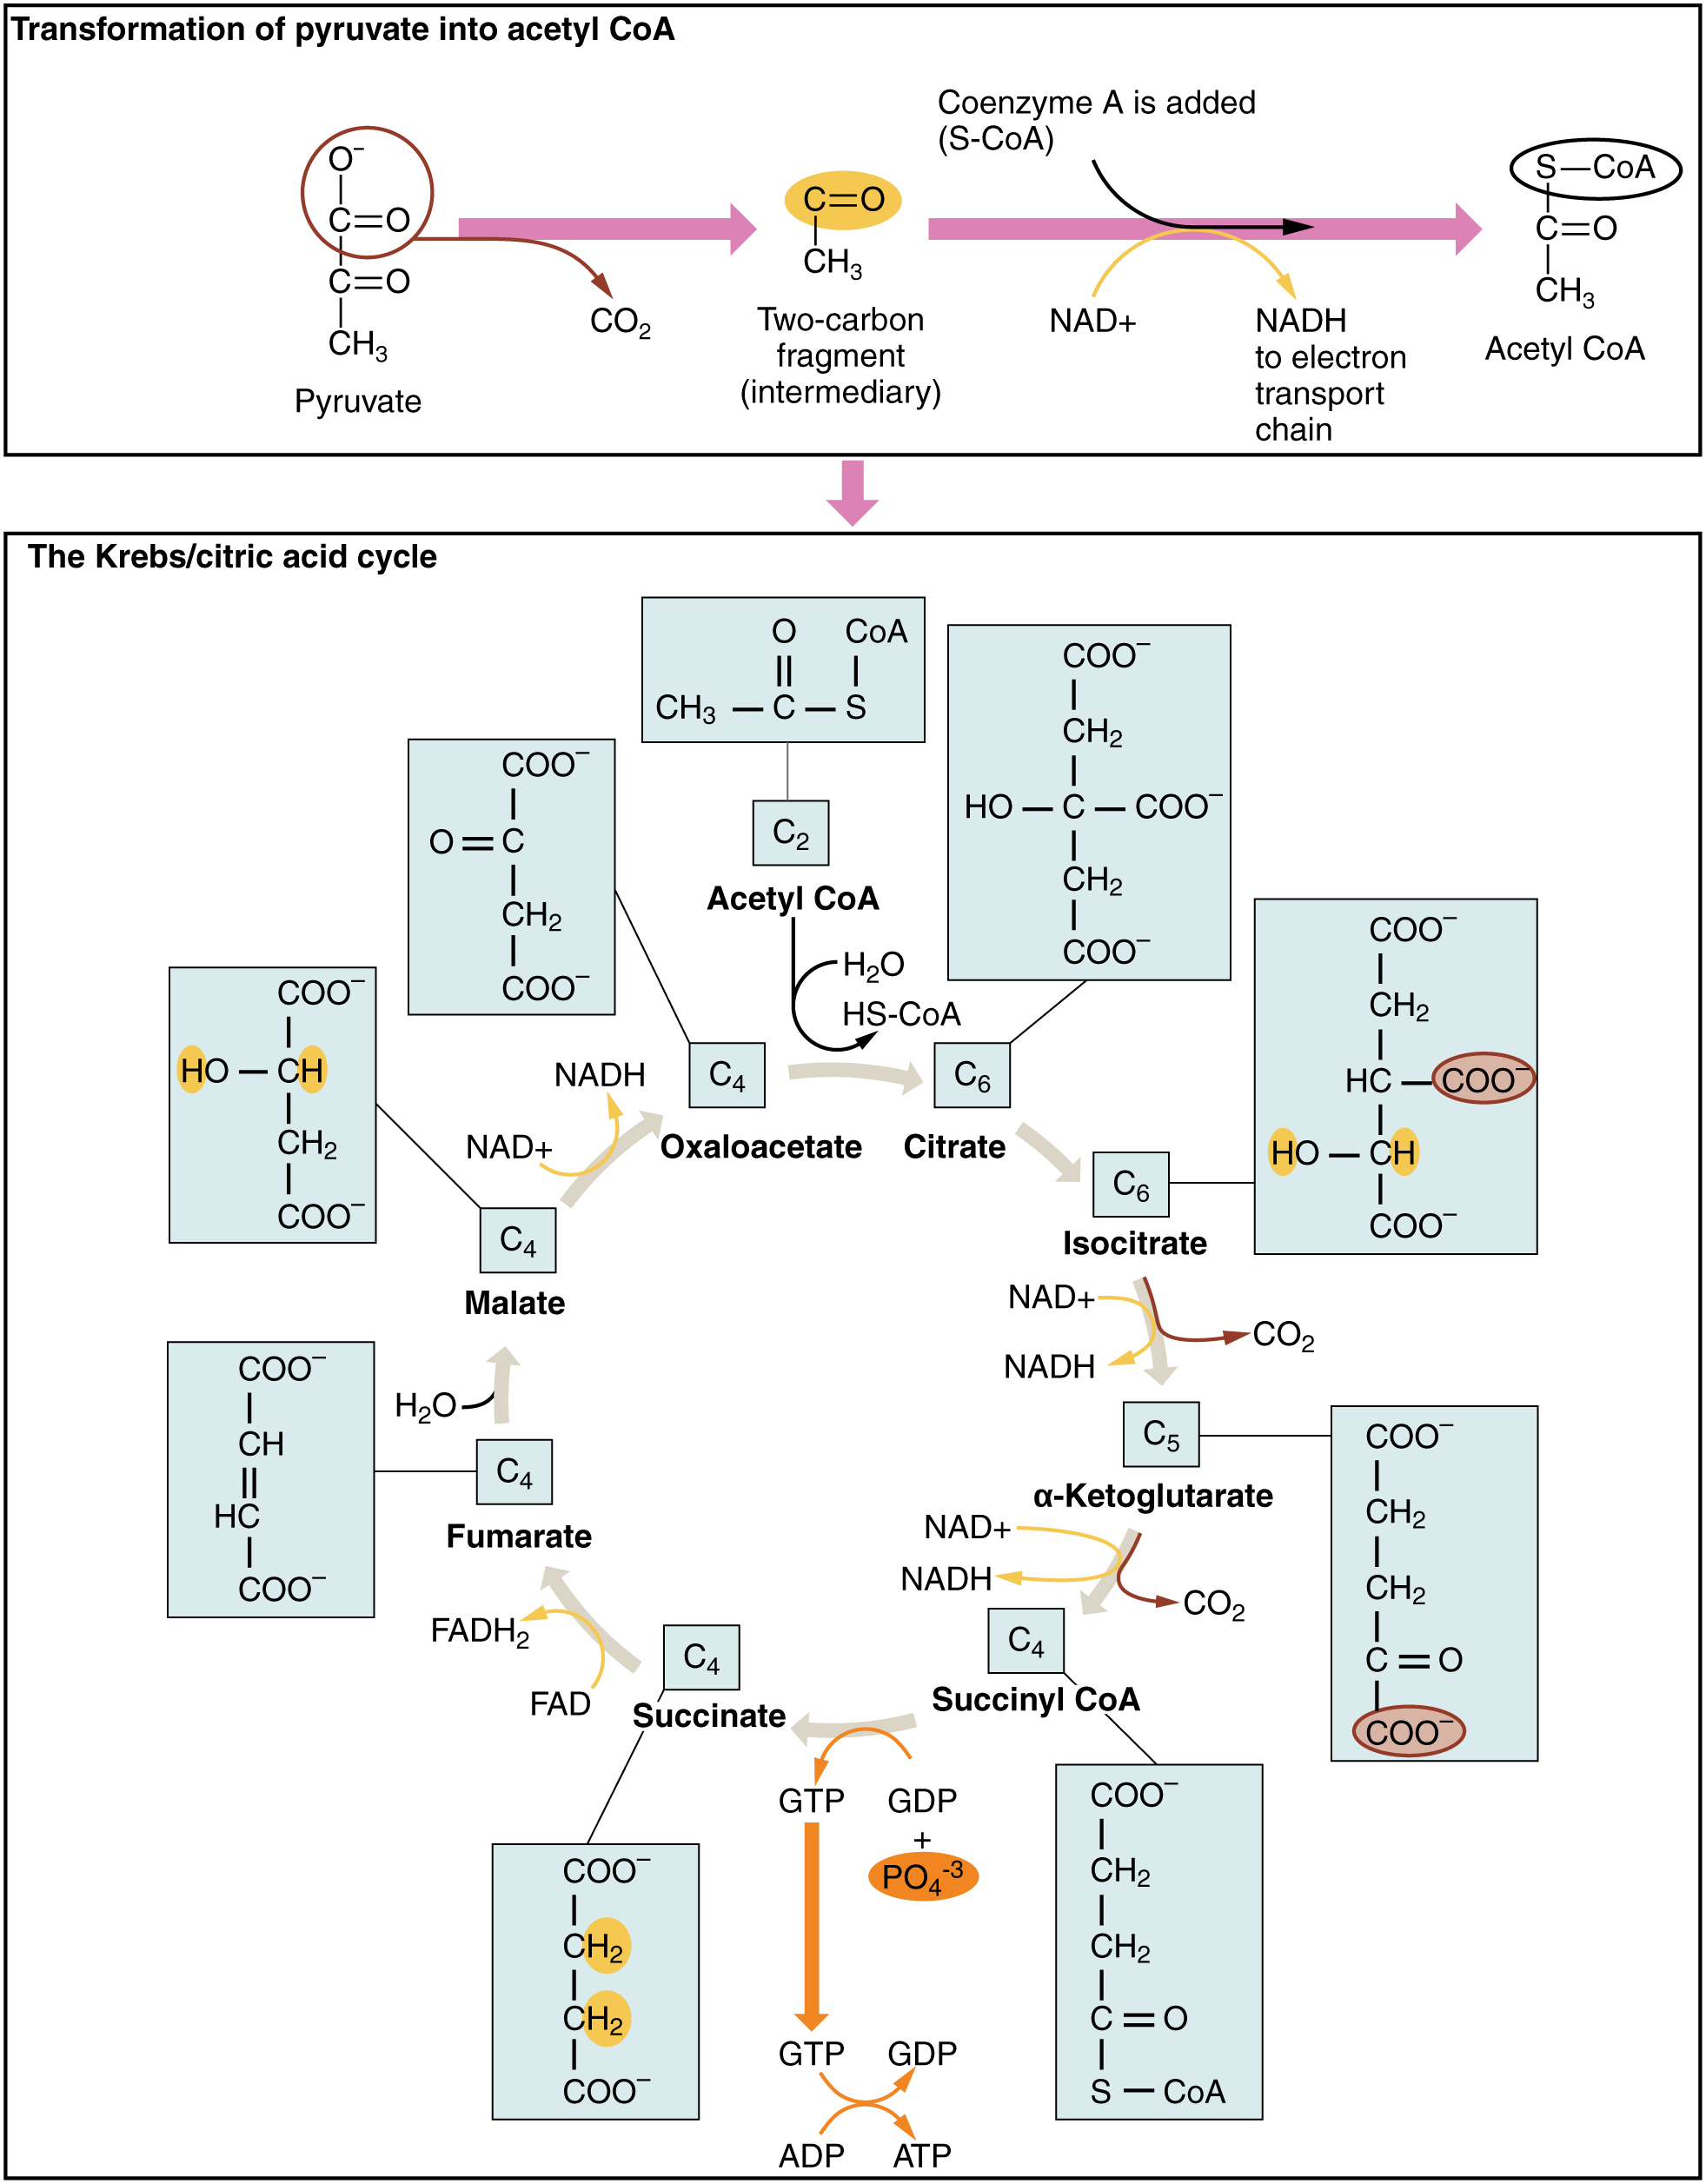
Figure 24.7 Krebs Cycle During the Krebs cycle, each pyruvate that is generated by glycolysis is converted into a two-carbon acetyl CoA molecule. The acetyl CoA is systematically processed through the cycle and produces high-energy NADH, FADH 2 , and ATP molecules.
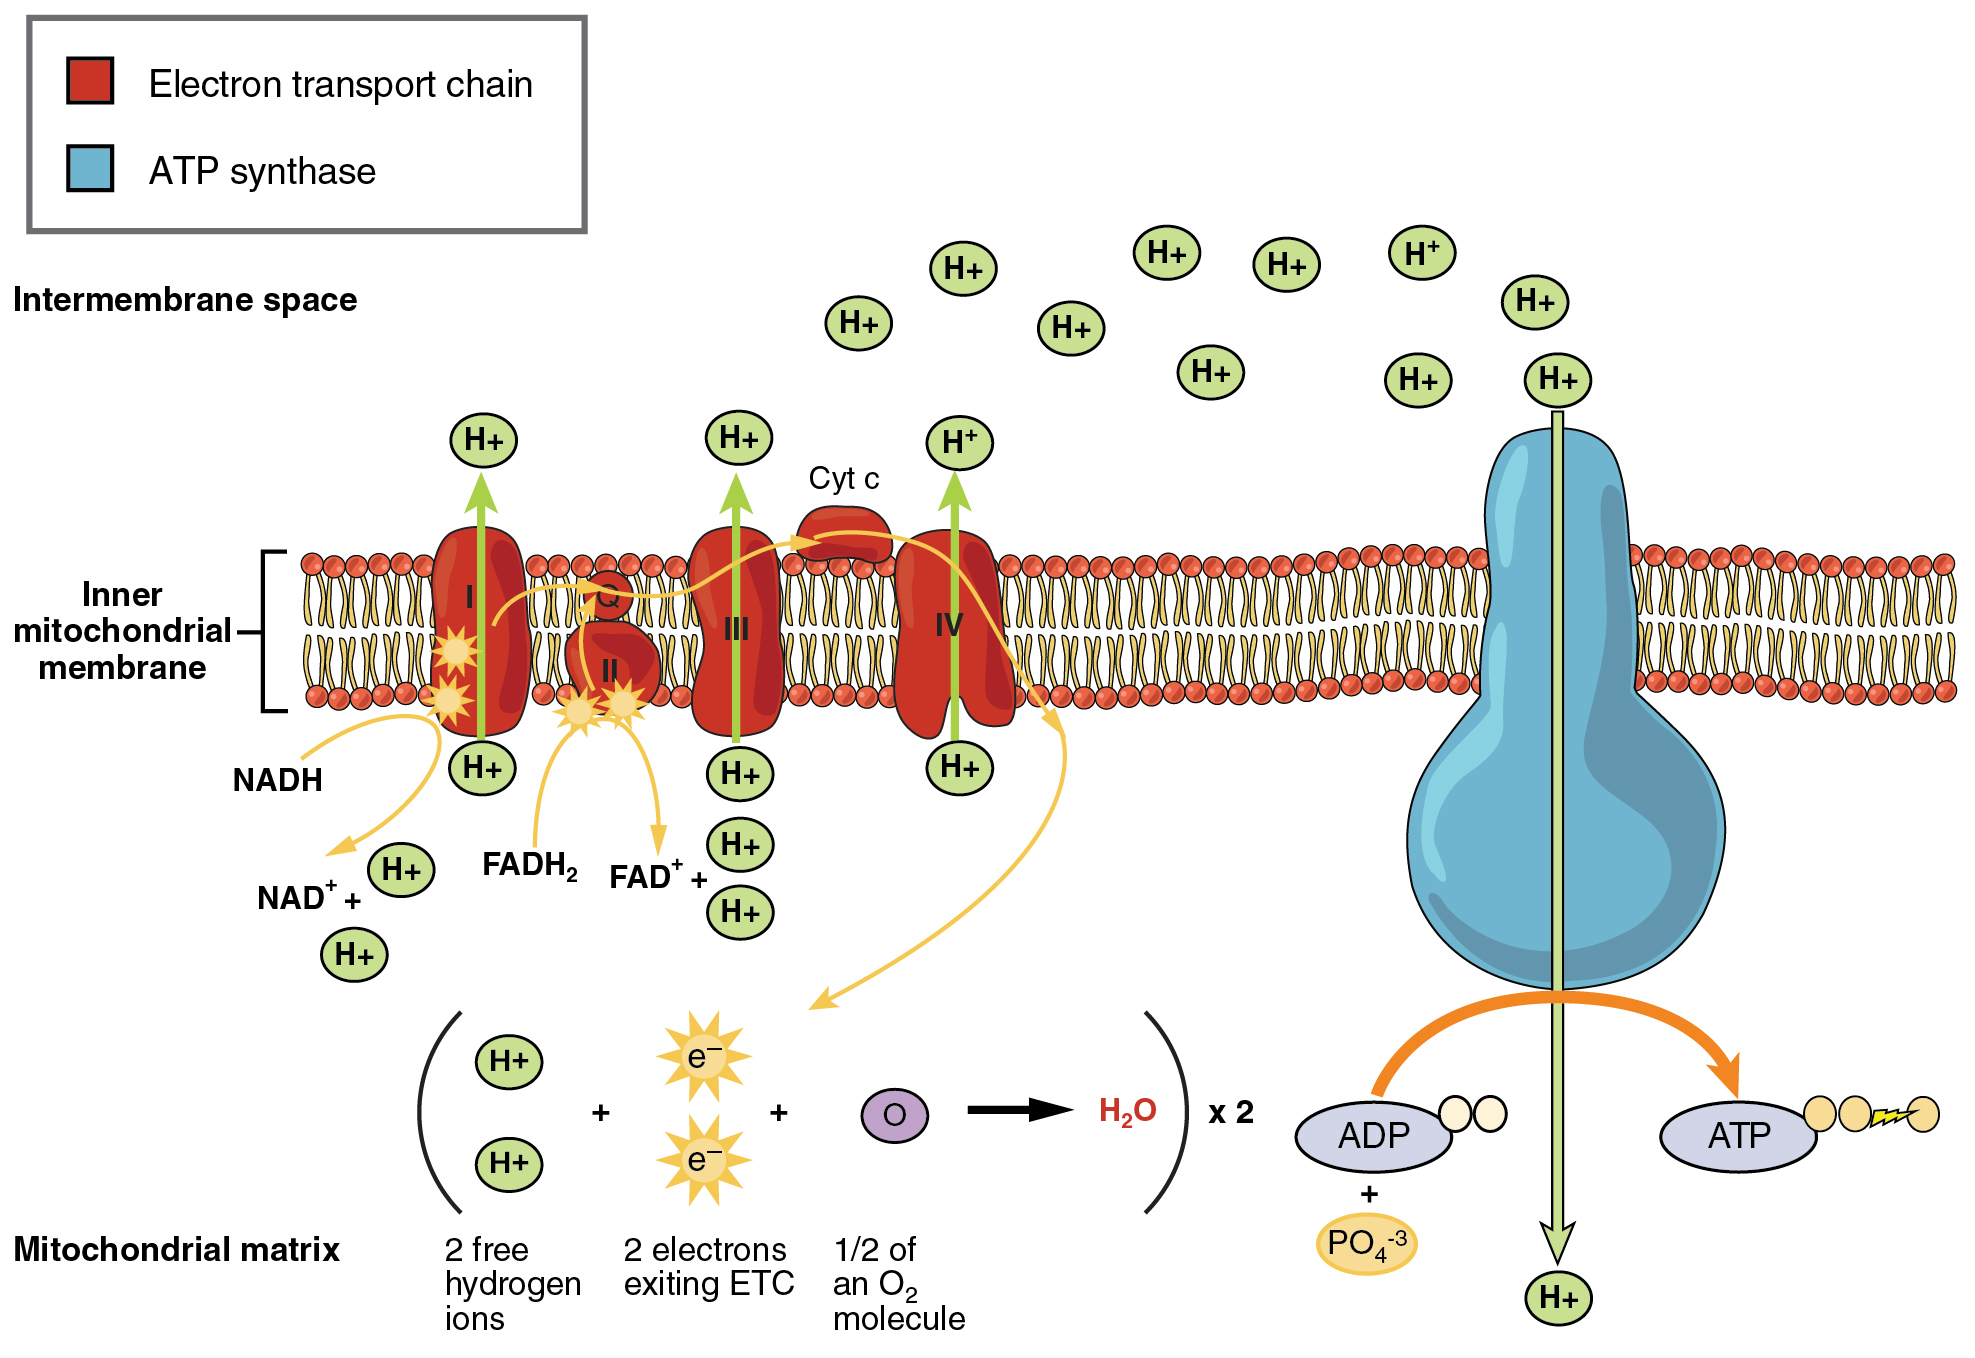
Figure 24.8 Electron Transport Chain The electron transport chain is a series of electron carriers and ion pumps that are used to pump H + ions out of the inner mitochondrial matrix.
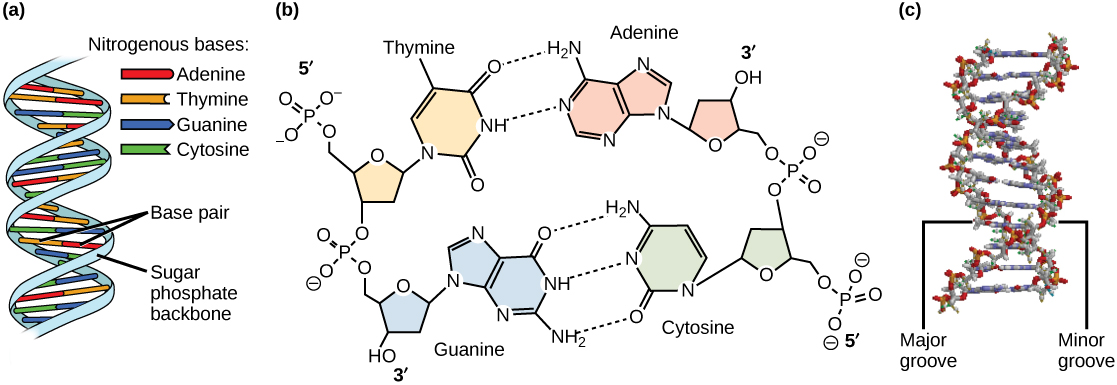
Figure 14.7 DNA has (a) a double helix structure and (b) phosphodiester bonds; the dotted lines between Thymine and Adenine and Guanine and Cytosine represent hydrogen bonds. The (c) major and minor grooves are binding sites for DNA binding proteins during processes such as transcription (the copying of RNA from DNA) and replication.
Figure 14.7 DNA has (a) a double helix structure and (b) phosphodiester bonds; the dotted lines between Thymine and Adenine and Guanine and Cytosine represent hydrogen bonds. The (c) major and minor grooves are binding sites for DNA binding proteins during processes such as transcription (the copying of RNA from DNA) and replication.
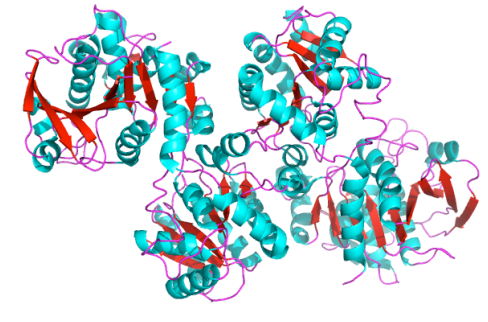
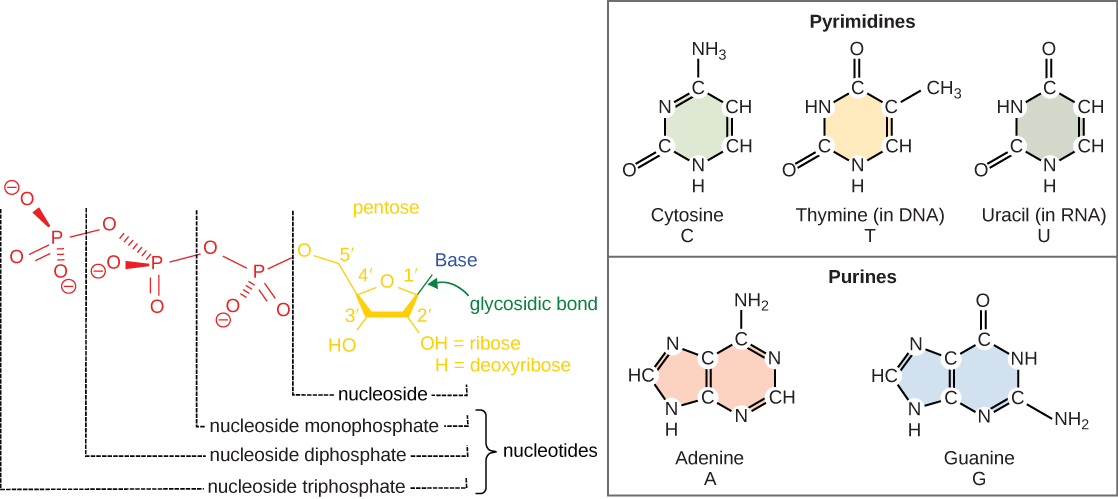
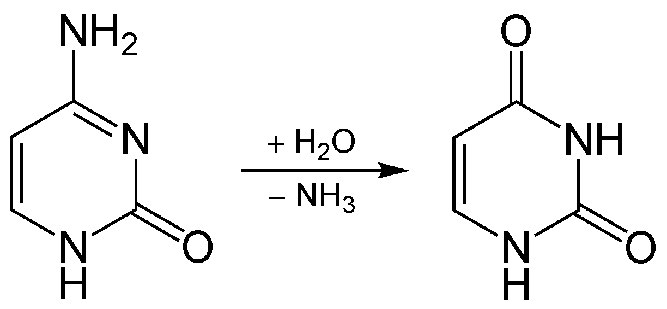
Figure 14.5 The purines have a double ring structure with a six-membered ring fused to a five-membered ring. Pyrimidines are smaller in size; they have a single six-membered ring structure.
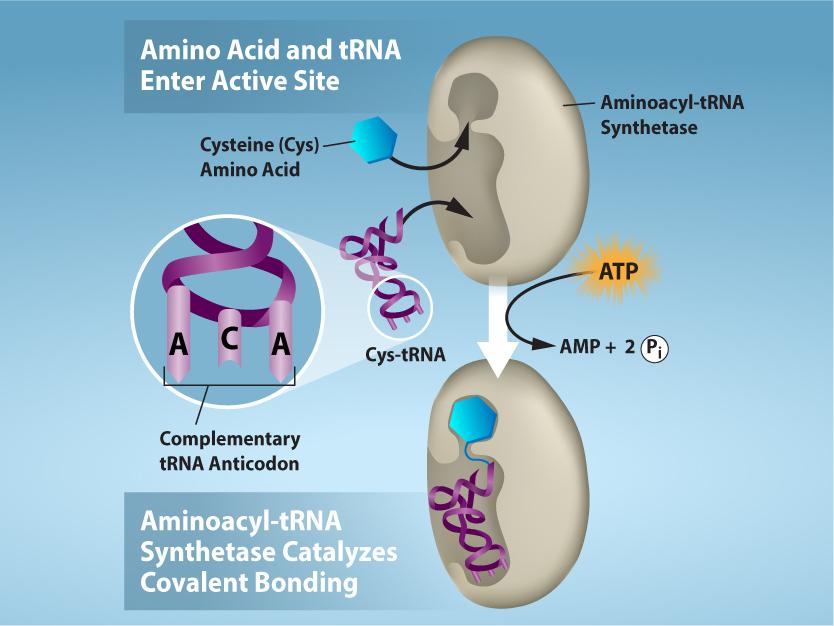
Figure 15.17 Charging of tRNAs with correct amino acids. Aminoacyl-tRNA synthetases catalyze covalent bond formation between the tRNA and the correct amino acid in preparation for translation. Because there are multiple amino acids, there are multiple different tRNA synthetases. All of the synthetases require energy, in the form of ATP, to make sure the correct amino acid is attached to the tRNA with the correct anticodon sequence. Credit: Rao, A., Ryan, K. and Tag, A. Department of Biology, Texas A&M University.
Rao, A., Ryan, K. and Tag, A. Department of Biology, Texas A&M University.; Mary Ann Clark, Matthew Douglas, and Jung Choi, Biology 2e, OpenStax. · CC BY-NC-SA 4.0
· Original image ↗ · Access for free ↗
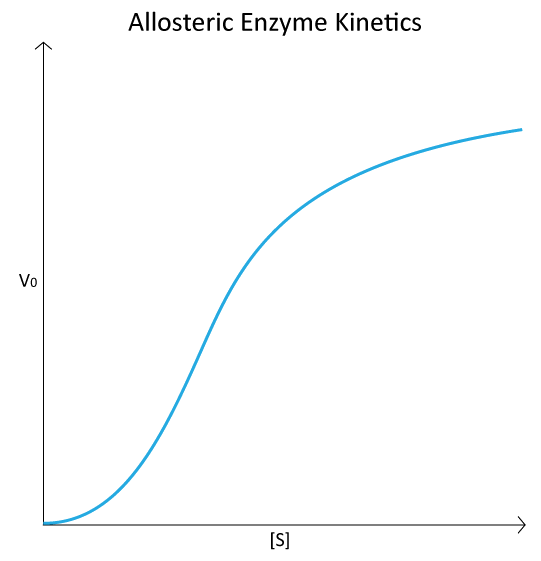
A change in protein activity caused by communication between binding sites. An effector can activate or inhibit; allostery does not imply a particular inhibition pattern.
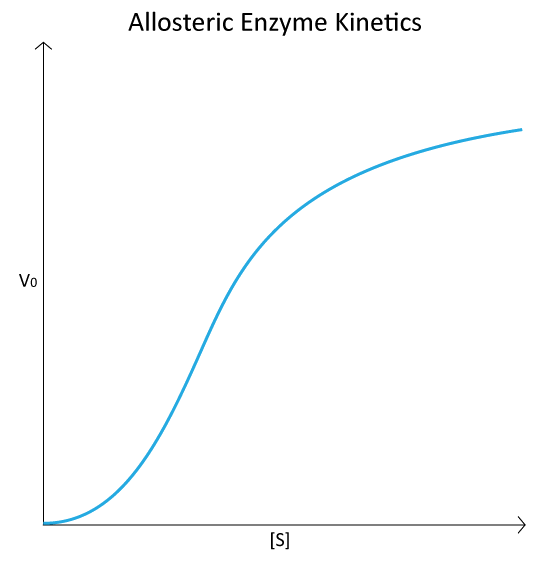
Figure 4.44 - Kinetic profile of an allosteric enzyme whose activity is controlled by a homotropic effector. Image by Aleia Kim
Kevin Ahern, Indira Rajagopal, and Taralyn Tan, Biochemistry Free For All, Oregon State University, via Biology LibreTexts. Image by Aleia Kim · CC BY-NC-SA 4.0
· Original image ↗ · Access for free ↗
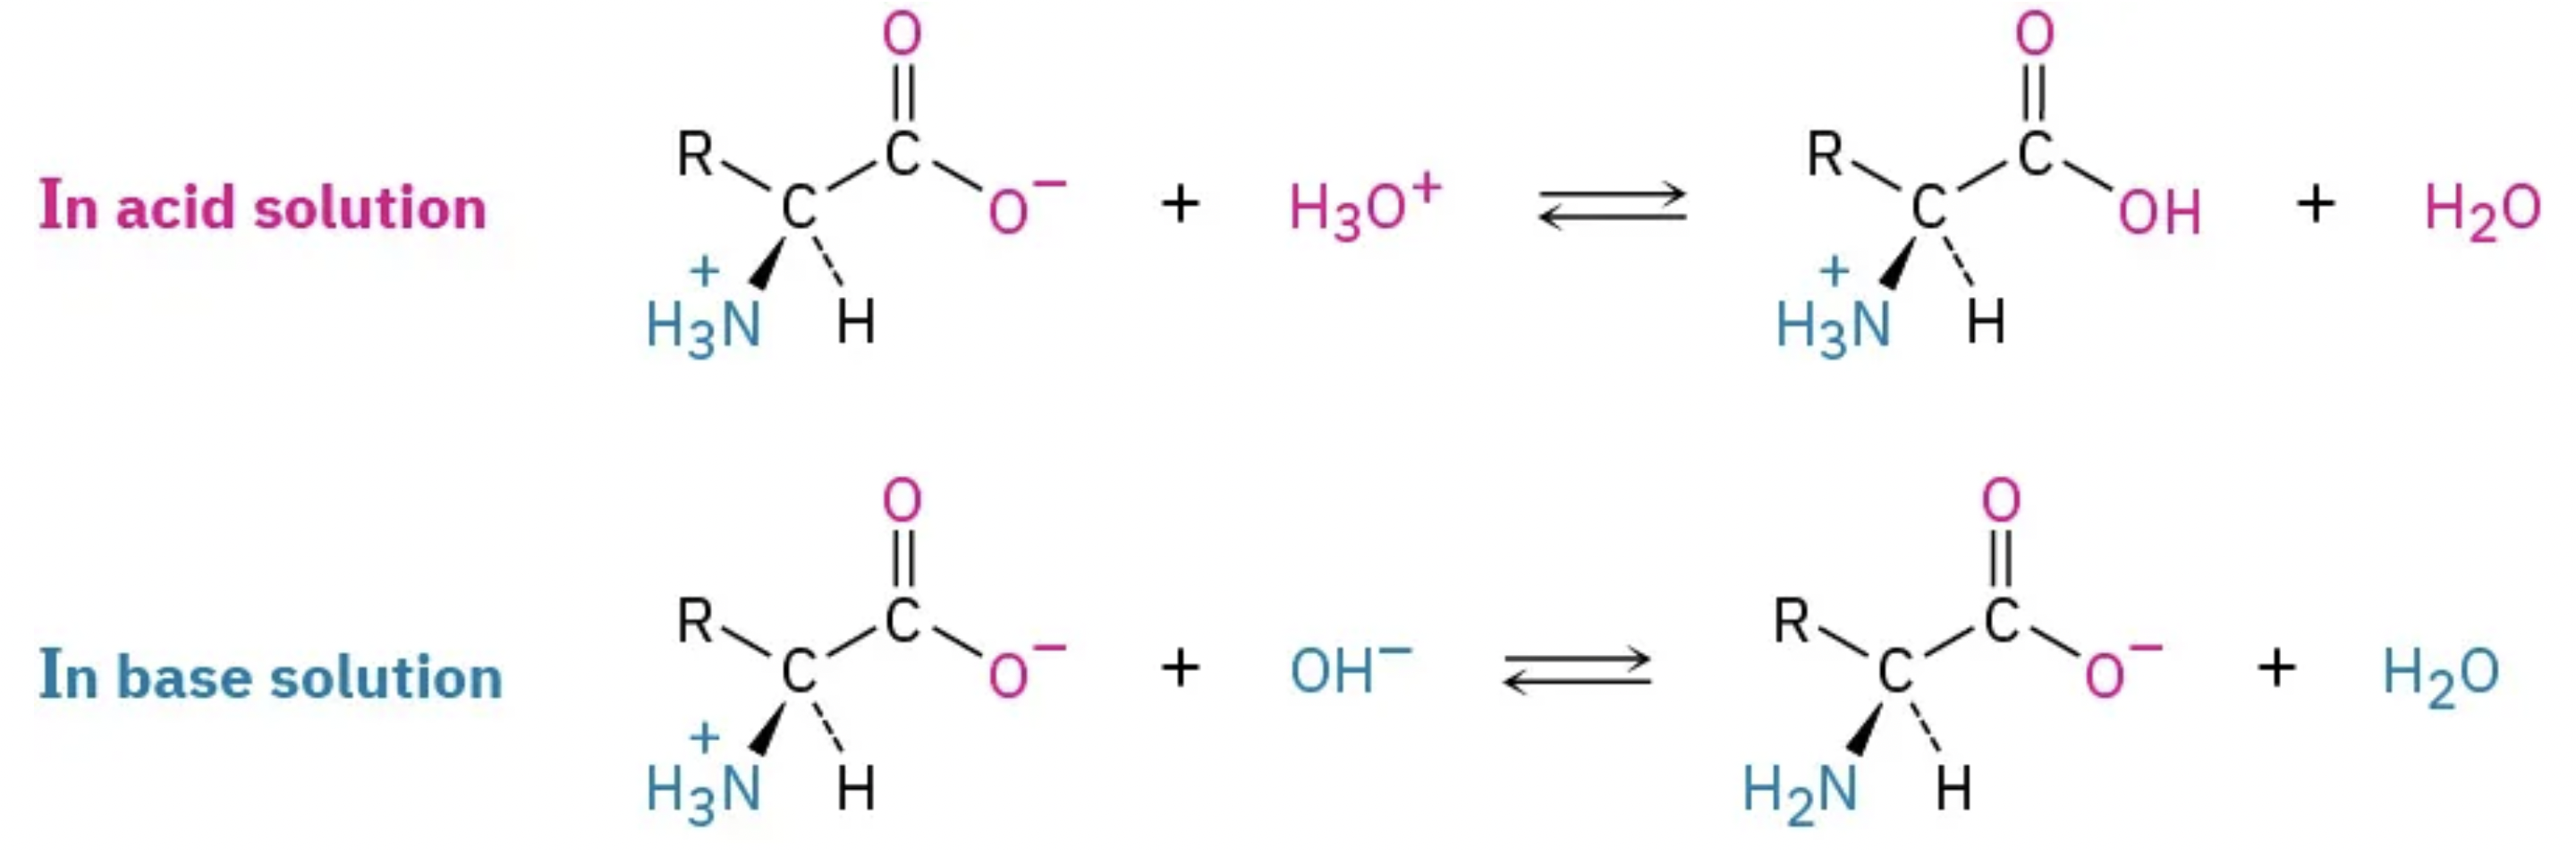
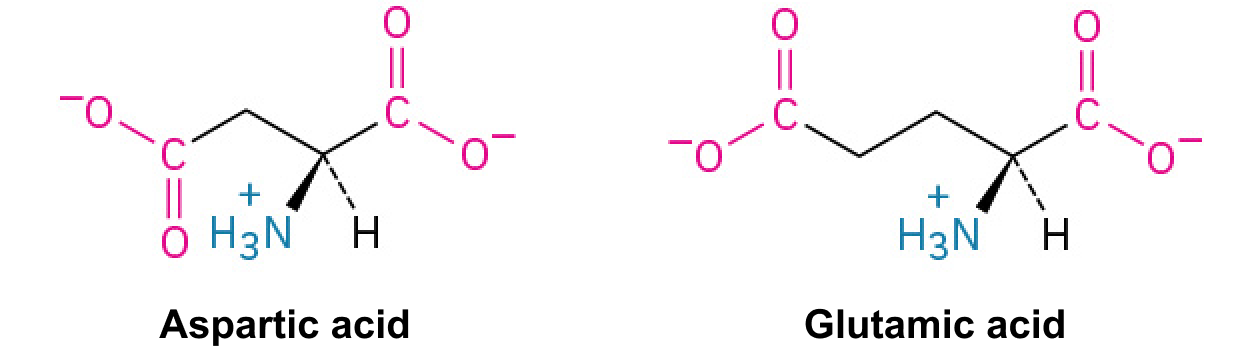
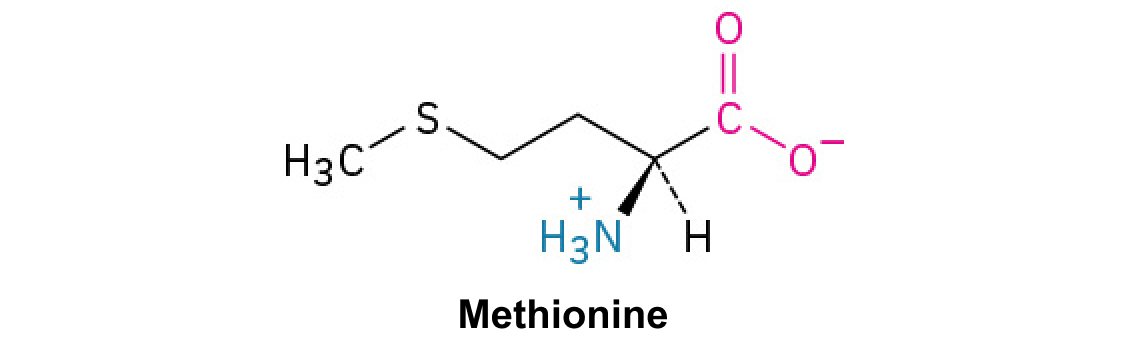
A nitrogen-containing functional group. A free amino acid’s amino group is typically protonated (NH₃⁺) near physiological pH; proline’s ring nitrogen is an exception to this formula.
Figure 15.17 Charging of tRNAs with correct amino acids. Aminoacyl-tRNA synthetases catalyze covalent bond formation between the tRNA and the correct amino acid in preparation for translation. Because there are multiple amino acids, there are multiple different tRNA synthetases. All of the synthetases require energy, in the form of ATP, to make sure the correct amino acid is attached to the tRNA with the correct anticodon sequence. Credit: Rao, A., Ryan, K. and Tag, A. Department of Biology, Texas A&M University.
Rao, A., Ryan, K. and Tag, A. Department of Biology, Texas A&M University.; Mary Ann Clark, Matthew Douglas, and Jung Choi, Biology 2e, OpenStax. · CC BY-NC-SA 4.0
· Original image ↗ · Access for free ↗
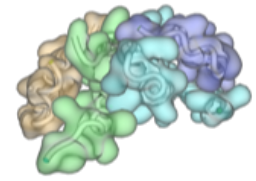
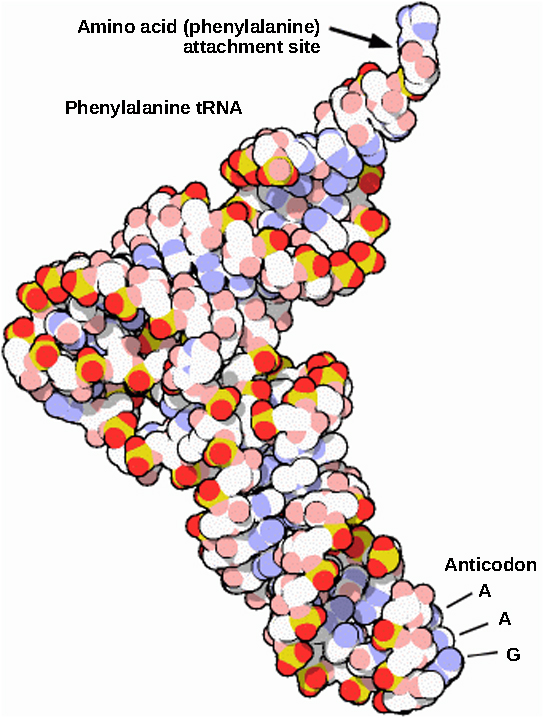
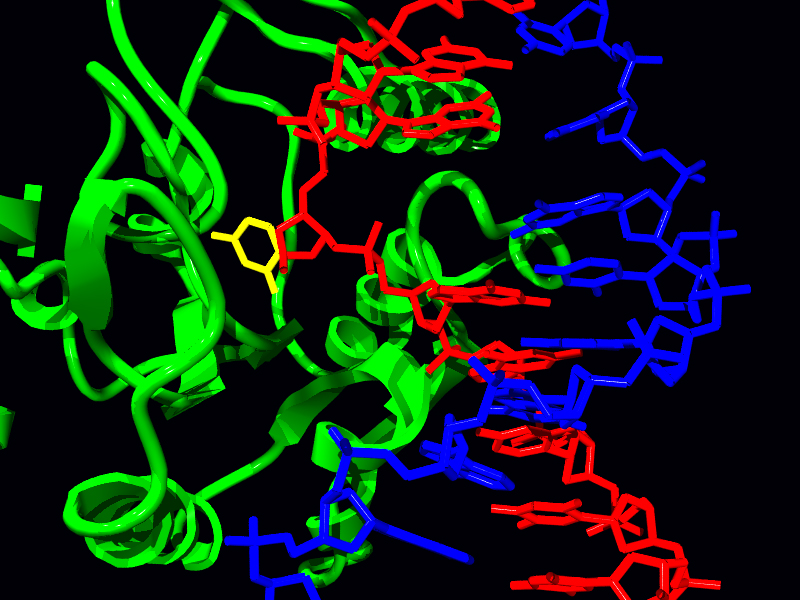
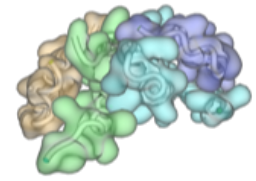
Figure 15.14 This is a space-filling model of a tRNA molecule that adds the amino acid phenylalanine to a growing polypeptide chain. The anticodon AAG binds the Codon UUC on the mRNA. The amino acid phenylalanine is attached to the other end of the tRNA.
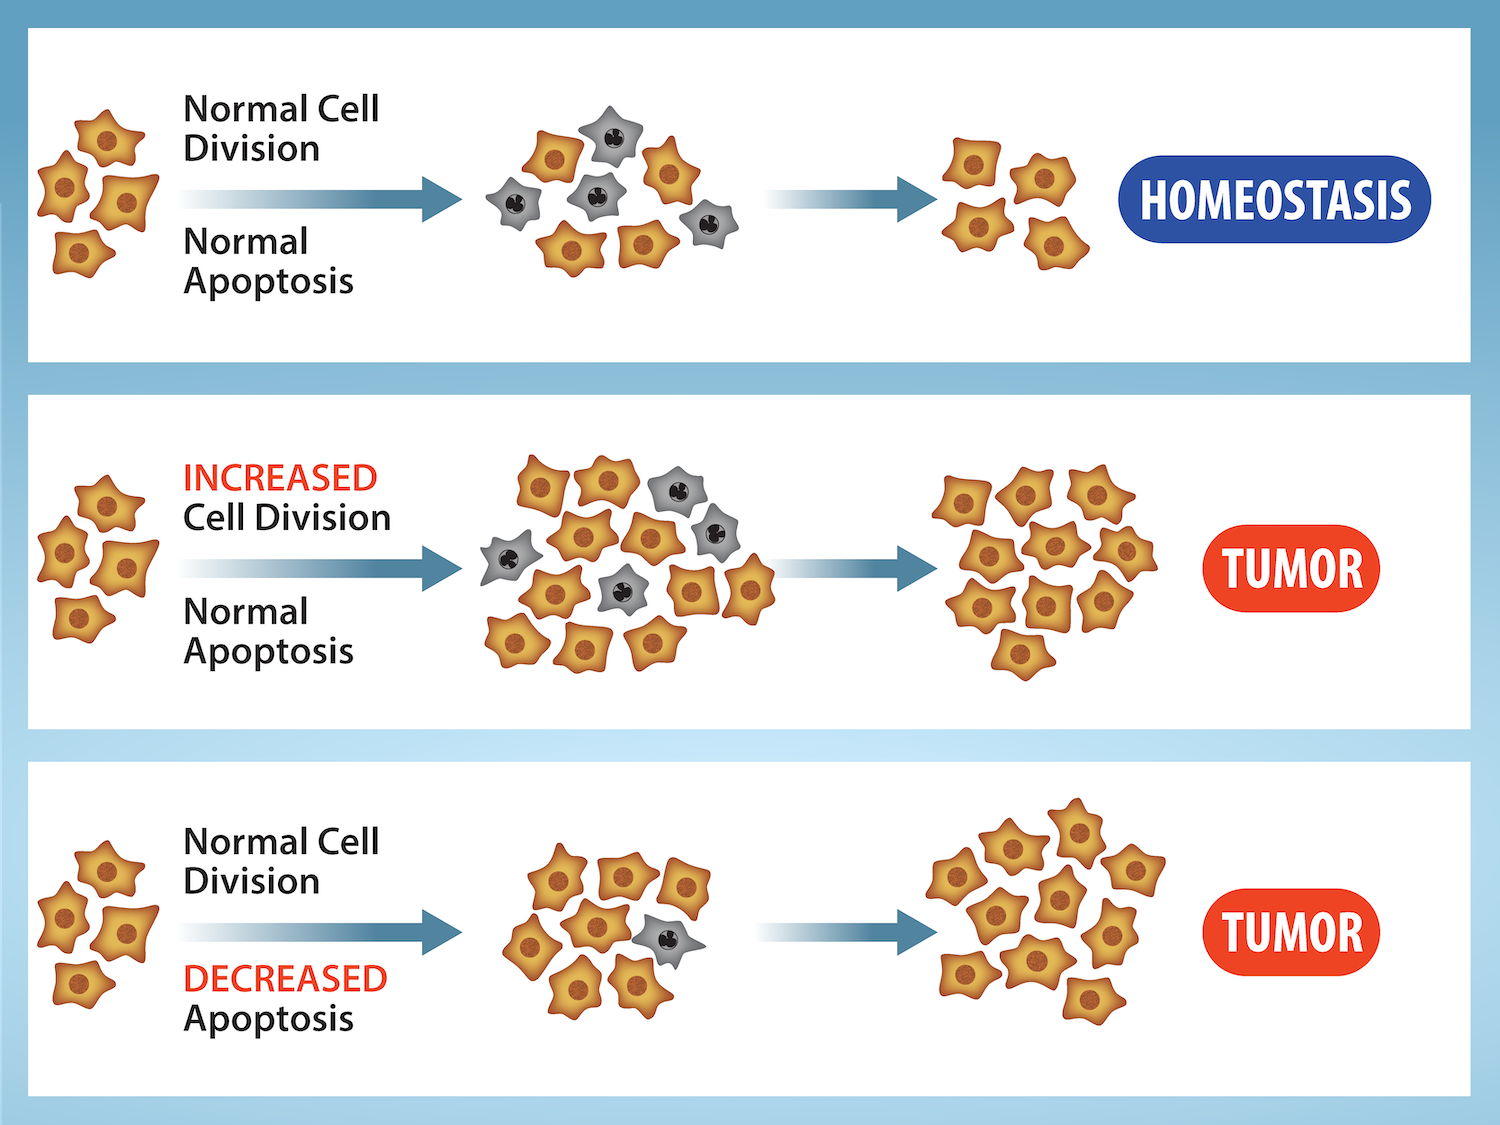
Figure 10.15 Cell Division and Apoptosis. In an adult organism, normal cell division is balanced by apoptosis (programmed cell death) to maintain a constant cell number in homeostasis. Either an increase in cell division or a decrease in apoptosis leads an increase in the number of cells and tumor formation. Credit: Rao, A. and Ryan, K. Department of Biology, Texas A&M University.
Rao, A. and Ryan, K. Department of Biology, Texas A&M University. Mary Ann Clark, Matthew Douglas, and Jung Choi, Biology 2e, OpenStax. · CC BY-NC-SA 4.0
· Original image ↗ · Access for free ↗
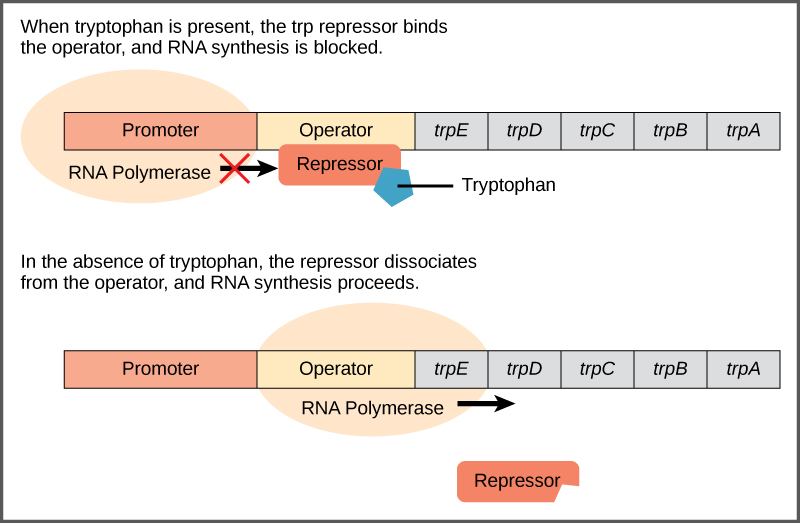
Figure 16.4 The tryptophan operon. The five genes that are needed to synthesize tryptophan in E. coli are located next to each other in the trp operon. When tryptophan is plentiful, two tryptophan molecules bind the repressor protein at the operator sequence. This physically blocks the RNA polymerase from transcribing the tryptophan genes. When tryptophan is absent, the repressor protein does not bind to the operator and the genes are transcribed.
Figure 15.13 Pre-mRNA splicing involves the precise removal of introns from the primary RNA transcript. The splicing process is catalyzed by protein complexes called spliceosomes that are composed of proteins and RNA molecules called small nuclear RNAs (snRNAs). Spliceosomes recognize sequences at the 5' and 3' end of the intron. Rao, A. and Ryan, K. Department of Biology, Texas A&M University.
Rao, A. and Ryan, K. Department of Biology, Texas A&M University.; Mary Ann Clark, Matthew Douglas, and Jung Choi, Biology 2e, OpenStax. · CC BY-NC-SA 4.0
· Original image ↗ · Access for free ↗
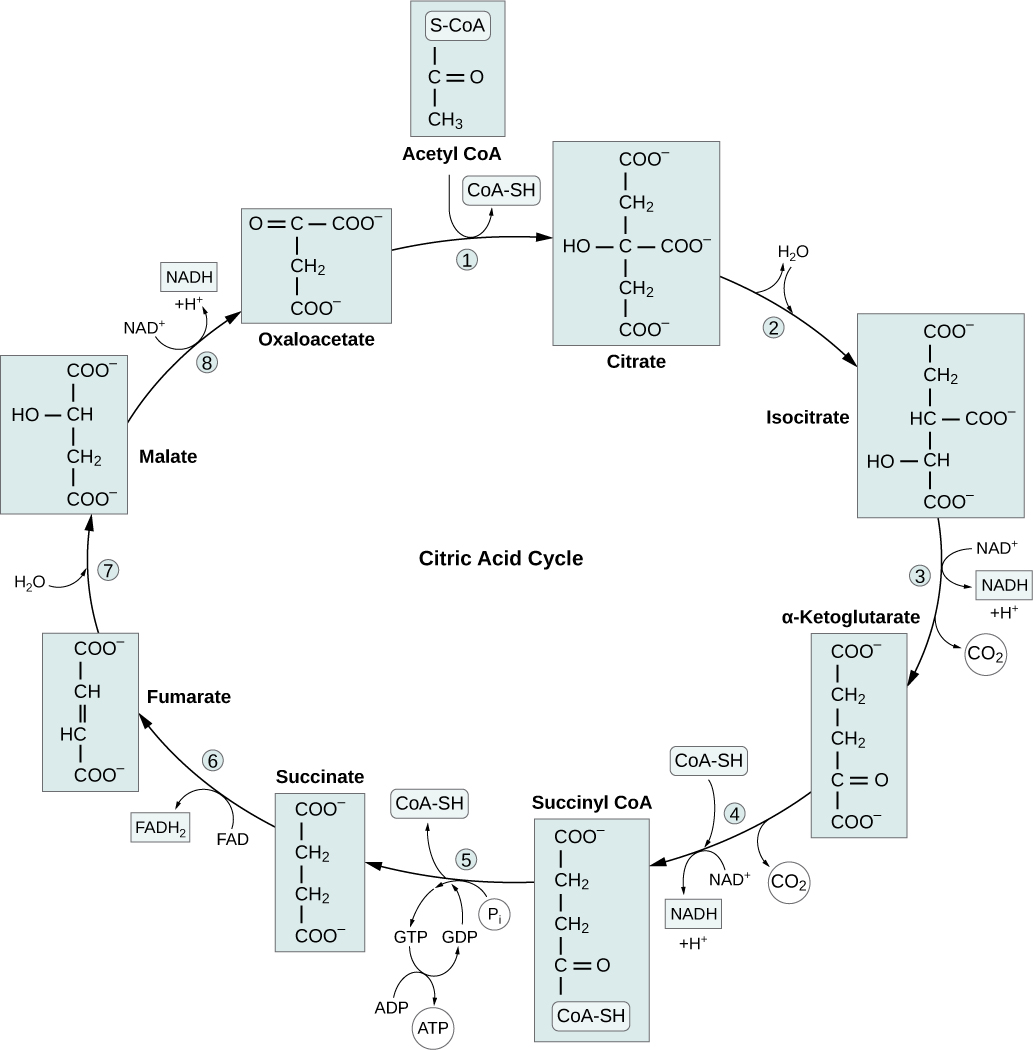
Figure 7.11 In the citric acid cycle, the acetyl group from acetyl CoA is attached to a four-carbon oxaloacetate molecule to form a six-carbon citrate molecule. Through a series of steps, citrate is oxidized, releasing two carbon dioxide molecules for each acetyl group fed into the cycle. In the process, three NAD + molecules are reduced to NADH, one FAD molecule is reduced to FADH 2 , and one ATP or GTP (depending on the cell type) is produced (by substrate-level phosphorylation). Because the final product of the citric acid cycle is also the first reactant, the cycle runs continuously in the presence of sufficient reactants. Credit: Rao, A., Ryan, K., Tag, A., and Fletcher, S. Department of Biology, Texas
A&M University.
Figure 7.11 In the citric acid cycle, the acetyl group from acetyl CoA is attached to a four-carbon oxaloacetate molecule to form a six-carbon citrate molecule. Through a series of steps, citrate is oxidized, releasing two carbon dioxide molecules for each acetyl group fed into the cycle. In the process, three NAD + molecules are reduced to NADH, one FAD molecule is reduced to FADH 2 , and one ATP or GTP (depending on the cell type) is produced (by substrate-level phosphorylation). Because the final product of the citric acid cycle is also the first reactant, the cycle runs continuously in the presence of sufficient reactants. Credit: Rao, A., Ryan, K., Tag, A., and Fletcher, S. Department of Biology, Texas
A&M University.
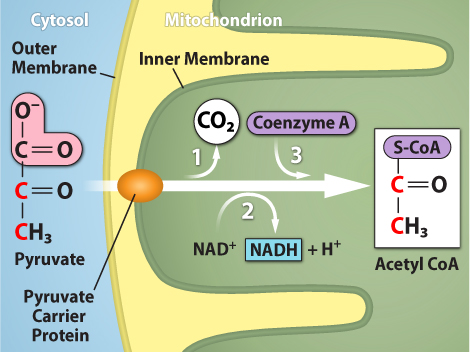
Figure 7.10 Upon entering the mitochondrial matrix, a multienzyme complex converts pyruvate into acetyl CoA. In the process, carbon dioxide is released, and one molecule of NADH is formed. Credit: Rao, A., Ryan, K. and Tag, A. Department of Biology, Texas A&M University.
Figure 15.4 This figure shows the genetic code for translating each nucleotide triplet in mRNA into an amino acid or a termination signal in a protein. (credit: modification of work by NIH)
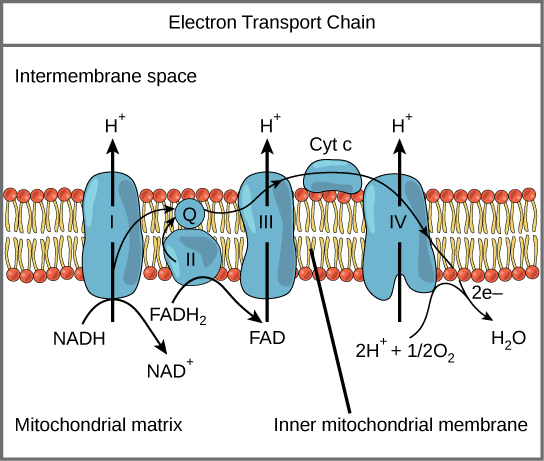
Figure 7.12 The electron transport chain is a series of electron transporters embedded in the inner mitochondrial membrane that shuttles electrons from NADH and FADH 2 to molecular oxygen. In the process, protons are pumped from the mitochondrial matrix to the intermembrane space, and oxygen is reduced to form water.
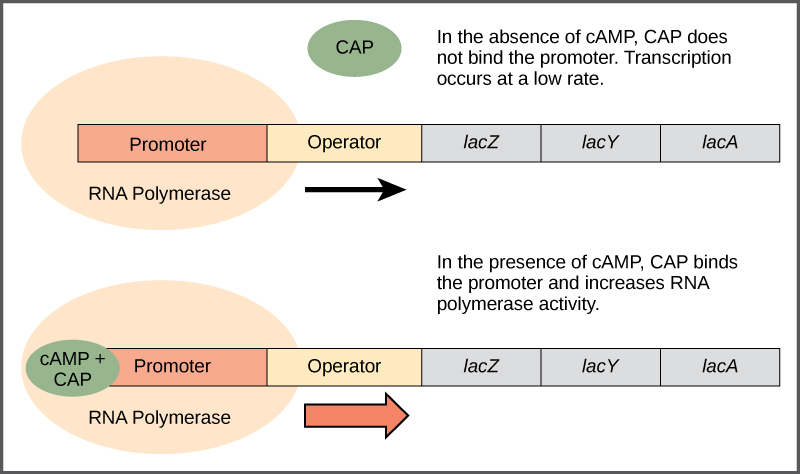
Figure 16.5 Transcriptional activation by the CAP protein. When glucose levels fall, E. coli may use other sugars for fuel but must transcribe new genes to do so. As glucose supplies become limited, cAMP levels increase. This cAMP binds to the CAP protein, a positive regulator that binds to a promoter region upstream of the genes required to use other sugar sources.
Figure 7.12 The electron transport chain is a series of electron transporters embedded in the inner mitochondrial membrane that shuttles electrons from NADH and FADH 2 to molecular oxygen. In the process, protons are pumped from the mitochondrial matrix to the intermembrane space, and oxygen is reduced to form water.
Figure 14.5 The purines have a double ring structure with a six-membered ring fused to a five-membered ring. Pyrimidines are smaller in size; they have a single six-membered ring structure.
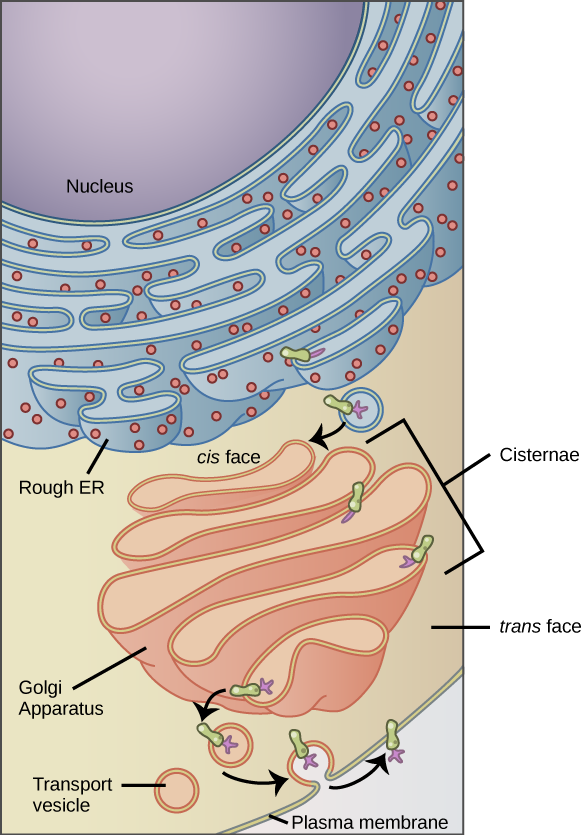
Figure 4.18 Membrane and secretory proteins are synthesized in the rough endoplasmic reticulum (RER). The RER also sometimes modifies proteins. In this illustration, a (green) integral membrane protein is modified by attachment of a (purple) carbohydrate in the ER. Vesicles with the integral protein bud from the ER and fuse with the Golgi apparatus' cis face. As the protein passes along the Golgi’s cisternae, the addition of more carbohydrates further modifies it. After its synthesis is complete, it exits as an integral membrane protein of the vesicle that buds from the Golgi’s trans face. When the vesicle fuses with the cell membrane, the protein becomes an integral portion of that cell membrane. (credit: modification of work by Magnus Manske)
Figure 14.5 The purines have a double ring structure with a six-membered ring fused to a five-membered ring. Pyrimidines are smaller in size; they have a single six-membered ring structure.
An electrical property that can be positive or negative. Opposite charges attract and like charges repel; net charge is the sum of all charges on a particle.
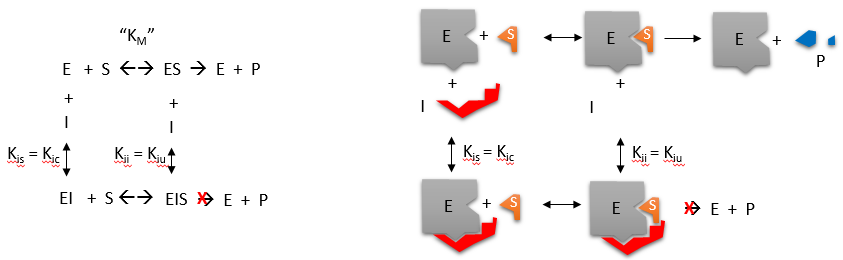
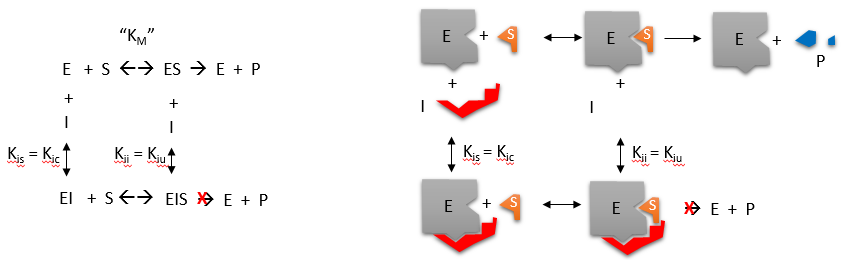
A substance that reduces enzyme activity. The binding mechanism and rate data determine whether inhibition is competitive, uncompetitive, mixed, or another type.
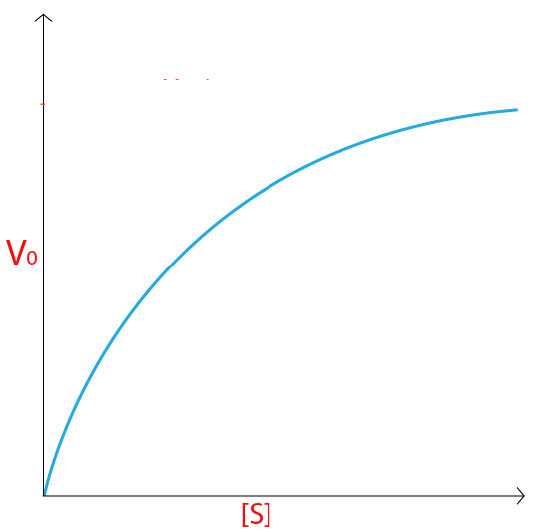
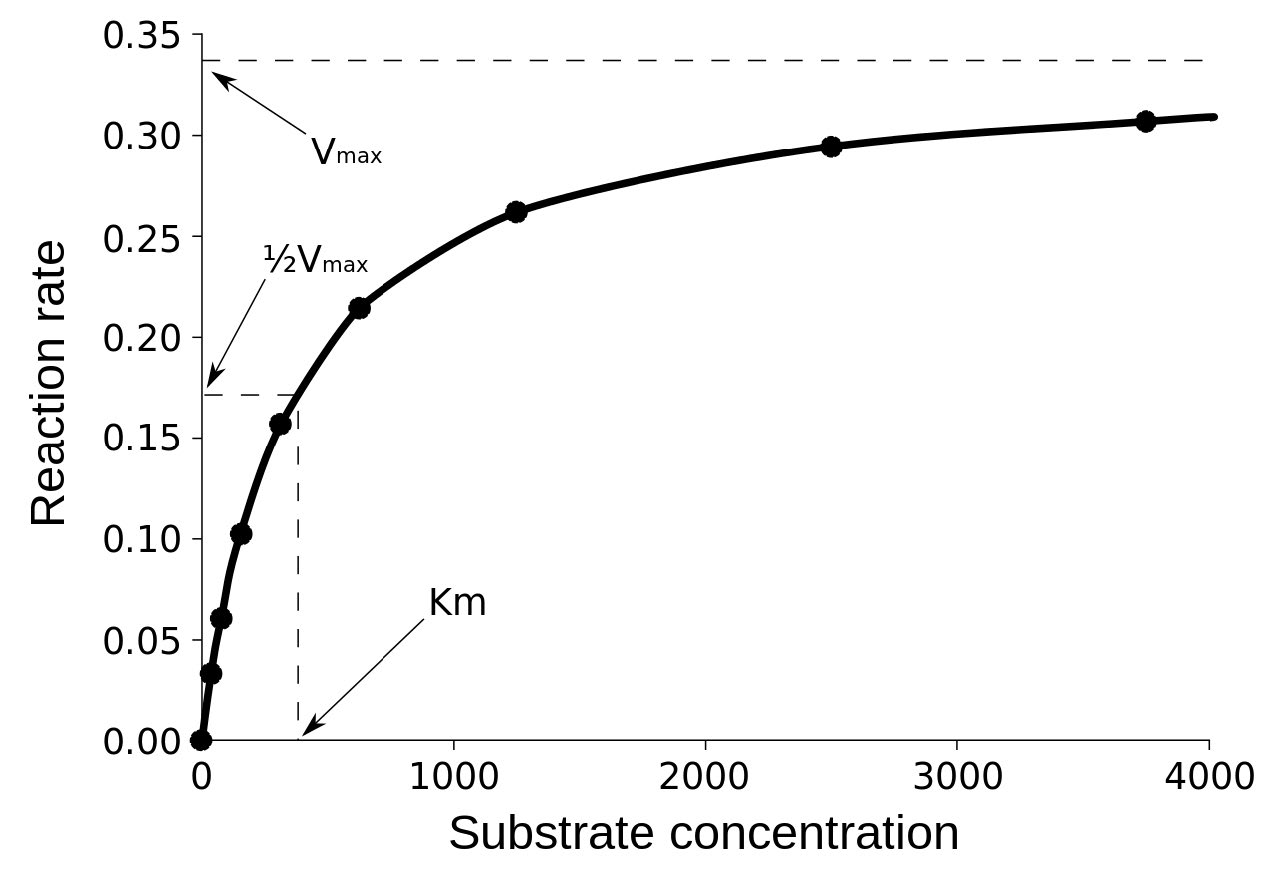
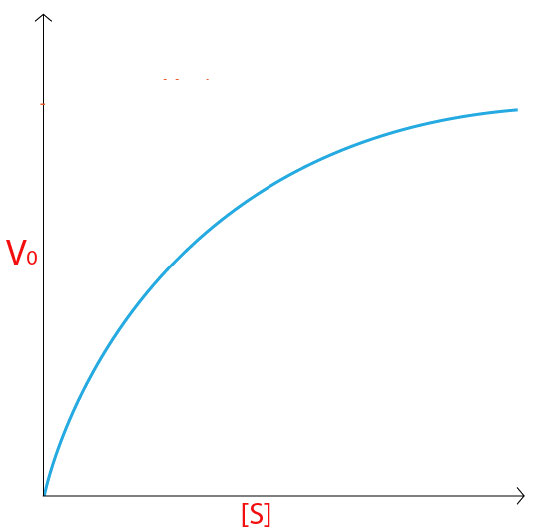
Figure 4.18 - Kinetics of an enzyme obeying Michaelis-Menten kinetics. Image by Aleia Kim
Kevin Ahern, Indira Rajagopal, and Taralyn Tan, Biochemistry Free For All, Oregon State University, via Biology LibreTexts. Image by Aleia Kim · CC BY-NC-SA 4.0
· Original image ↗ · Access for free ↗
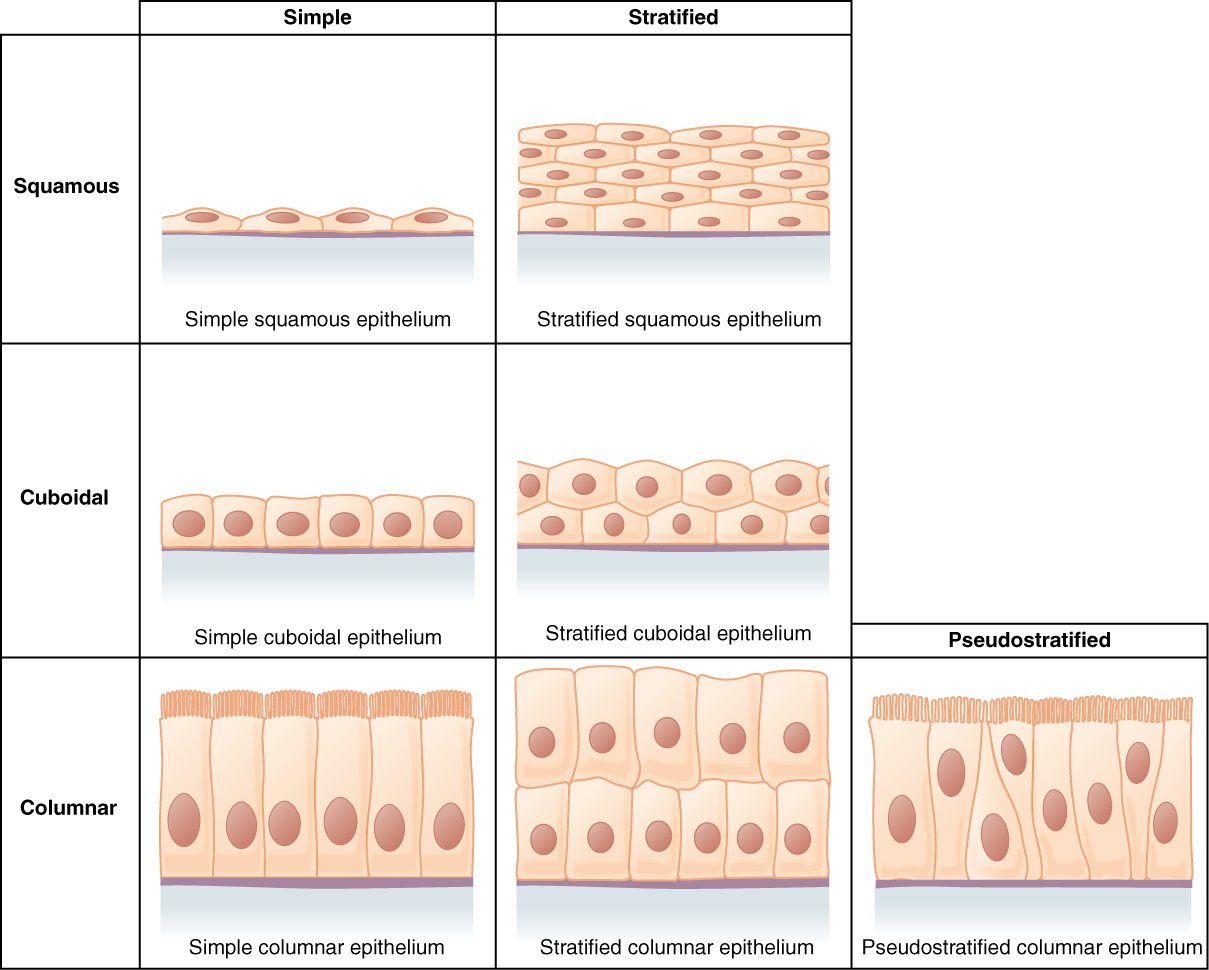
Figure 4.6 Cells of Epithelial Tissue Simple epithelial tissue is organized as a single layer of cells and stratified epithelial tissue is formed by several layers of cells.
A ratio of product to reactant activities at equilibrium, each raised to its stoichiometric coefficient. At a fixed temperature, a catalyst does not change this ratio.
Figure 15.11 Eukaryotic pre-mRNA processing. In addition to 5’ Cap and 3’ Poly-A Tail addition, introns must be precisely removed and exons joined to generate a functional mRNA. Nucleotides upstream (towards the 5’cap) of the translation START codon are part of the 5’ untranslated region (5’ UTR). Nucleotides downstream (towards 3’end) of the STOP codon form the 3’ UTR. Both 5’ and 3’ UTRs are important for regulating translation initiation and mRNA stability. Credit: Rao, A., Ryan, K. Fletcher, S. and Tag, A. Department of Biology, Texas A&M University.
Rao, A., Ryan, K. Fletcher, S. and Tag, A. Department of Biology, Texas A&M University.; Mary Ann Clark, Matthew Douglas, and Jung Choi, Biology 2e, OpenStax. · CC BY-NC-SA 4.0
· Original image ↗ · Access for free ↗
Figure 15.10 A generalized promoter of a gene transcribed by RNA polymerase II is shown. Transcription factors recognize the promoter. RNA polymerase II then binds and forms the transcription initiation complex.
Figure 14.5 The purines have a double ring structure with a six-membered ring fused to a five-membered ring. Pyrimidines are smaller in size; they have a single six-membered ring structure.
Figure 15.18 Translation begins when an initiator tRNA anticodon recognizes a start codon on mRNA bound to a small ribosomal subunit. The large ribosomal subunit joins the small subunit, and a second tRNA is recruited. As the mRNA moves relative to the ribosome, successive tRNAs move through the ribosome and the polypeptide chain is formed. Entry of a release factor into the A site terminates translation and the components dissociate.
Figure 15.11 Eukaryotic pre-mRNA processing. In addition to 5’ Cap and 3’ Poly-A Tail addition, introns must be precisely removed and exons joined to generate a functional mRNA. Nucleotides upstream (towards the 5’cap) of the translation START codon are part of the 5’ untranslated region (5’ UTR). Nucleotides downstream (towards 3’end) of the STOP codon form the 3’ UTR. Both 5’ and 3’ UTRs are important for regulating translation initiation and mRNA stability. Credit: Rao, A., Ryan, K. Fletcher, S. and Tag, A. Department of Biology, Texas A&M University.
Rao, A., Ryan, K. Fletcher, S. and Tag, A. Department of Biology, Texas A&M University.; Mary Ann Clark, Matthew Douglas, and Jung Choi, Biology 2e, OpenStax. · CC BY-NC-SA 4.0
· Original image ↗ · Access for free ↗
Figure 15.13 Pre-mRNA splicing involves the precise removal of introns from the primary RNA transcript. The splicing process is catalyzed by protein complexes called spliceosomes that are composed of proteins and RNA molecules called small nuclear RNAs (snRNAs). Spliceosomes recognize sequences at the 5' and 3' end of the intron. Rao, A. and Ryan, K. Department of Biology, Texas A&M University.
Rao, A. and Ryan, K. Department of Biology, Texas A&M University.; Mary Ann Clark, Matthew Douglas, and Jung Choi, Biology 2e, OpenStax. · CC BY-NC-SA 4.0
· Original image ↗ · Access for free ↗
The exponent needed to obtain a number from a chosen fixed number. For decimal logarithms, log₁₀(100) = 2 because 10² = 100; pH uses the negative decimal logarithm of hydrogen ion activity.
Figure 4.18 Membrane and secretory proteins are synthesized in the rough endoplasmic reticulum (RER). The RER also sometimes modifies proteins. In this illustration, a (green) integral membrane protein is modified by attachment of a (purple) carbohydrate in the ER. Vesicles with the integral protein bud from the ER and fuse with the Golgi apparatus' cis face. As the protein passes along the Golgi’s cisternae, the addition of more carbohydrates further modifies it. After its synthesis is complete, it exits as an integral membrane protein of the vesicle that buds from the Golgi’s trans face. When the vesicle fuses with the cell membrane, the protein becomes an integral portion of that cell membrane. (credit: modification of work by Magnus Manske)
A supporting material, such as a porous gel or the solid support in a chromatography column. Its properties influence movement and binding of sample molecules.
A thin boundary or sheet. Cell membranes are lipid bilayers containing proteins; blotting membranes are synthetic supports that hold proteins or nucleic acids for detection.
Figure 15.11 Eukaryotic pre-mRNA processing. In addition to 5’ Cap and 3’ Poly-A Tail addition, introns must be precisely removed and exons joined to generate a functional mRNA. Nucleotides upstream (towards the 5’cap) of the translation START codon are part of the 5’ untranslated region (5’ UTR). Nucleotides downstream (towards 3’end) of the STOP codon form the 3’ UTR. Both 5’ and 3’ UTRs are important for regulating translation initiation and mRNA stability. Credit: Rao, A., Ryan, K. Fletcher, S. and Tag, A. Department of Biology, Texas A&M University.
Rao, A., Ryan, K. Fletcher, S. and Tag, A. Department of Biology, Texas A&M University.; Mary Ann Clark, Matthew Douglas, and Jung Choi, Biology 2e, OpenStax. · CC BY-NC-SA 4.0
· Original image ↗ · Access for free ↗
Figure 4.18 Membrane and secretory proteins are synthesized in the rough endoplasmic reticulum (RER). The RER also sometimes modifies proteins. In this illustration, a (green) integral membrane protein is modified by attachment of a (purple) carbohydrate in the ER. Vesicles with the integral protein bud from the ER and fuse with the Golgi apparatus' cis face. As the protein passes along the Golgi’s cisternae, the addition of more carbohydrates further modifies it. After its synthesis is complete, it exits as an integral membrane protein of the vesicle that buds from the Golgi’s trans face. When the vesicle fuses with the cell membrane, the protein becomes an integral portion of that cell membrane. (credit: modification of work by Magnus Manske)
Figure 7.11 In the citric acid cycle, the acetyl group from acetyl CoA is attached to a four-carbon oxaloacetate molecule to form a six-carbon citrate molecule. Through a series of steps, citrate is oxidized, releasing two carbon dioxide molecules for each acetyl group fed into the cycle. In the process, three NAD + molecules are reduced to NADH, one FAD molecule is reduced to FADH 2 , and one ATP or GTP (depending on the cell type) is produced (by substrate-level phosphorylation). Because the final product of the citric acid cycle is also the first reactant, the cycle runs continuously in the presence of sufficient reactants. Credit: Rao, A., Ryan, K., Tag, A., and Fletcher, S. Department of Biology, Texas
A&M University.
Figure 14.5 The purines have a double ring structure with a six-membered ring fused to a five-membered ring. Pyrimidines are smaller in size; they have a single six-membered ring structure.
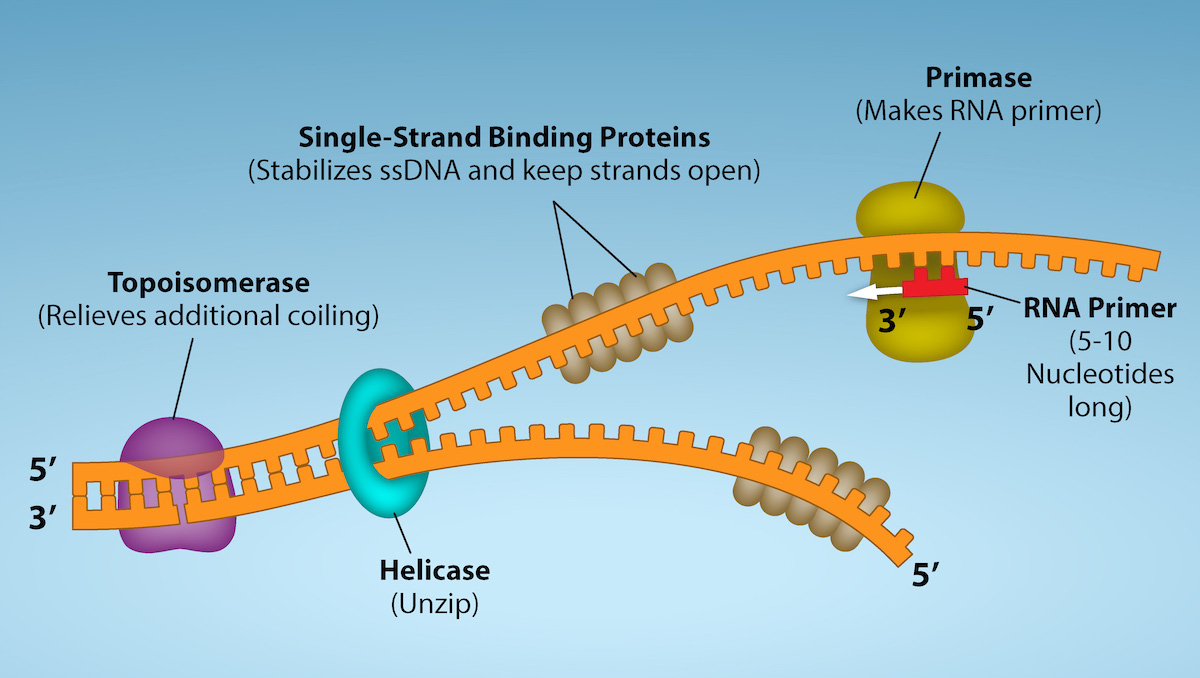
Figure 14.14 First Components of DNA Replication. As DNA replication begins, DNA Helicase, a large enzyme, separates the two strands of DNA so that they can act as templates for replication. Single-strand binding proteins bind to each strand to stabilize and prevent them from reforming the double helix. Primase, an RNA polymerase, binds to the single stranded DNA and synthesizes a short RNA primer in the 5’ to 3’ direction that is antiparallel to the parental strand. This RNA primer allows for DNA polymerase to begin replicating the DNA. Topoisomerase binds to the double helix upstream of the replication fork to prevent additional coiling by making small cuts in one of the DNA strands.
Credit: Rao, A., Ryan, K. Fletcher, S. and Tag, A. Department of Biology, Texas A&M University.
Figure 14.5 The purines have a double ring structure with a six-membered ring fused to a five-membered ring. Pyrimidines are smaller in size; they have a single six-membered ring structure.
Figure 14.5 The purines have a double ring structure with a six-membered ring fused to a five-membered ring. Pyrimidines are smaller in size; they have a single six-membered ring structure.
Figure 14.14 First Components of DNA Replication. As DNA replication begins, DNA Helicase, a large enzyme, separates the two strands of DNA so that they can act as templates for replication. Single-strand binding proteins bind to each strand to stabilize and prevent them from reforming the double helix. Primase, an RNA polymerase, binds to the single stranded DNA and synthesizes a short RNA primer in the 5’ to 3’ direction that is antiparallel to the parental strand. This RNA primer allows for DNA polymerase to begin replicating the DNA. Topoisomerase binds to the double helix upstream of the replication fork to prevent additional coiling by making small cuts in one of the DNA strands.
Credit: Rao, A., Ryan, K. Fletcher, S. and Tag, A. Department of Biology, Texas A&M University.
Figure 4.44 - Kinetic profile of an allosteric enzyme whose activity is controlled by a homotropic effector. Image by Aleia Kim
Kevin Ahern, Indira Rajagopal, and Taralyn Tan, Biochemistry Free For All, Oregon State University, via Biology LibreTexts. Image by Aleia Kim · CC BY-NC-SA 4.0
· Original image ↗ · Access for free ↗
Figure 12.19 Reaction diagrams for an endothermic process in the absence (red curve) and presence (blue curve) of a catalyst. The catalyzed pathway involves a two-step mechanism (note the presence of two transition states) and an intermediate species (represented by the valley between the two transitions states).
Figure 14.5 The purines have a double ring structure with a six-membered ring fused to a five-membered ring. Pyrimidines are smaller in size; they have a single six-membered ring structure.
Figure 15.13 Pre-mRNA splicing involves the precise removal of introns from the primary RNA transcript. The splicing process is catalyzed by protein complexes called spliceosomes that are composed of proteins and RNA molecules called small nuclear RNAs (snRNAs). Spliceosomes recognize sequences at the 5' and 3' end of the intron. Rao, A. and Ryan, K. Department of Biology, Texas A&M University.
Rao, A. and Ryan, K. Department of Biology, Texas A&M University.; Mary Ann Clark, Matthew Douglas, and Jung Choi, Biology 2e, OpenStax. · CC BY-NC-SA 4.0
· Original image ↗ · Access for free ↗
Figure 7.45 - Non-homologous end joining (left) versus homologous recombination (right) - Wikipedia
Wikipedia, as credited by Kevin Ahern, Indira Rajagopal, and Taralyn Tan, Biochemistry Free For All, Oregon State University, via Biology LibreTexts. · Source attribution
· Original image ↗ · Access for free ↗
The amount of a substance that can dissolve in a solvent under specified conditions. Soluble means able to dissolve; insoluble means only very slightly soluble in that solvent.
A condition in which an intermediate concentration remains approximately constant because formation and breakdown rates balance. Product can still accumulate; this is not equilibrium.
Figure 4.44 - Kinetic profile of an allosteric enzyme whose activity is controlled by a homotropic effector. Image by Aleia Kim
Kevin Ahern, Indira Rajagopal, and Taralyn Tan, Biochemistry Free For All, Oregon State University, via Biology LibreTexts. Image by Aleia Kim · CC BY-NC-SA 4.0
· Original image ↗ · Access for free ↗
Figure 14.5 The purines have a double ring structure with a six-membered ring fused to a five-membered ring. Pyrimidines are smaller in size; they have a single six-membered ring structure.
Figure 15.7 Messenger RNA is a copy of protein-coding information in the coding strand of DNA, with the substitution of U in the RNA for T in the coding sequence. However, new RNA nucleotides base pair with the nucleotides of the template strand. RNA is synthesized in its 5'-3' direction, using the enzyme RNA polymerase. As the template is read, the DNA unwinds ahead of the polymerase and then rewinds behind it.
Figure 15.14 This is a space-filling model of a tRNA molecule that adds the amino acid phenylalanine to a growing polypeptide chain. The anticodon AAG binds the Codon UUC on the mRNA. The amino acid phenylalanine is attached to the other end of the tRNA.
A fleeting, high-energy arrangement at a reaction barrier. It is an energy maximum along the reaction path, rather than a stable reaction intermediate.
Figure 12.19 Reaction diagrams for an endothermic process in the absence (red curve) and presence (blue curve) of a catalyst. The catalyzed pathway involves a two-step mechanism (note the presence of two transition states) and an intermediate species (represented by the valley between the two transitions states).
Figure 15.18 Translation begins when an initiator tRNA anticodon recognizes a start codon on mRNA bound to a small ribosomal subunit. The large ribosomal subunit joins the small subunit, and a second tRNA is recruited. As the mRNA moves relative to the ribosome, successive tRNAs move through the ribosome and the polypeptide chain is formed. Entry of a release factor into the A site terminates translation and the components dissociate.
Figure 15.17 Charging of tRNAs with correct amino acids. Aminoacyl-tRNA synthetases catalyze covalent bond formation between the tRNA and the correct amino acid in preparation for translation. Because there are multiple amino acids, there are multiple different tRNA synthetases. All of the synthetases require energy, in the form of ATP, to make sure the correct amino acid is attached to the tRNA with the correct anticodon sequence. Credit: Rao, A., Ryan, K. and Tag, A. Department of Biology, Texas A&M University.
Rao, A., Ryan, K. and Tag, A. Department of Biology, Texas A&M University.; Mary Ann Clark, Matthew Douglas, and Jung Choi, Biology 2e, OpenStax. · CC BY-NC-SA 4.0
· Original image ↗ · Access for free ↗
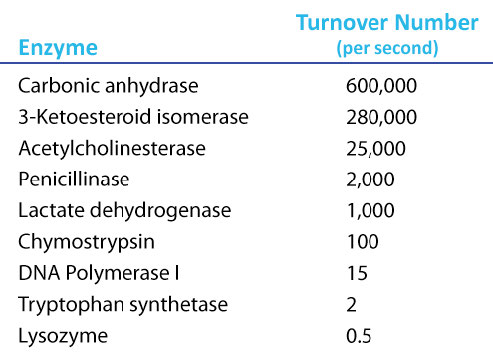
Figure 4.21 - Kcat (turnover number) values for several enzymes. Image by Aleia Kim
Kevin Ahern, Indira Rajagopal, and Taralyn Tan, Biochemistry Free For All, Oregon State University, via Biology LibreTexts. Image by Aleia Kim · CC BY-NC-SA 4.0
· Original image ↗ · Access for free ↗
Figure 14.5 The purines have a double ring structure with a six-membered ring fused to a five-membered ring. Pyrimidines are smaller in size; they have a single six-membered ring structure.
Figure 7.11 In the citric acid cycle, the acetyl group from acetyl CoA is attached to a four-carbon oxaloacetate molecule to form a six-carbon citrate molecule. Through a series of steps, citrate is oxidized, releasing two carbon dioxide molecules for each acetyl group fed into the cycle. In the process, three NAD + molecules are reduced to NADH, one FAD molecule is reduced to FADH 2 , and one ATP or GTP (depending on the cell type) is produced (by substrate-level phosphorylation). Because the final product of the citric acid cycle is also the first reactant, the cycle runs continuously in the presence of sufficient reactants. Credit: Rao, A., Ryan, K., Tag, A., and Fletcher, S. Department of Biology, Texas
A&M University.
No matching terms. Try a different name or abbreviation.
24.2 Carbohydrate Metabolism
OpenStax · 24.2 Carbohydrate Metabolism ↗ Instructional page including learning objectives, examples, figures, source tables and questions. Site navigation and embedded media players are omitted; source media links remain available.
Carbohydrates are organic molecules composed of carbon, hydrogen, and oxygen atoms. The family of carbohydrates includes both simple and complex sugars. Glucose and fructose are examples of simple sugars, and starch, glycogen, and cellulose are all examples of complex sugars. The complex sugars are also called polysaccharides and are made of multiple monosaccharidemolecules. Polysaccharides serve as energy storage (e.g., starch and glycogen) and as structural components (e.g., chitin in insects and cellulose in plants).
During digestion, carbohydrates are broken down into simple, soluble sugars that can be transported across the intestinal wall into the circulatory system to be transported throughout the body. Carbohydrate digestion begins in the mouth with the action of salivary amylase on starches and ends with monosaccharides being absorbed across the epithelium of the small intestine. Once the absorbed monosaccharides are transported to the tissues, the process of cellular respiration begins (Figure 24.4). This section will focus first on glycolysis, a process where the monosaccharide glucose is oxidized, releasing the energy stored in its bonds to produce ATP.
Figure 24.4 Cellular Respiration Cellular respiration oxidizes glucose molecules through glycolysis, the Krebs cycle, and oxidative phosphorylation to produce ATP.
Glucose is the body’s most readily available source of energy. After digestive processes break polysaccharides down into monosaccharides, including glucose, the monosaccharides are transported across the wall of the small intestine and into the circulatory system, which transports them to the liver. In the liver, hepatocytes either pass the glucose on through the circulatory system or store excess glucose as glycogen. Cells in the body take up the circulating glucose in response to insulin and, through a series of reactions called glycolysis, transfer some of the energy in glucose to ADP to form ATP (Figure 24.5). The last step in glycolysis produces the productpyruvate.
Figure 24.5 Glycolysis Overview During the energy-consuming phase of glycolysis, two ATPs are consumed, transferring two phosphates to the glucose molecule. The glucose molecule then splits into two three-carbon compounds, each containing a phosphate. During the second phase, an additional phosphate is added to each of the three-carbon compounds. The energy for this endergonic reaction is provided by the removal (oxidation) of two electrons from each three-carbon compound. During the energy-releasing phase, the phosphates are removed from both three-carbon compounds and used to produce four ATP molecules.
Glycolysis can be divided into two phases: energy consuming (also called chemical priming) and energy yielding. The first phase is the energy-consuming phase, so it requires two ATPmolecules to start the reaction for each molecule of glucose. However, the end of the reaction produces four ATPs, resulting in a net gain of two ATP energy molecules.
Glycolysis can be expressed as the following equation:
When oxygen is limited or absent, pyruvate enters an anaerobic pathway called fermentation. In these reactions, pyruvate can be converted into lactic acid. This pathway serves to keep the pyruvateconcentration low so glycolysis continues, and it oxidizes NADH into the NAD+ needed by glycolysis. In this reaction, lactic acid replaces oxygen as the final electron acceptor. Fermentation occurs in most cells of the body when oxygen is limited or mitochondria are absent or nonfunctional. For example, because erythrocytes (red blood cells) lack mitochondria, they must produce their ATP from fermentation. This is an effective pathway of ATP production for short periods of time, ranging from seconds to a few minutes. The lactic acid produced diffuses into the plasma and is carried to the liver, where it is converted back into pyruvate or glucose via the Cori cycle. Similarly, when a person exercises, muscles use ATP faster than oxygen can be delivered to them. They depend on glycolysis and lactic acid production for rapid ATP production.
Aerobic Respiration
In the presence of oxygen, pyruvate can enter the Krebs cycle where additional energy is extracted as electrons are transferred from the pyruvate to the receptors NAD+, GDP, and FAD, with carbon dioxide being a “waste product” (Figure 24.6). The NADH and FADH2 pass electrons on to the electron transport chain, which uses the transferred energy to produce ATP. As the terminal step in the electron transport chain, oxygen is the terminal electron acceptor and creates water inside the mitochondria.
Figure 24.6 Aerobic versus Fermentation The process of fermentation converts glucose into two lactate molecules in the absence of oxygen or within erythrocytes that lack mitochondria. During fermentation, glucose is oxidized into two pyruvate molecules.
Figure 24.7 Krebs Cycle During the Krebs cycle, each pyruvate that is generated by glycolysis is converted into a two-carbon acetyl CoA molecule. The acetyl CoA is systematically processed through the cycle and produces high-energy NADH, FADH 2 , and ATP molecules.
To start the Krebs cycle, citrate synthase combines acetyl CoA and oxaloacetate to form a six-carbon citratemolecule; CoA is subsequently released and can combine with another pyruvatemolecule to begin the cycle again. The aconitaseenzyme converts citrate into isocitrate. In two successive steps of oxidative decarboxylation, two molecules of CO2 and two NADHmolecules are produced when isocitrate dehydrogenase converts isocitrate into the five-carbon α-ketoglutarate, which is then catalyzed and converted into the four-carbon succinyl CoA by α-ketoglutarate dehydrogenase. The enzyme succinyl CoA dehydrogenase then converts succinyl CoA into succinate and forms the high-energy moleculeGTP, which transfers its energy to ADP to produce ATP. Succinate dehydrogenase then converts succinate into fumarate, forming a molecule of FADH2. Fumarase then converts fumarate into malate, which malate dehydrogenase then converts back into oxaloacetate while reducing NAD+ to NADH. Oxaloacetate is then ready to combine with the next acetyl CoA to start the Krebs cycle again (see Figure 24.7). For each turn of the cycle, three NADH, one ATP (through GTP), and one FADH2 are created. Each carbon of pyruvate is converted into CO2, which is released as a byproduct of oxidative (aerobic) respiration.
Figure 24.8 Electron Transport Chain The electron transport chain is a series of electron carriers and ion pumps that are used to pump H + ions out of the inner mitochondrial matrix.
Watch this video to learn about the electron transport chain.
The electrons released from NADH and FADH2 are passed along the chain by each of the carriers, which are reduced when they receive the electron and oxidized when passing it on to the next carrier. Each of these reactions releases a small amount of energy, which is used to pump H+ions across the inner membrane. The accumulation of these protons in the space between the membranes creates a protongradient with respect to the mitochondrialmatrix.
Also embedded in the inner mitochondrialmembrane is an amazing proteinpore complex called ATP synthase. Effectively, it is a turbine that is powered by the flow of H+ ions across the inner membrane down a gradient and into the mitochondrialmatrix. As the H+ ions traverse the complex, the shaft of the complex rotates. This rotation enables other portions of ATP synthase to encourage ADP and Pi to create ATP. In accounting for the total number of ATP produced per glucosemolecule through aerobic respiration, it is important to remember the following points:
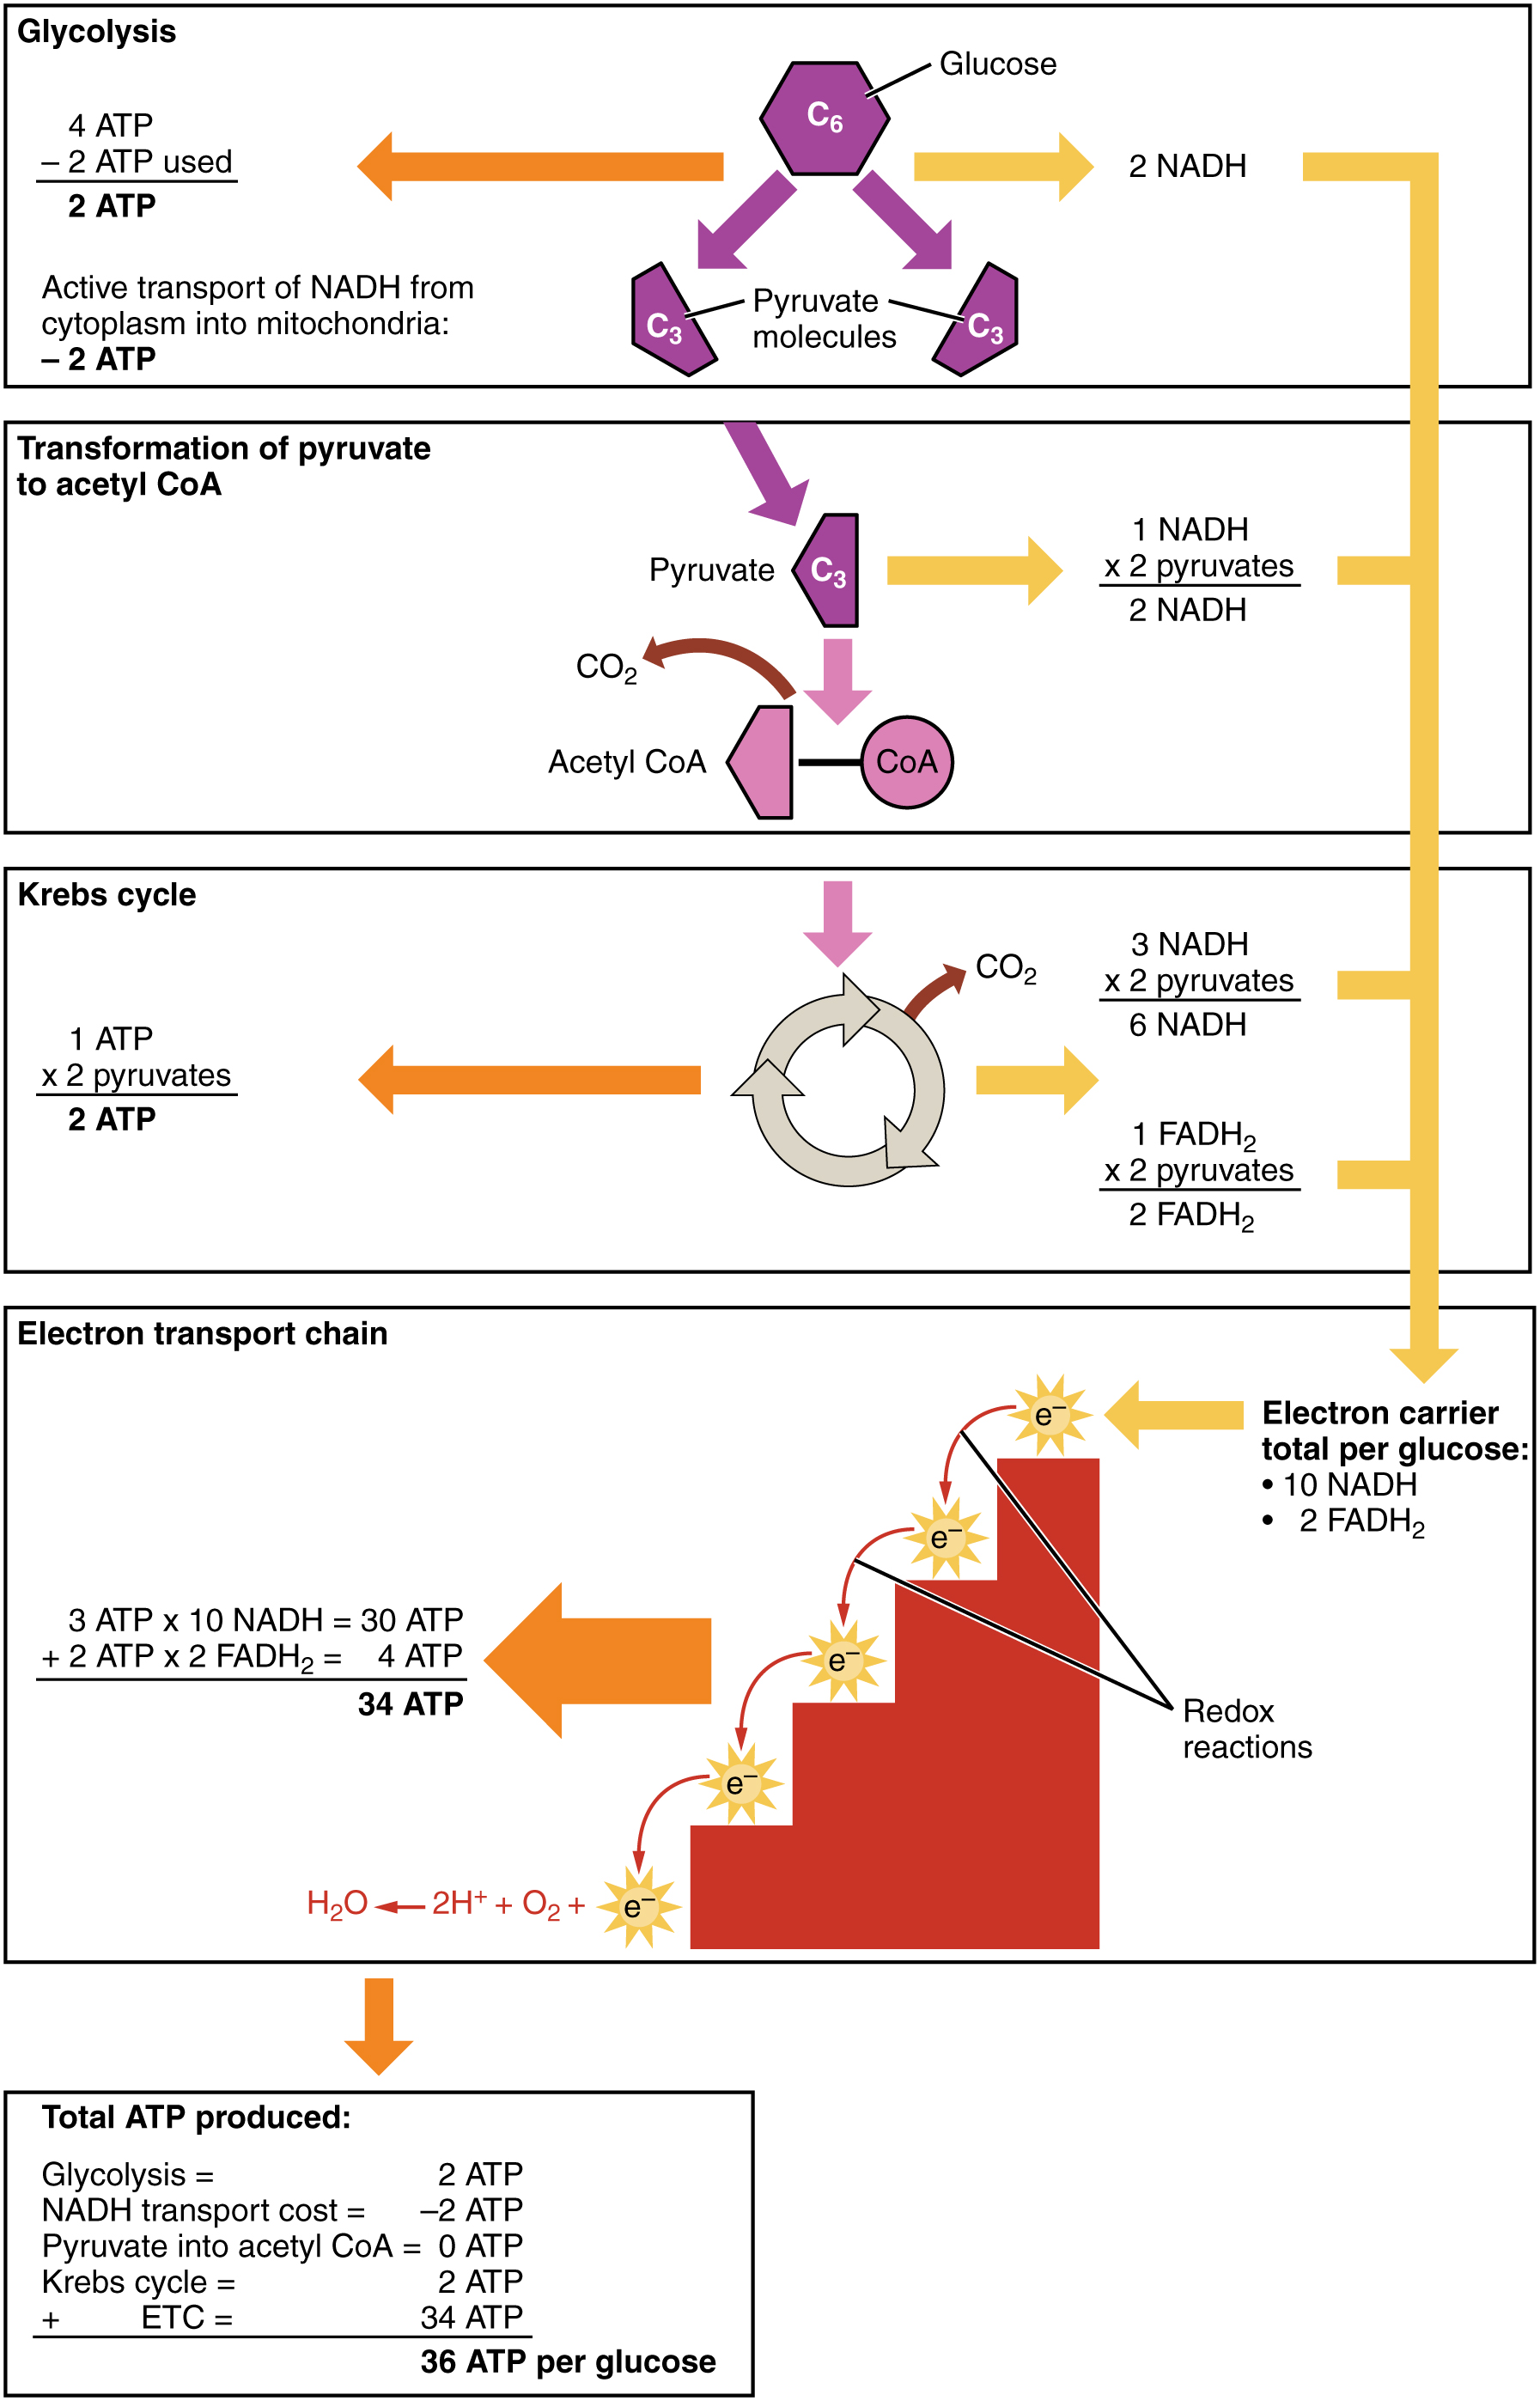
A net of two ATP are produced through glycolysis (four produced and two consumed during the energy-consuming stage). However, these two ATP are used for transporting the NADH produced during glycolysis from the cytoplasm into the mitochondria. Therefore, the net production of ATP during glycolysis is zero.
In the ETC, about three ATP are produced for every oxidizedNADH. However, only about two ATP are produced for every oxidized FADH2. The electrons from FADH2 produce less ATP, because they start at a lower point in the ETC (Complex II) compared to the electrons from NADH (Complex I) (see Figure 24.8).
Therefore, for every glucosemolecule that enters aerobic respiration, a net total of 36 ATPs are produced (Figure 24.9).
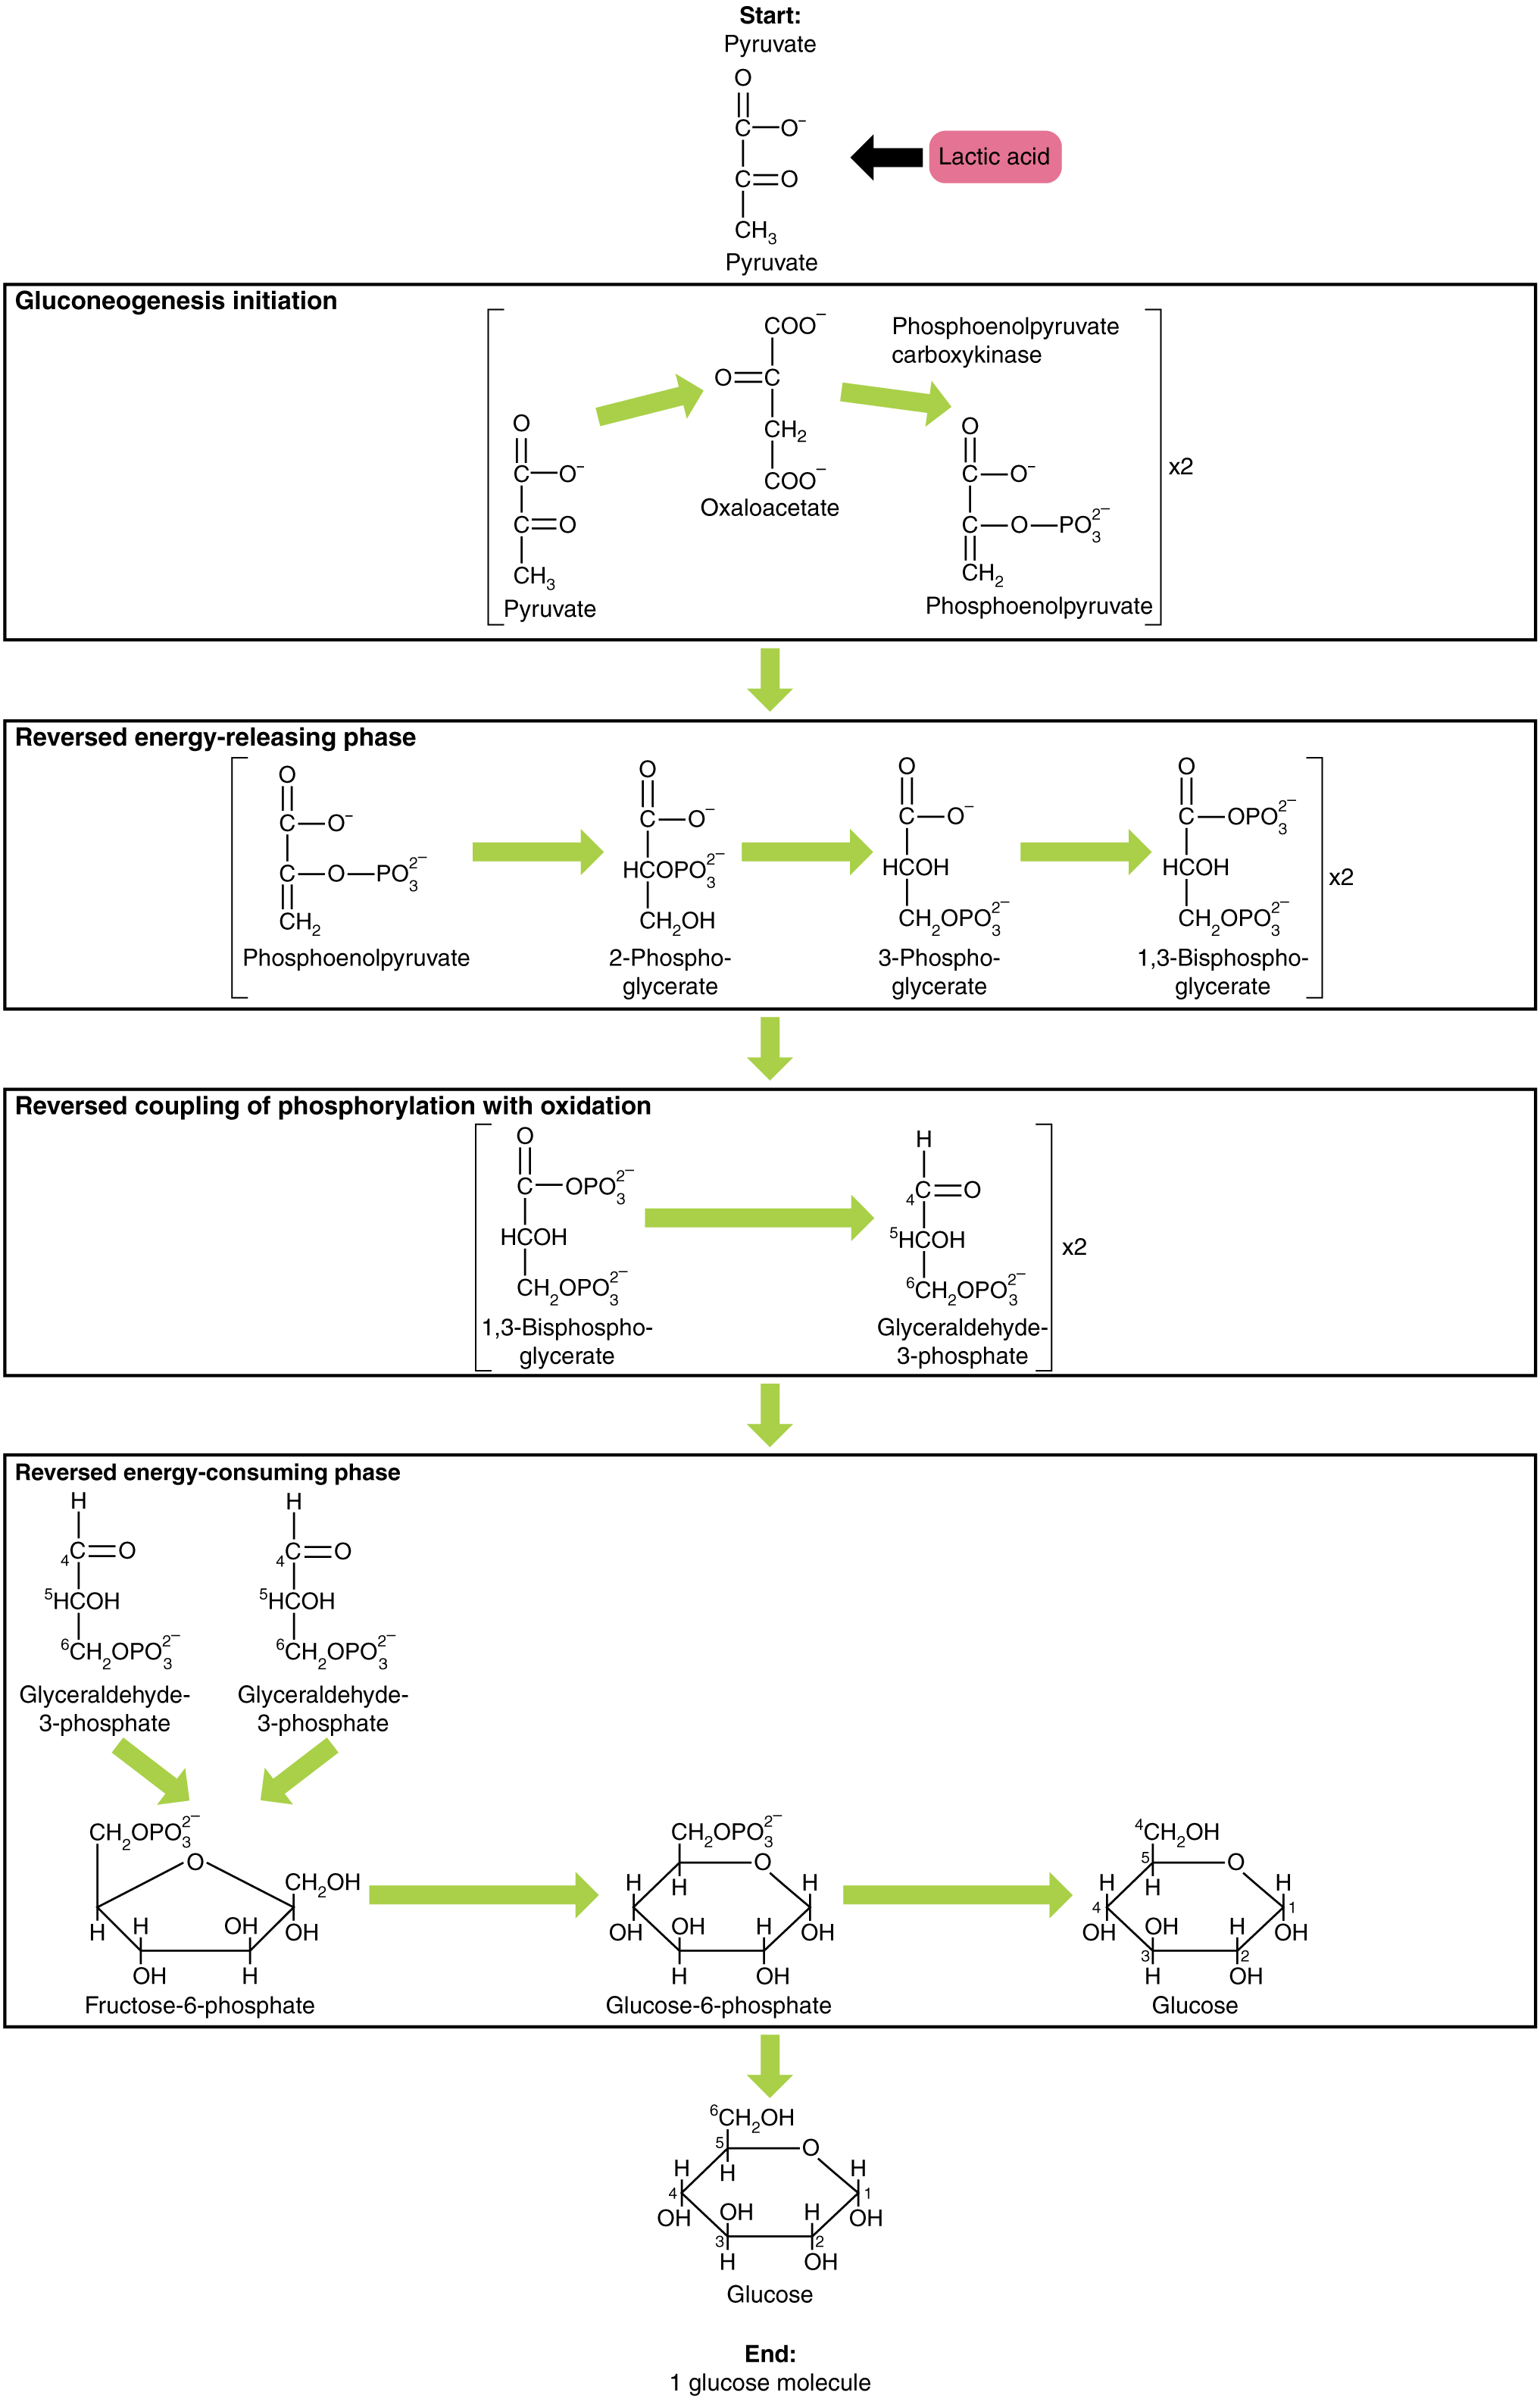
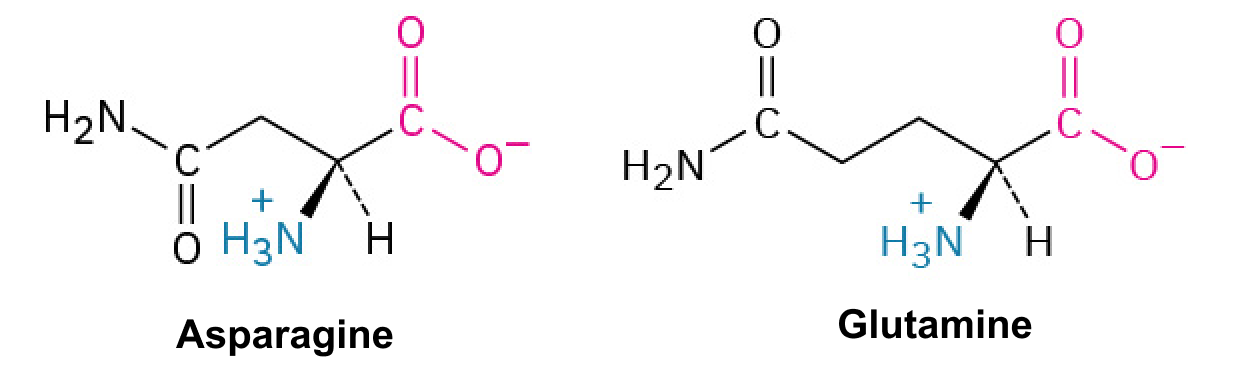
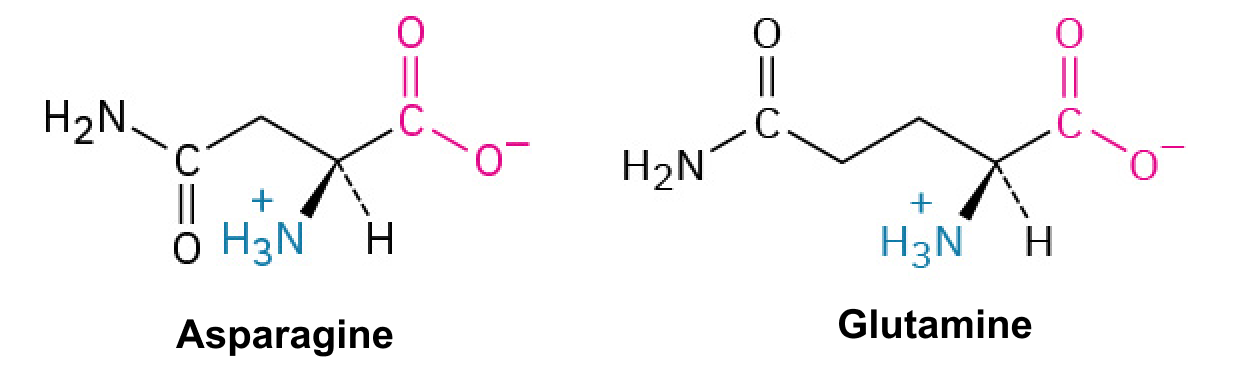
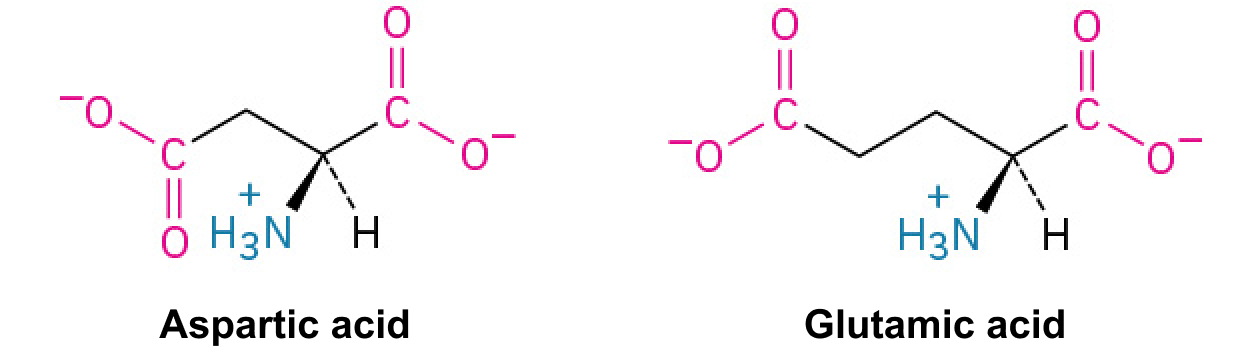
Gluconeogenesis is the synthesis of new glucosemolecules from pyruvate, lactate, glycerol, or the amino acidsalanine or glutamine. This process takes place primarily in the liver during periods of low glucose, that is, under conditions of fasting, starvation, and low carbohydrate diets. So, the question can be raised as to why the body would create something it has just spent a fair amount of effort to break down? Certain key organs, including the brain, can use only glucose as an energy source; therefore, it is essential that the body maintain a minimum blood glucoseconcentration. When the blood glucoseconcentration falls below that certain point, new glucose is synthesized by the liver to raise the blood concentration to normal.
As will be discussed as part of lipolysis, fats can be broken down into glycerol, which can be phosphorylated to form dihydroxyacetone phosphate or DHAP. DHAP can either enter the glycolytic pathway or be used by the liver as a substrate for gluconeogenesis.
The human body’s metabolic rate decreases nearly 2 percent per decade after age 30. Changes in body composition, including reduced lean muscle mass, are mostly responsible for this decrease. The most dramatic loss of muscle mass, and consequential decline in metabolic rate, occurs between 50 and 70 years of age. Loss of muscle mass is the equivalent of reduced strength, which tends to inhibit seniors from engaging in sufficient physical activity. This results in a positive-feedback system where the reduced physical activity leads to even more muscle loss, further reducing metabolism.
There are several things that can be done to help prevent general declines in metabolism and to fight back against the cyclic nature of these declines. These include eating breakfast, eating small meals frequently, consuming plenty of lean protein, drinking water to remain hydrated, exercising (including strength training), and getting enough sleep. These measures can help keep energy levels from dropping and curb the urge for increased calorie consumption from excessive snacking. While these strategies are not guaranteed to maintain metabolism, they do help prevent muscle loss and may increase energy levels. Some experts also suggest avoiding sugar, which can lead to excess fat storage. Spicy foods and green tea might also be beneficial. Because stress activates cortisol release, and cortisol slows metabolism, avoiding stress, or at least practicing relaxation techniques, can also help.
24.5 Metabolic States of the Body
OpenStax · 24.5 Metabolic States of the Body ↗ Instructional page including learning objectives, examples, figures, source tables and questions. Site navigation and embedded media players are omitted; source media links remain available.
Learning Objectives
By the end of this section, you will be able to:
Describe what defines each of the three metabolic states
Describe the processes that occur during the absorptive state of metabolism
Describe the processes that occur during the postabsorptive state of metabolism
Explain how the body processes glucose when the body is starved of fuel
You eat periodically throughout the day; however, your organs, especially the brain, need a continuous supply of glucose. How does the body meet this constant demand for energy? Your body processes the food you eat both to use immediately and, importantly, to store as energy for later demands. If there were no method in place to store excess energy, you would need to eat constantly in order to meet energy demands. Distinct mechanisms are in place to facilitate energy storage, and to make stored energy available during times of fasting and starvation.
The Absorptive State
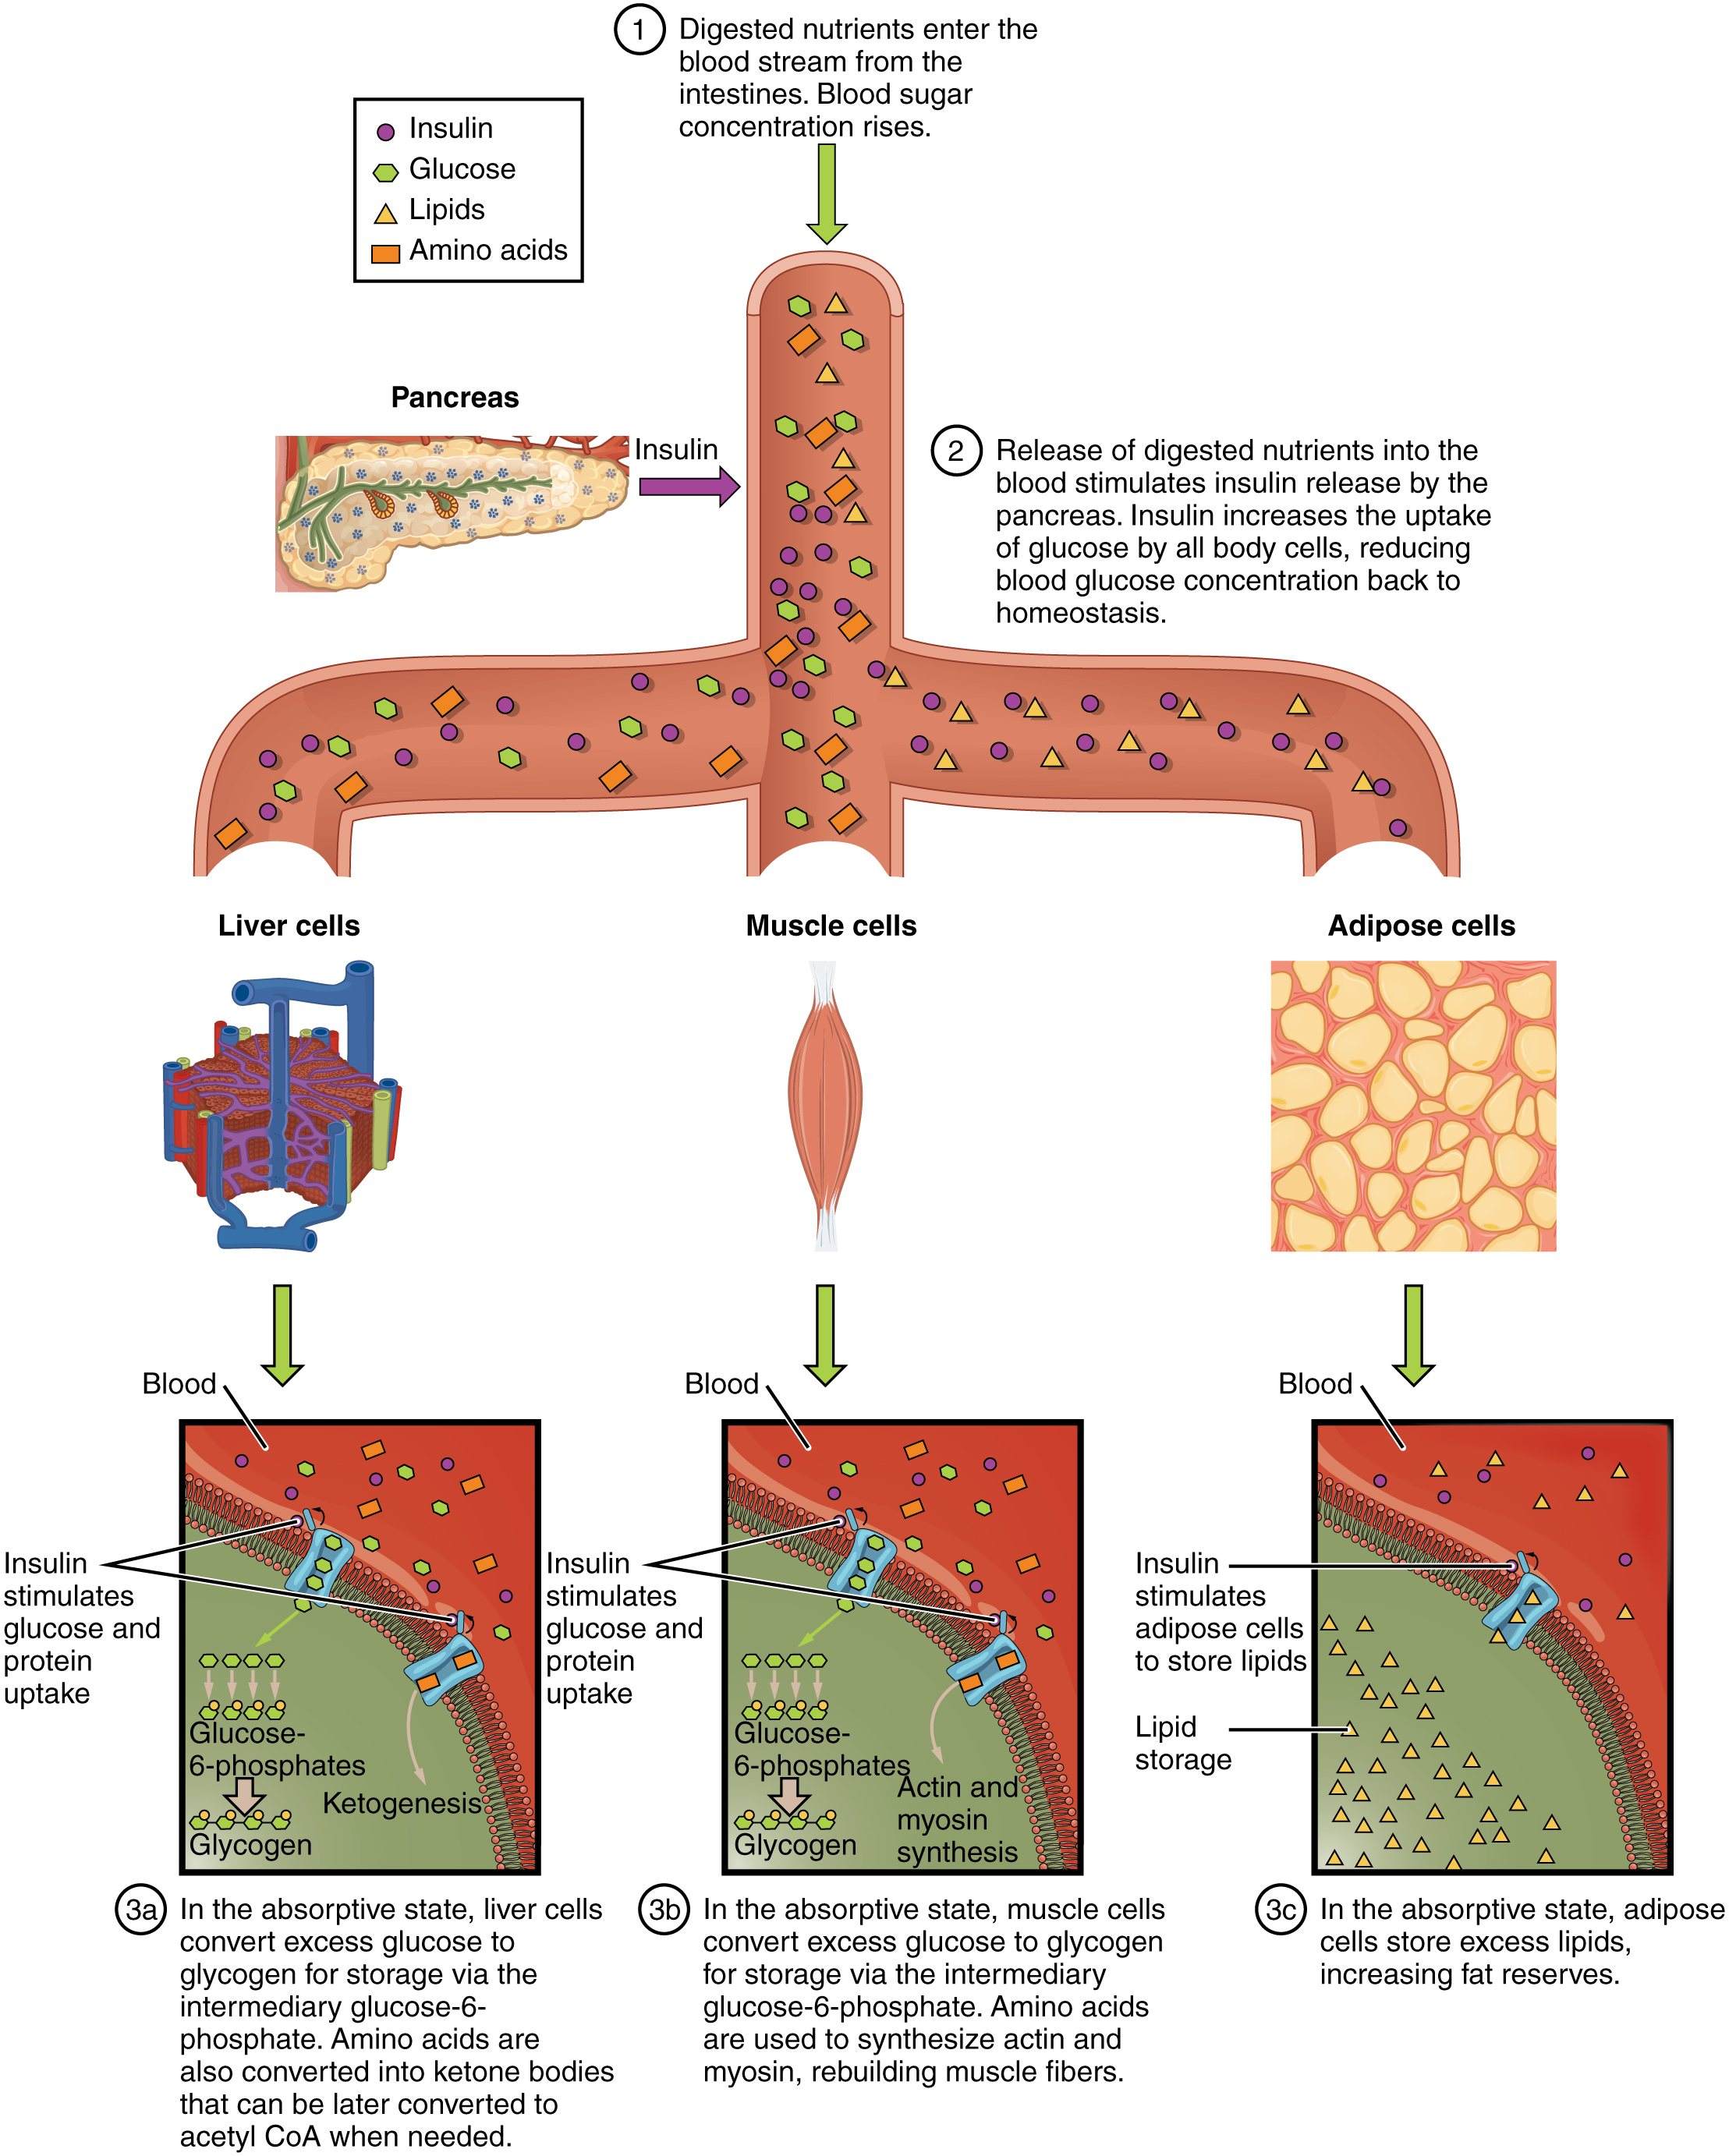
The absorptive state, or the fed state, occurs after a meal when your body is digesting the food and absorbing the nutrients (anabolism exceeds catabolism). Digestion begins the moment you put food into your mouth, as the food is broken down into its constituent parts to be absorbed through the intestine. The digestion of carbohydrates begins in the mouth, whereas the digestion of proteins and fats begins in the stomach and small intestine. The constituent parts of these carbohydrates, fats, and proteins are transported across the intestinal wall and enter the bloodstream (sugars and amino acids) or the lymphatic system (fats). From the intestines, these systems transport them to the liver, adipose tissue, or muscle cells that will process and use, or store, the energy.
Depending on the amounts and types of nutrients ingested, the absorptive state can linger for up to 4 hours. The ingestion of food and the rise of glucoseconcentrations in the bloodstream stimulate pancreatic beta cells to release insulin into the bloodstream, where it initiates the absorption of blood glucose by liver hepatocytes, and by adipose and muscle cells. Once inside these cells, glucose is immediately converted into glucose-6-phosphate. By doing this, a concentrationgradient is established where glucose levels are higher in the blood than in the cells. This allows for glucose to continue moving from the blood to the cells where it is needed. Insulin also stimulates the storage of glucose as glycogen in the liver and muscle cells where it can be used for later energy needs of the body. Insulin also promotes the synthesis of protein in muscle. As you will see, muscle protein can be catabolized and used as fuel in times of starvation.
If energy is exerted shortly after eating, the dietary fats and sugars that were just ingested will be processed and used immediately for energy. If not, the excess glucose is stored as glycogen in the liver and muscle cells, or as fat in adipose tissue; excess dietary fat is also stored as triglycerides in adipose tissues.
Figure 24.21 summarizes the metabolic processes occurring in the body during the absorptive state.
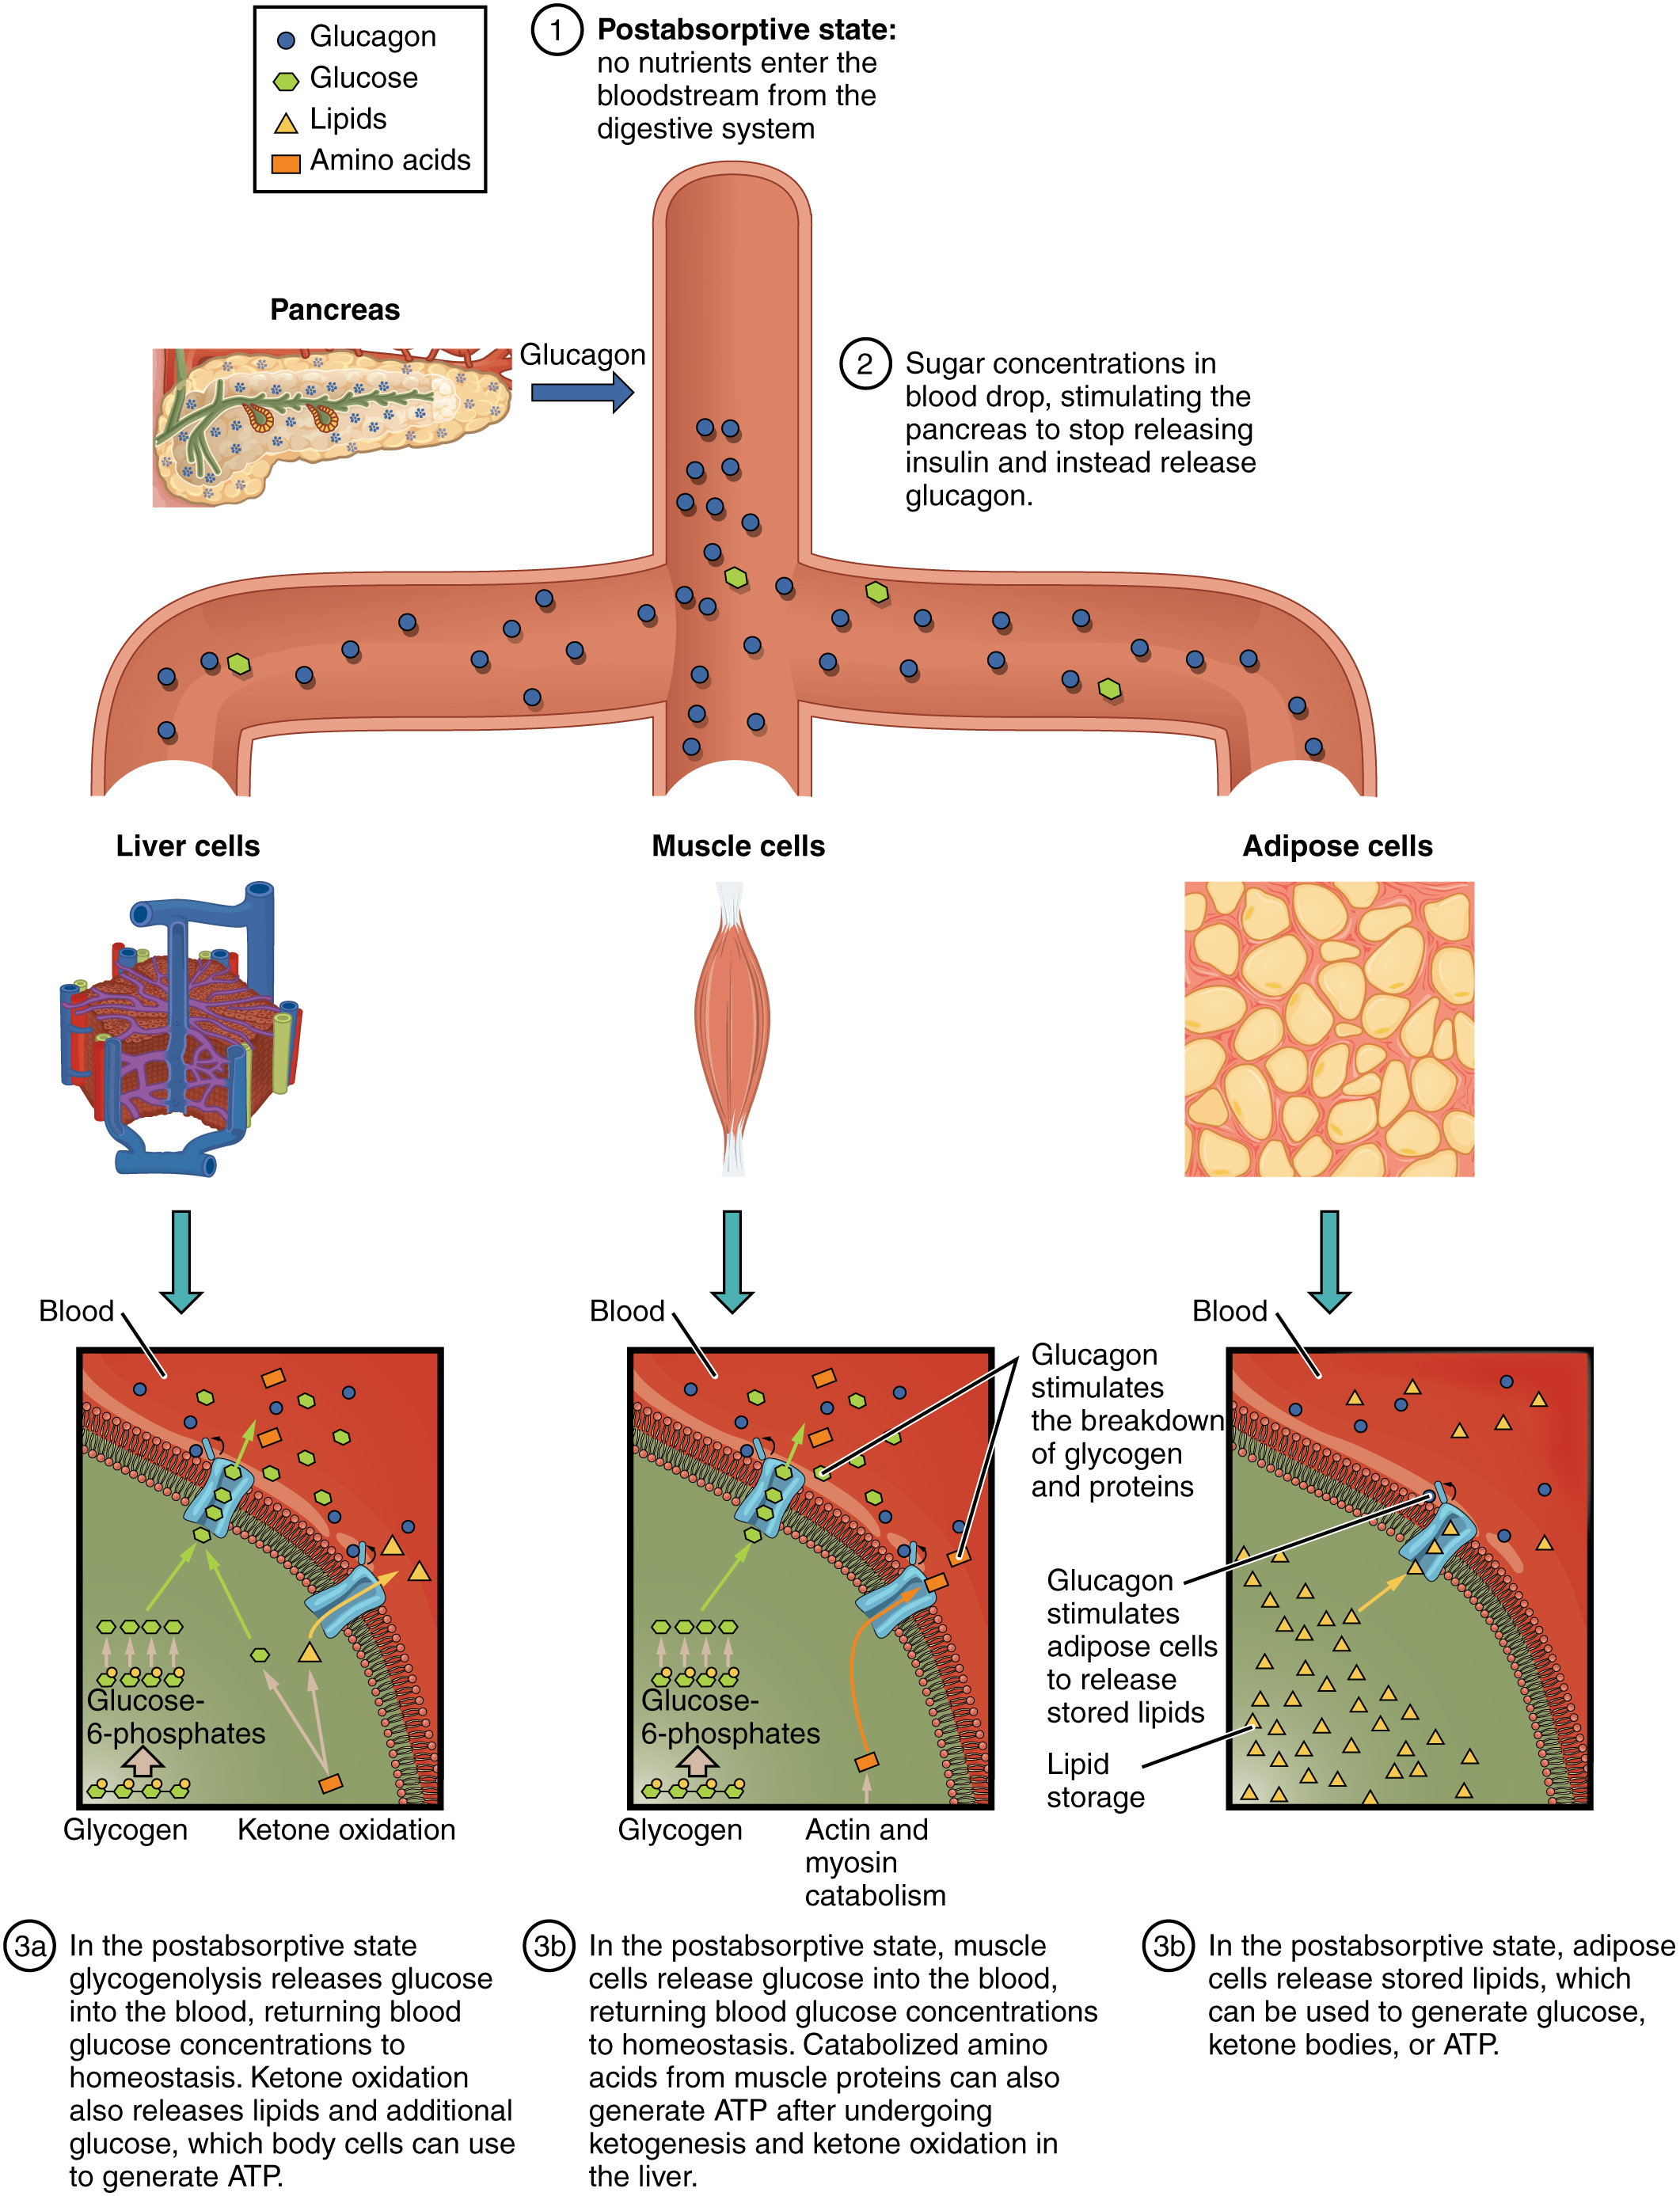
The postabsorptive state, or the fasting state, occurs when the food has been digested, absorbed, and stored. You commonly fast overnight, but skipping meals during the day puts your body in the postabsorptive state as well. During this state, the body must rely initially on stored glycogen. Glucose levels in the blood begin to drop as it is absorbed and used by the cells. In response to the decrease in glucose, insulin levels also drop. Glycogen and triglyceride storage slows. However, due to the demands of the tissues and organs, blood glucose levels must be maintained in the normal range of 80–120 mg/dL. In response to a drop in blood glucoseconcentration, the hormoneglucagon is released from the alpha cells of the pancreas. Glucagon acts upon the liver cells, where it inhibits the synthesis of glycogen and stimulates the breakdown of stored glycogen back into glucose. This glucose is released from the liver to be used by the peripheral tissues and the brain. As a result, blood glucose levels begin to rise. Gluconeogenesis will also begin in the liver to replace the glucose that has been used by the peripheral tissues.
After ingestion of food, fats and proteins are processed as described previously; however, the glucose processing changes a bit. The peripheral tissues preferentially absorb glucose. The liver, which normally absorbs and processes glucose, will not do so after a prolonged fast. The gluconeogenesis that has been ongoing in the liver will continue after fasting to replace the glycogen stores that were depleted in the liver. After these stores have been replenished, excess glucose that is absorbed by the liver will be converted into triglycerides and fatty acids for long-term storage. Figure 24.22 summarizes the metabolic processes occurring in the body during the postabsorptive state.
When the body is deprived of nourishment for an extended period of time, it goes into “survival mode.” The first priority for survival is to provide enough glucose or fuel for the brain. The second priority is the conservation of amino acids for proteins. Therefore, the body uses ketones to satisfy the energy needs of the brain and other glucose-dependent organs, and to maintain proteins in the cells (see Figure 24.2). Because glucose levels are very low during starvation, glycolysis will shut off in cells that can use alternative fuels. For example, muscles will switch from using glucose to fatty acids as fuel. As previously explained, fatty acids can be converted into acetyl CoA and processed through the Krebs cycle to make ATP. Pyruvate, lactate, and alanine from muscle cells are not converted into acetyl CoA and used in the Krebs cycle, but are exported to the liver to be used in the synthesis of glucose. As starvation continues, and more glucose is needed, glycerol from triglycerides can be liberated and used as a source for gluconeogenesis.
After several days of starvation, ketone bodies become the major source of fuel for the heart and other organs. As starvation continues, fatty acids and triglyceride stores are used to create ketones for the body. This prevents the continued breakdown of proteins that serve as carbon sources for gluconeogenesis. Once these stores are fully depleted, proteins from muscles are released and broken down for glucose synthesis. Overall survival is dependent on the amount of fat and protein stored in the body.
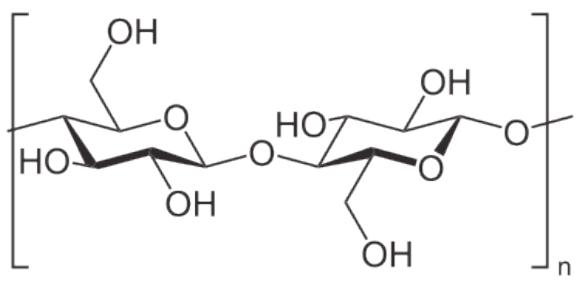
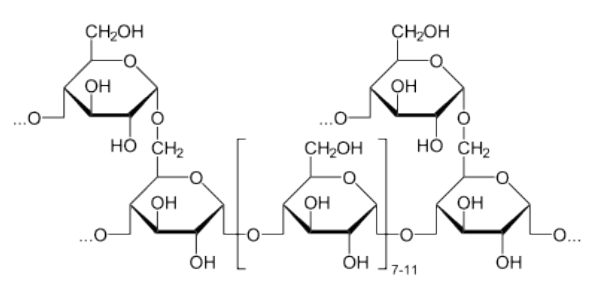
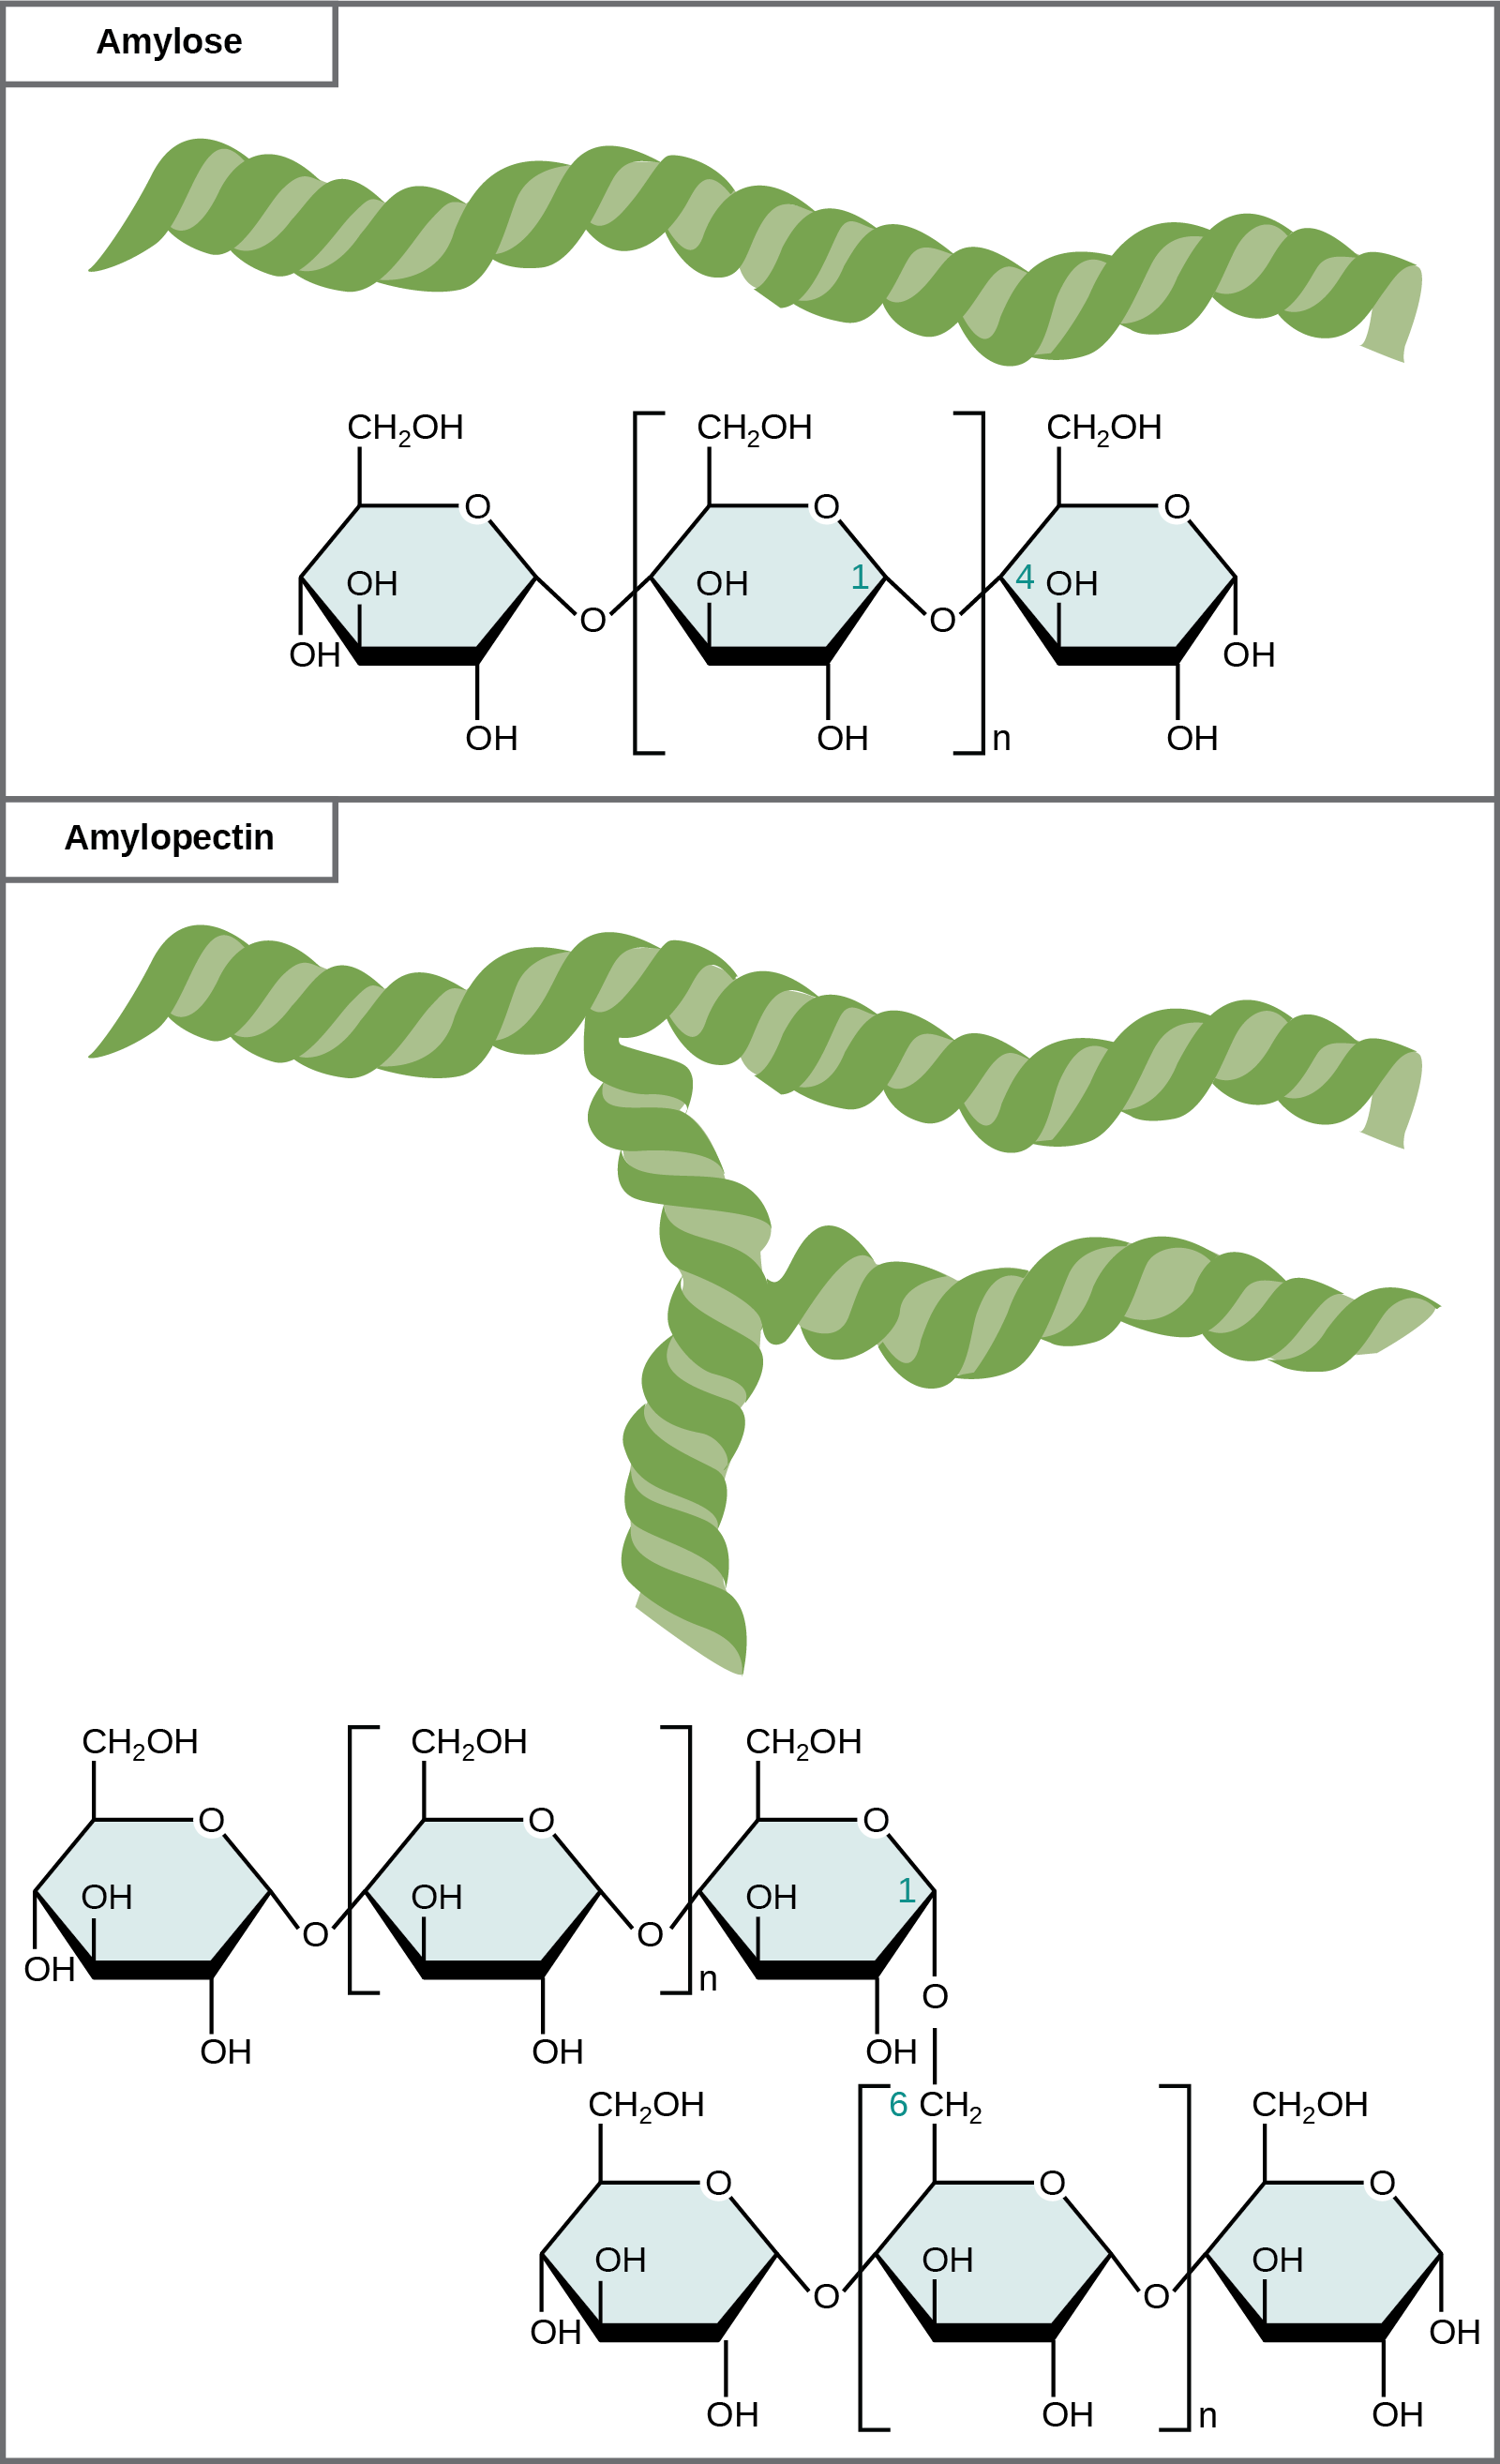
Plants are notable in storing glucose for energy in the form of amylose and amylopectin (see and for structural integrity in the form of cellulose. These structures differ in that cellulose contains glucoses solely joined by beta-1,4 bonds, whereas amylose has only alpha1,4 bonds and amylopectin has alpha 1,4 and alpha 1,6 bonds.Animals store glucose primary in liver and muscle in the form of a compound related to amylopectin known as glycogen. The structural differences between glycogen and amylopectin are solely due to the frequency of the alpha 1,6 branches of glucoses. In glycogen they occur about every 10 residues instead of every 30-50, as in amylopectin.
Figure 7.1.1: The Repeating Structure of Cellulose
Figure 7.1.1: The Repeating Structure of Cellulose
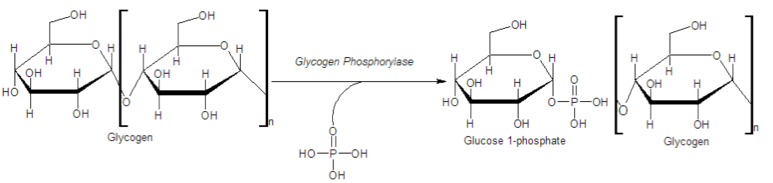
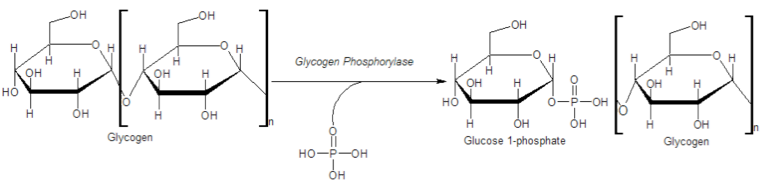
Glycogen provides an additional source of glucose besides that produced via gluconeogenesis. Because glycogen contains so many glucoses, it acts like a battery backup for the body, providing a quick source of glucose when needed and providing a place to store excess glucose when glucoseconcentrations in the blood rise. The branching of glycogen is an important feature of the molecule metabolically as well. Since glycogen is broken down from the "ends" of the molecule, more branches translate to more ends, and more glucose that can be released at once. Breakdown of glycogen involves
Just as in gluconeogenesis, the cell has a separate mechanism for glycogen synthesis that is distinct from glycogen breakdown. As noted previously, this allows the cell to separately control the reactions, avoiding futile cycles, and enabling a process to occur efficiently (synthesis of glycogen) that would not occur if it were simply the reversal of glycogen breakdown.
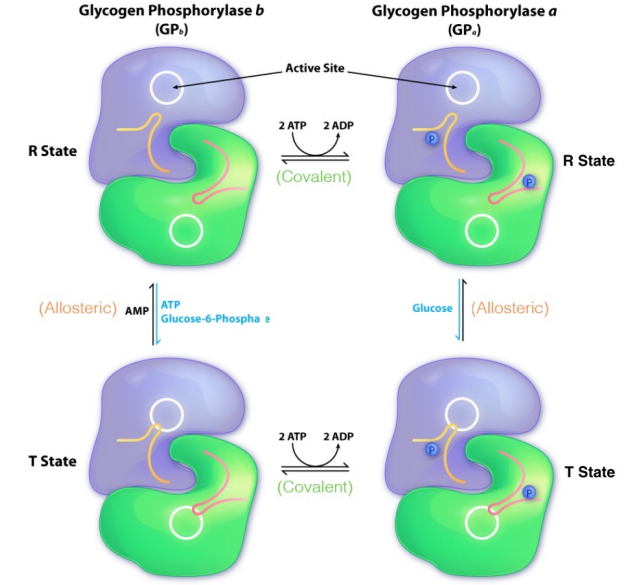
Glycogen phosphorylase exists in two different covalent forms – one form with phosphate (called GPa here) and one form lacking phosphate (GPb here). GPb is converted to GPa by phosphorylation by an enzyme known as phosphorylase kinase. GPa and GPb can each exist in an 'R' state and a 'T' state. For both GPa and GPb, the R state is the more active form of the enzyme. GPa's negative allostericeffector (glucose) is usually not abundant in cells, so GPa does not .ip into the T state often. There is no positive allostericeffector of GPa, so when glucose is absent, GPa automatically flips into the R (more active) state.
GPb can convert from the T state to the GPb R state by binding AMP. Unless a cell is low in energy, AMPconcentration is low. Thus GPb is not converted to the R state very often. On the other hand, ATP and/or G6P are usually present at high enough concentration in cells that GPb is readily flipped into the T state.
PKA is activated by cAMP, which is, in turn produced by adenylate cyclase after activation by a G-protein. G-proteins are activated ultimately by binding of ligands to specific 7-TMreceptors, also known as G-protein coupled receptors. These are discussed in greater detail in Chapter 8. Common ligands for these receptors include epinephrine (binds beta-adrenergic receptor) and glucagon (binds glucagonreceptor). Epinephrine exerts it greatest effects on muscle and glucagon works preferentially on the liver.
Turning OFF signals is as important, if not more so, than turning them ON. The steps in the glycogen breakdown regulatory pathway can be reversed at several levels. First, the ligand can leave the receptor. Second, the G-proteins have an inherent GTPase activity that serves to turn them off over time. Third, cells have phosphodiesterase (inhibited by caffeine) for breaking down cAMP. Fourth, an enzyme known as phosphoprotein phosphatase can remove phosphates from phosphorylase kinase (inactivating it) AND from GPa, converting it to the much less active GPb.
It is also worth noting in passing that glycogen synthase will only add glucose units from UDPG onto a preexisting glycogen chain that has at least four glucoseresidues. Linkage of the first few glucose units to form the minimal "primer" needed for glycogen synthase recognition is catalyzed by a protein called glycogenin, which attaches to the first glucose and catalyzes linkage of the first eight glucoses by alpha(1,4) bonds. 3) The characteristic alpha(1,6) branches of glycogen are the products of an enzyme known as Branching Enzyme. Branching Enzyme breaks alpha(1,4) chains and carries the broken chain to the carbon #6 and forms an alpha(1,6) linkage.
The regulation of glycogenbiosynthesis is reciprocal to that of glycogen breakdown. It also has a cascading covalent modification system similar to the glycogen breakdown system described above. In fact, part of the system is identical to glycogen breakdown. Epinephrine or glucagon signaling can stimulate adenylate cyclase to make cAMP, which activates PKA, which activates phosphorylase kinase.
In glycogen breakdown, phosphorylase kinase phosphorylates GPb to the more active form, GPa. In glycogen synthesis, proteinkinase A phosphorylates the active form of glycogen synthase (GSa), and converts it into the usually inactive b form (called GSb). Note the conventions for glycogen synthase and glycogen phosphorylase. For both enzymes, the more active forms are called the 'a' forms (GPa and GSa) and the less active forms are called the 'b' forms (GPb and GSb). The major difference, however, is that GPa has a phosphate, but GSa does not and GPb has no phosphate, but GSb does. Thus phosphorylation and dephosphorylation have opposite effects on the enzymes of glycogenmetabolism. This is the hallmark of reciprocal regulation. It is of note that the less active glycogen synthase form, GSb, can be activated by G6P. Recall that G6P had the exactly opposite effect on GPb.