Identify what the inhibitor binds, then track apparent Km and Vmax. Allosteric regulation describes a mechanism; noncompetitive inhibition describes a specific kinetic pattern.
Compare the four reversible patterns
Measure initial rates across [S], holding inhibitor concentration, enzyme concentration, pH, and temperature fixed. Apparent Km and apparent Vmax are the fitted values in the presence of inhibitor. Compare them with an uninhibited control.
| Type | Inhibitor binds | Apparent Km | Apparent Vmax | Lineweaver–Burk pattern |
|---|---|---|---|---|
| Competitive inhibition | Free enzyme; excludes substrate binding | Increases | Unchanged | Same y-intercept |
| Uncompetitive inhibition | ES only | Decreases | Decreases by the same factor | Parallel lines |
| Pure noncompetitive inhibition | E and ES equally strongly | Unchanged | Decreases | Same x-intercept |
| Mixed inhibition | E and ES with different affinities | Increases if E is favored; decreases if ES is favored | Decreases | Lines intersect off both axes |
Study comparison synthesized from the cited source selections. Parameters refer to the simple reversible-inhibition model.
Check the binding mechanism. In the simple model, competitive inhibition can be overcome by sufficiently high [S]. Uncompetitive, mixed, and pure noncompetitive inhibition lower the limiting rate. Irreversible inhibition removes active enzyme; it is a separate mechanism, so a lower Vmax alone does not identify an inhibitor type.
Source: Biochemistry Free For All §4.2 — Inhibition and allosteric control · Fundamentals of Biochemistry §6.4 — Noncompetitive and mixed inhibition
Competitive: compete for free enzyme
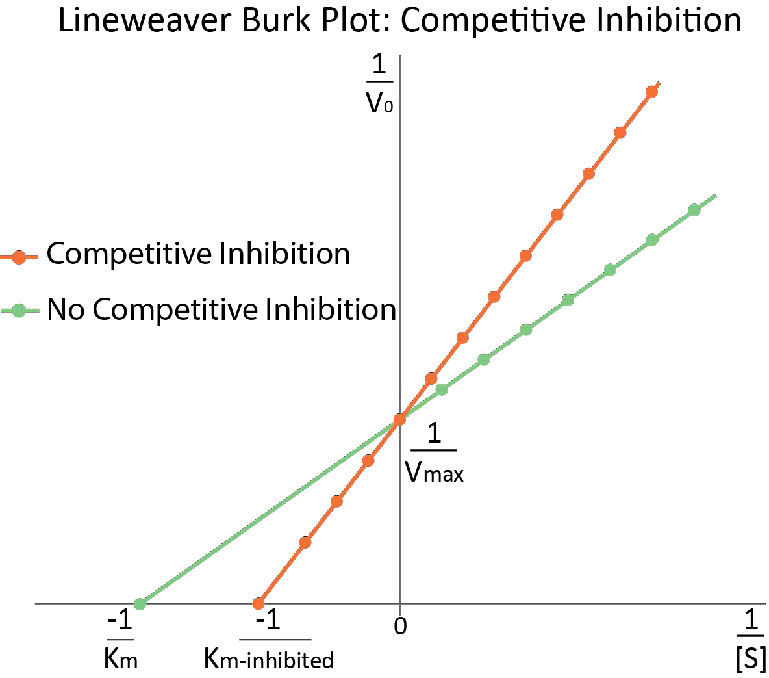
A competitive inhibitor binds free enzyme and prevents substrate binding. In the common active-site example, inhibitor and substrate resemble one another. More substrate can outcompete the inhibitor: apparent Km increases while Vmax stays unchanged.
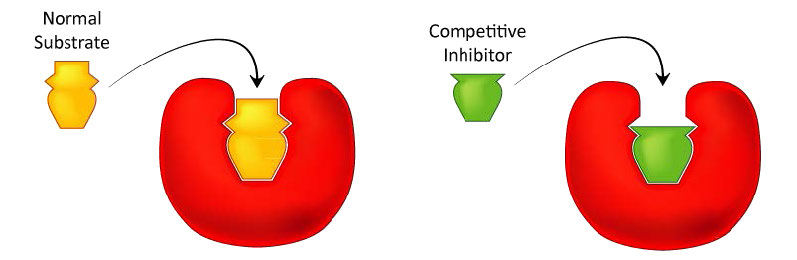
Figure 4.33 - Competitive inhibitors resemble the normal substrate and compete for binding at the active site. Image by Aleia Kim
Kevin Ahern, Indira Rajagopal, and Taralyn Tan, Biochemistry Free For All, Oregon State University, via Biology LibreTexts. Image by Aleia Kim · CC BY-NC-SA 4.0 · Original image ↗ · Access for free ↗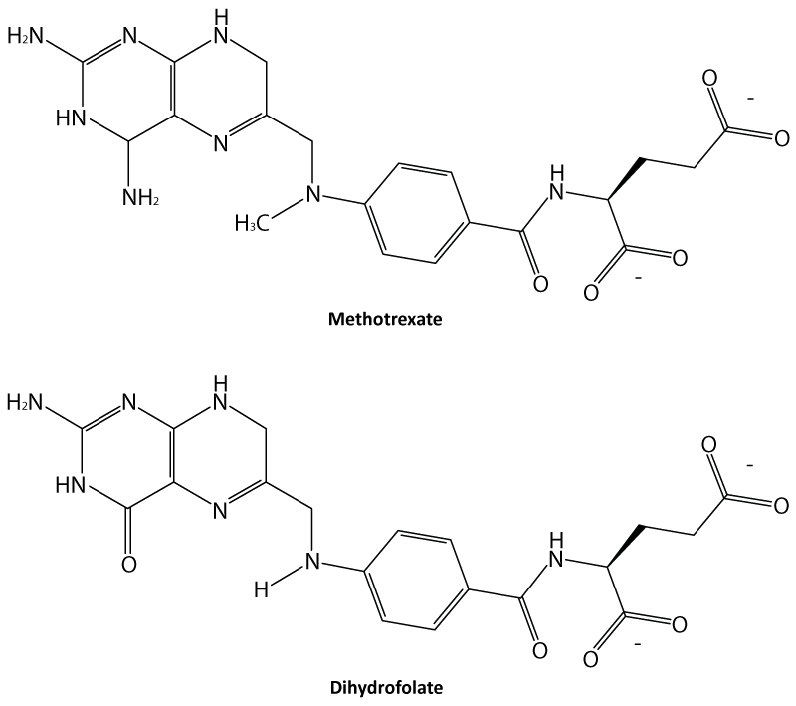
Figure 4.34 - Methotrexate and dihydrofolate. Image by Ben Carson
Kevin Ahern, Indira Rajagopal, and Taralyn Tan, Biochemistry Free For All, Oregon State University, via Biology LibreTexts. Image by Ben Carson · CC BY-NC-SA 4.0 · Original image ↗ · Access for free ↗Methotrexate inhibits dihydrofolate reductase (DHFR), which normally reduces dihydrofolate to tetrahydrofolate. The source figures illustrate substrate–inhibitor similarity and the unchanged plateau.
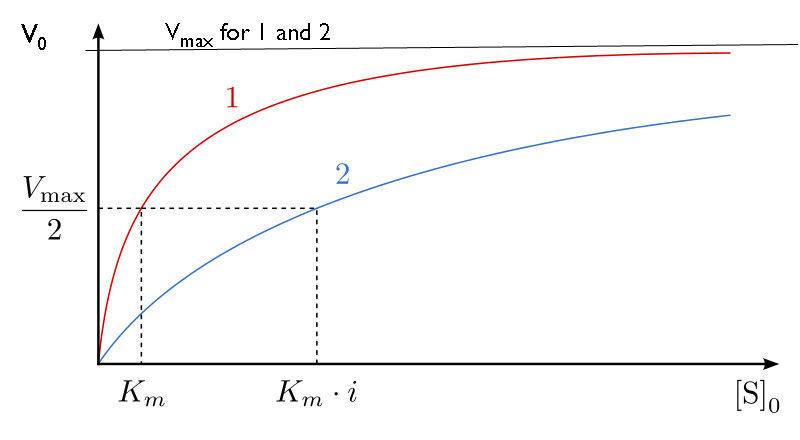
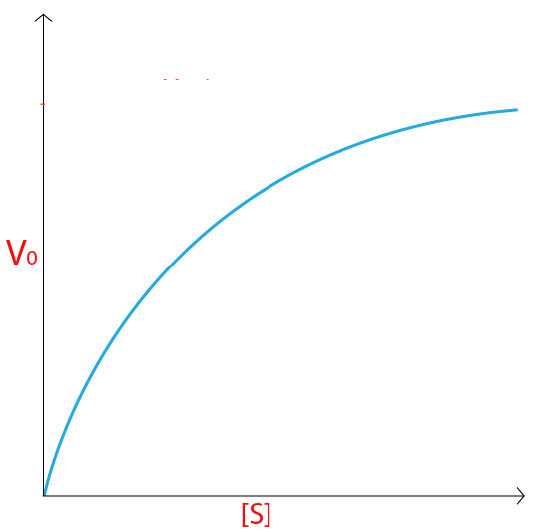
Figure 4.35 V0 vs [S] Plots for uninhibited reactions (red) and competitively inhibited reactions (blue). Both ultimately have same Vmax
Kevin Ahern, Indira Rajagopal, and Taralyn Tan, Biochemistry Free For All, Oregon State University, via Biology LibreTexts. · CC BY-NC-SA 4.0 · Original image ↗ · Access for free ↗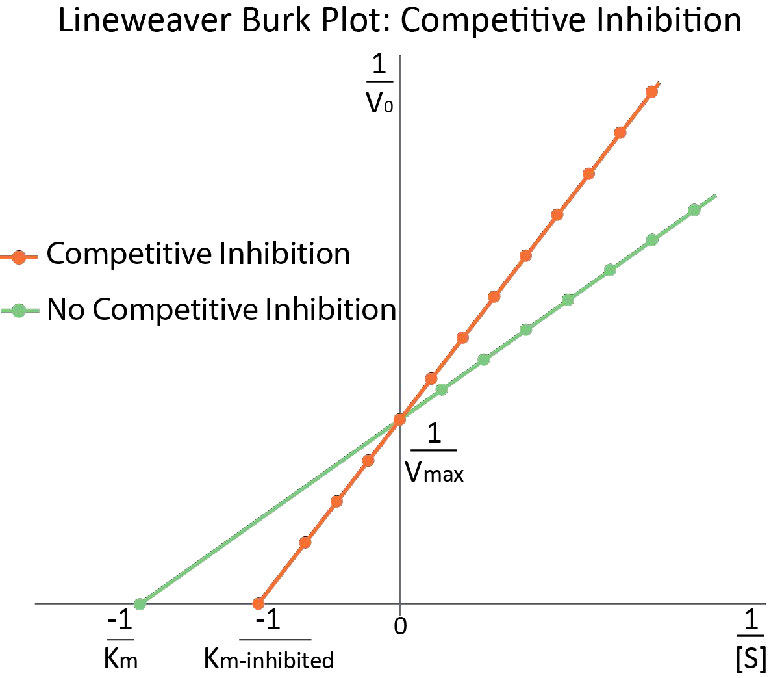
Figure 4.36 - Lineweaver-Burk plots - uninhibited reactions (green). Competitively inhibited reactions (orange). Lines cross on Y-axis at 1/Vmax Since Vmax is the same for both reactions. Image by Aleia Kim
Kevin Ahern, Indira Rajagopal, and Taralyn Tan, Biochemistry Free For All, Oregon State University, via Biology LibreTexts. Image by Aleia Kim · CC BY-NC-SA 4.0 · Original image ↗ · Access for free ↗Source: Biochemistry Free For All §4.2 — Inhibition and allosteric control
Uncompetitive: bind the ES complex
An uncompetitive inhibitor binds only after substrate has bound, forming an inactive ESI complex. Apparent Vmax and apparent Km fall by the same factor. Their ratio stays constant, so Lineweaver–Burk lines are parallel.
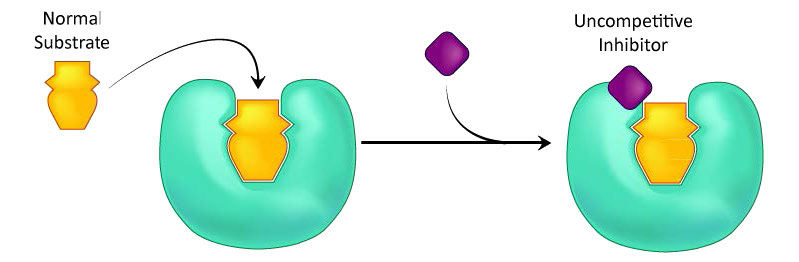
Figure 4.40 - Uncompetitive inhibition. Image by Aleia Kim
Kevin Ahern, Indira Rajagopal, and Taralyn Tan, Biochemistry Free For All, Oregon State University, via Biology LibreTexts. Image by Aleia Kim · CC BY-NC-SA 4.0 · Original image ↗ · Access for free ↗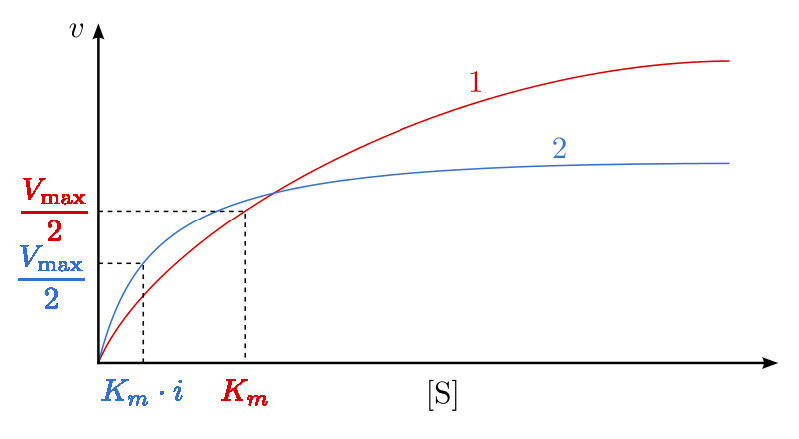
Figure 4.41 - V0 vs [S] plot for uncompetitive inhibition (blue) and uninhibited reactions (red)
Kevin Ahern, Indira Rajagopal, and Taralyn Tan, Biochemistry Free For All, Oregon State University, via Biology LibreTexts. · CC BY-NC-SA 4.0 · Original image ↗ · Access for free ↗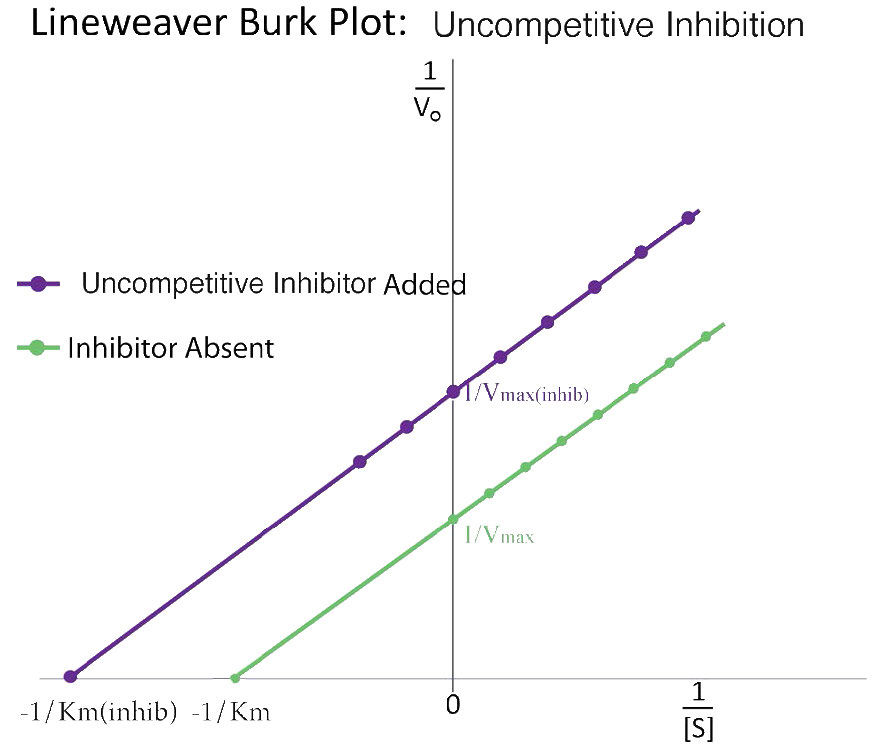
Figure 4.42 - Uncompetitive inhibition (purple) and uninhibited reactions (green). Image by Aleia Kim
Kevin Ahern, Indira Rajagopal, and Taralyn Tan, Biochemistry Free For All, Oregon State University, via Biology LibreTexts. Image by Aleia Kim · CC BY-NC-SA 4.0 · Original image ↗ · Access for free ↗Apparent affinity. The lower fitted Km does not show that the unbound enzyme has acquired stronger intrinsic substrate binding. It reflects the coupled binding and catalytic scheme in the presence of inhibitor.
Source: Biochemistry Free For All §4.2 — Inhibition and allosteric control
Mixed and pure noncompetitive inhibition
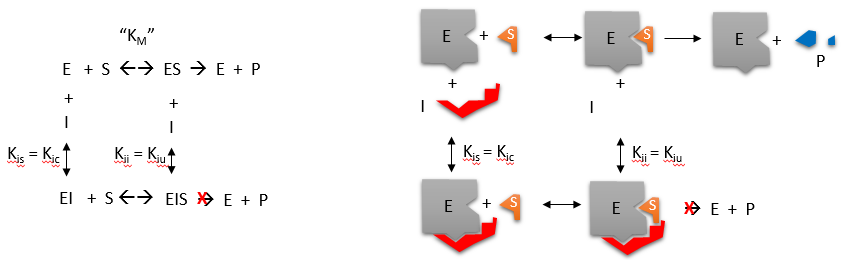
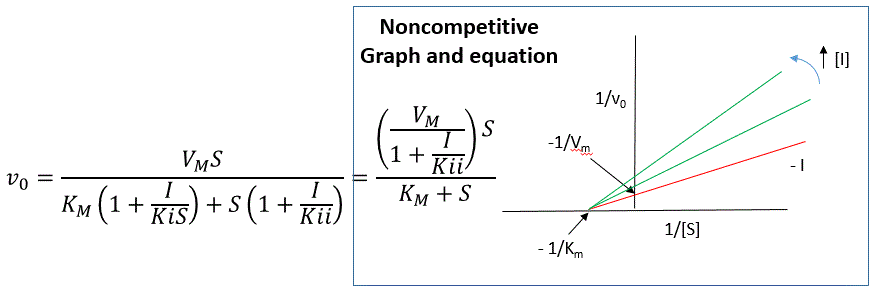
A mixed inhibitor binds both free enzyme and ES. In the simple model, ESI cannot form product. Binding more strongly to free enzyme raises apparent Km; favoring ES lowers it. Vmax decreases in both cases. Pure noncompetitive inhibition is the equal-affinity special case: Km is unchanged.
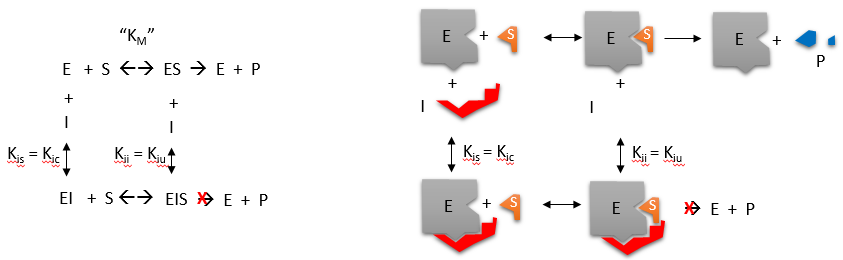
Figure 11: Noncompetitive and Mixed Inhibition
Henry Jakubowski and Patricia Flatt, Fundamentals of Biochemistry, Biology LibreTexts. · CC BY-NC-SA 4.0 · Original image ↗ · Access for free ↗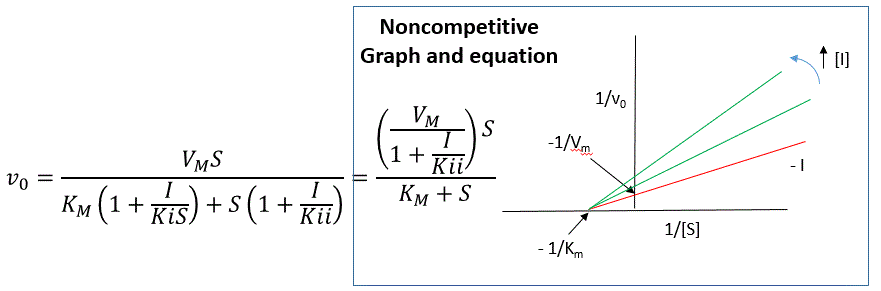
Figure 12: Noncompetitive Inhibition: Lineweaver-Burk plots
Henry Jakubowski and Patricia Flatt, Fundamentals of Biochemistry, Biology LibreTexts. · CC BY-NC-SA 4.0 · Original image ↗ · Access for free ↗Connect the equations. Let α = 1 + [I]/Ki for inhibitor binding to free enzyme and α′ = 1 + [I]/Ki′ for binding to ES. Then v₀ = Vmax × [S] / (α × Km + α′ × [S]), apparent Vmax = Vmax/α′, and apparent Km = (α/α′)Km. The source writes these binding constants as Kis and Kii.
Worked example. Without inhibitor, Vmax = 100 µM/min and Km = 20 µM. If α = 3 and α′ = 2, apparent Vmax = 50 µM/min and apparent Km = 30 µM. This is mixed inhibition favoring free enzyme. If α = α′ = 2 instead, apparent Vmax is still 50 µM/min but Km stays 20 µM: pure noncompetitive inhibition.
Check: parallel reciprocal lines
If Vmax falls from 100 to 50 µM/min and Km falls from 20 to 10 µM, both decrease twofold and Km/Vmax remains 0.20 min. That matches uncompetitive inhibition in the simple model.
Source: Fundamentals of Biochemistry §6.4 — Noncompetitive and mixed inhibition
Regulate activity through conformation
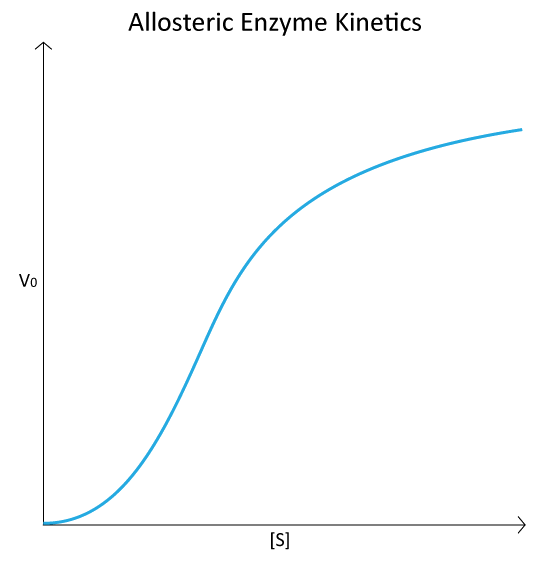
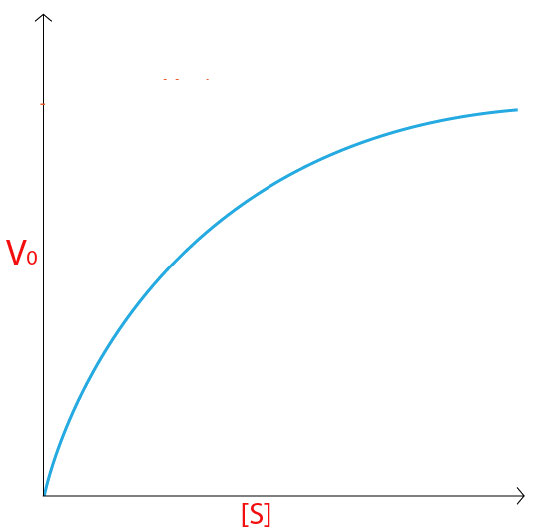
Allosteric regulation changes activity when an effector binds at a regulatory site. An effector may activate or inhibit. Cooperativity means that binding at one site affects other sites; positive substrate cooperativity often produces a sigmoidal rate curve.
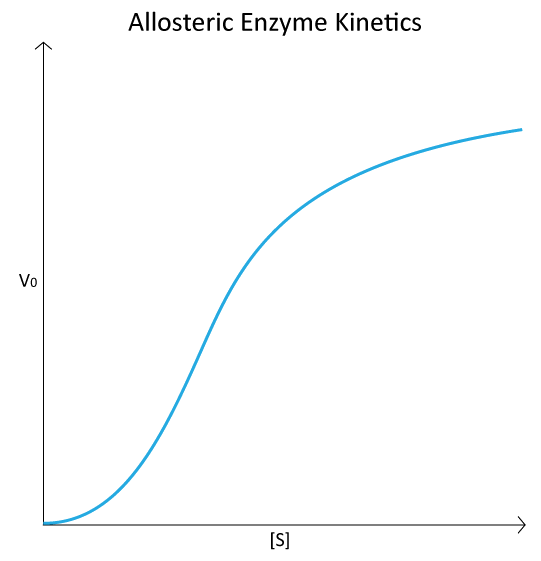
Figure 4.44 - Kinetic profile of an allosteric enzyme whose activity is controlled by a homotropic effector. Image by Aleia Kim
Kevin Ahern, Indira Rajagopal, and Taralyn Tan, Biochemistry Free For All, Oregon State University, via Biology LibreTexts. Image by Aleia Kim · CC BY-NC-SA 4.0 · Original image ↗ · Access for free ↗Allosteric does not mean noncompetitive. Allosteric describes communication between sites. Pure noncompetitive describes unchanged Km with reduced Vmax in a particular kinetic model. An allosteric inhibitor can produce other patterns; the binding location alone does not establish the kinetic classification.
A substrate acting as its own regulator is a homotropic effector; a different regulatory molecule is a heterotropic effector. Cells also control enzyme activity through covalent modification, substrate access, and enzyme synthesis or breakdown.
Source: Biochemistry Free For All §4.2 — Inhibition and allosteric control
Let the end product limit the pathway
In feedback inhibition, a pathway’s end product inhibits an earlier enzyme, limiting further production. This often acts at an early committed step and frequently uses allosteric regulation. When product levels fall, inhibition is relieved.
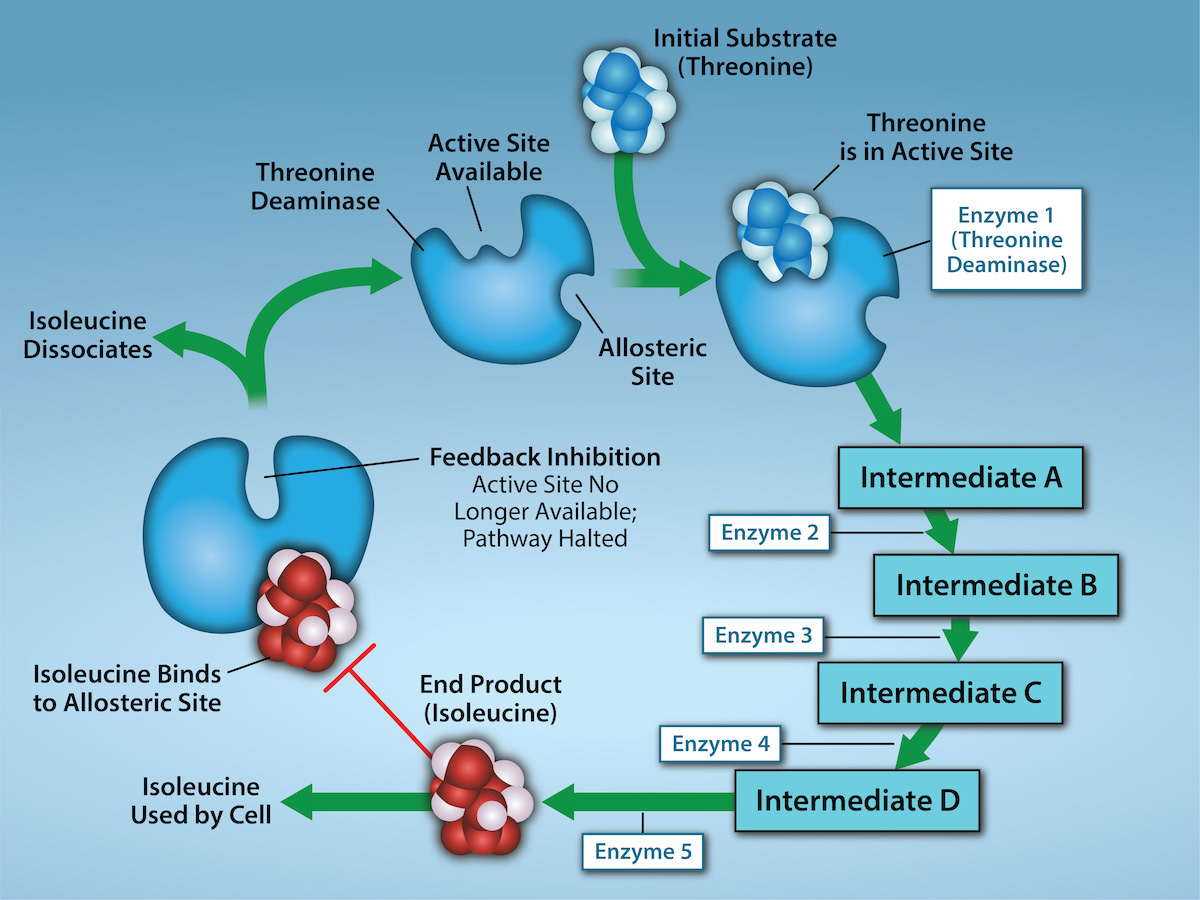
Figure 6.21 Metabolic pathways are a series of reactions that multiple enzymes catalyze. Feedback inhibition, where the pathway's end product inhibits an upstream step, is an important regulatory mechanism in cells. Metabolic pathways are a series of reactions catalyzed by multiple enzymes (Intermediates A – D, Enzymes 1 – 5). Feedback inhibition occurs when the pathway's end product (here isoleucine) inhibits an upstream enzyme (indicated by red bar). In this example, isoleucine will bind to Threonine Deaminase (at the allosteric site) and prevent threonine from binding to this enzyme’s active site, effectively blocking this metabolic pathway. When isoleucine levels decrease, Threonine will then bind to Threonine Deaminase’s active site and the metabolic pathway will resume. This is an important regulatory mechanism in cells to inhibit the overproduction of a product. Credit: Rao, A., Ryan, K., Tag, A., Hawkins, A. and Fletcher S. Department of Biology, Texas A&M University.
Mary Ann Clark, Matthew Douglas, and Jung Choi, Biology 2e, OpenStax. · CC BY-NC-SA 4.0 · Original image ↗ · Access for free ↗ATP and ADP can report cellular energy availability. High ATP can inhibit selected ATP-producing pathways, while ADP can promote activity. The response depends on the enzyme; ATP is not a universal inhibitor.
Check: pathway logic
For A → B → C → D, suppose D inhibits the enzyme converting A to B. Rising D slows entry into the pathway and reduces further D production. This is feedback inhibition even though D is not the substrate of the inhibited step.