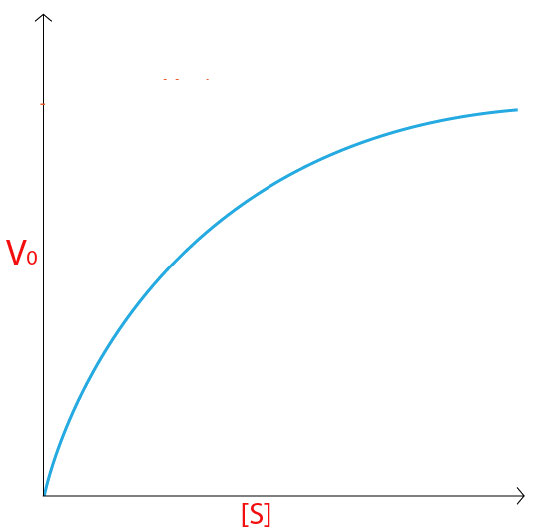
Vmax measures the capacity of the enzyme sample; Km locates half-maximal rate; kcat measures turnover per catalytic site.
Measure the initial rate
Measure v₀ from the early, approximately linear increase in product concentration with time. Hold enzyme concentration, temperature, and pH constant while varying [S]. Use substrate in excess of enzyme; measure after the initial binding transient but before appreciable substrate depletion or product accumulation.
Steady state is not equilibrium. During the measurement, ES forms and breaks down at approximately equal rates, so its concentration is nearly constant. Product still accumulates. At equilibrium, the net reaction rate is zero.
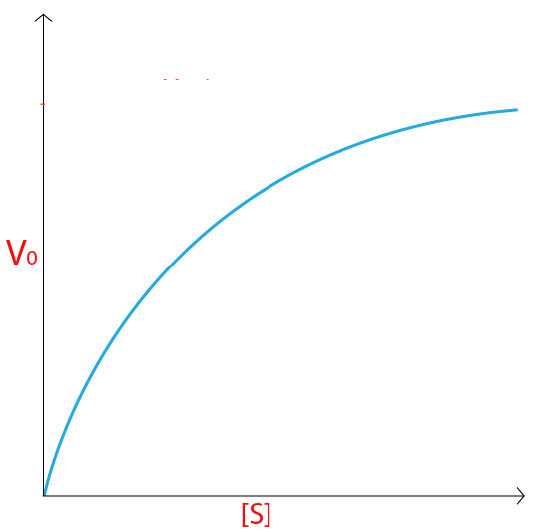
Figure 4.18 - Kinetics of an enzyme obeying Michaelis-Menten kinetics. Image by Aleia Kim
Kevin Ahern, Indira Rajagopal, and Taralyn Tan, Biochemistry Free For All, Oregon State University, via Biology LibreTexts. Image by Aleia Kim · CC BY-NC-SA 4.0 · Original image ↗ · Access for free ↗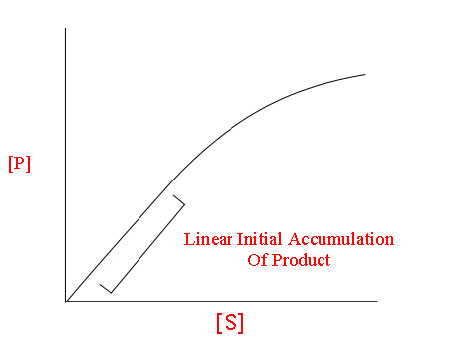
Figure 4.19 - Linear relationship between [P] and [S] at low [S]
Kevin Ahern, Indira Rajagopal, and Taralyn Tan, Biochemistry Free For All, Oregon State University, via Biology LibreTexts. · CC BY-NC-SA 4.0 · Original image ↗ · Access for free ↗Read the saturation curve
For a simple Michaelis–Menten enzyme, v₀ = Vmax × [S] / (Km + [S]). Here [S] is substrate concentration and v₀ is initial reaction rate.
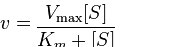
- Vmax is the limiting rate at saturating substrate. Its units are concentration/time, such as µM/s.
- Km is the substrate concentration at v₀ = Vmax/2. Its units are concentration, such as µM. Km does not equal Vmax/2.
- When [S] ≪ Km, v₀ ≈ (Vmax/Km)[S]: the rate is approximately first-order in substrate. When [S] ≫ Km, v₀ approaches Vmax and is approximately zero-order in substrate.
- Doubling the concentration of active enzyme doubles Vmax and v₀ at a fixed [S]; it leaves Km unchanged under the same conditions.
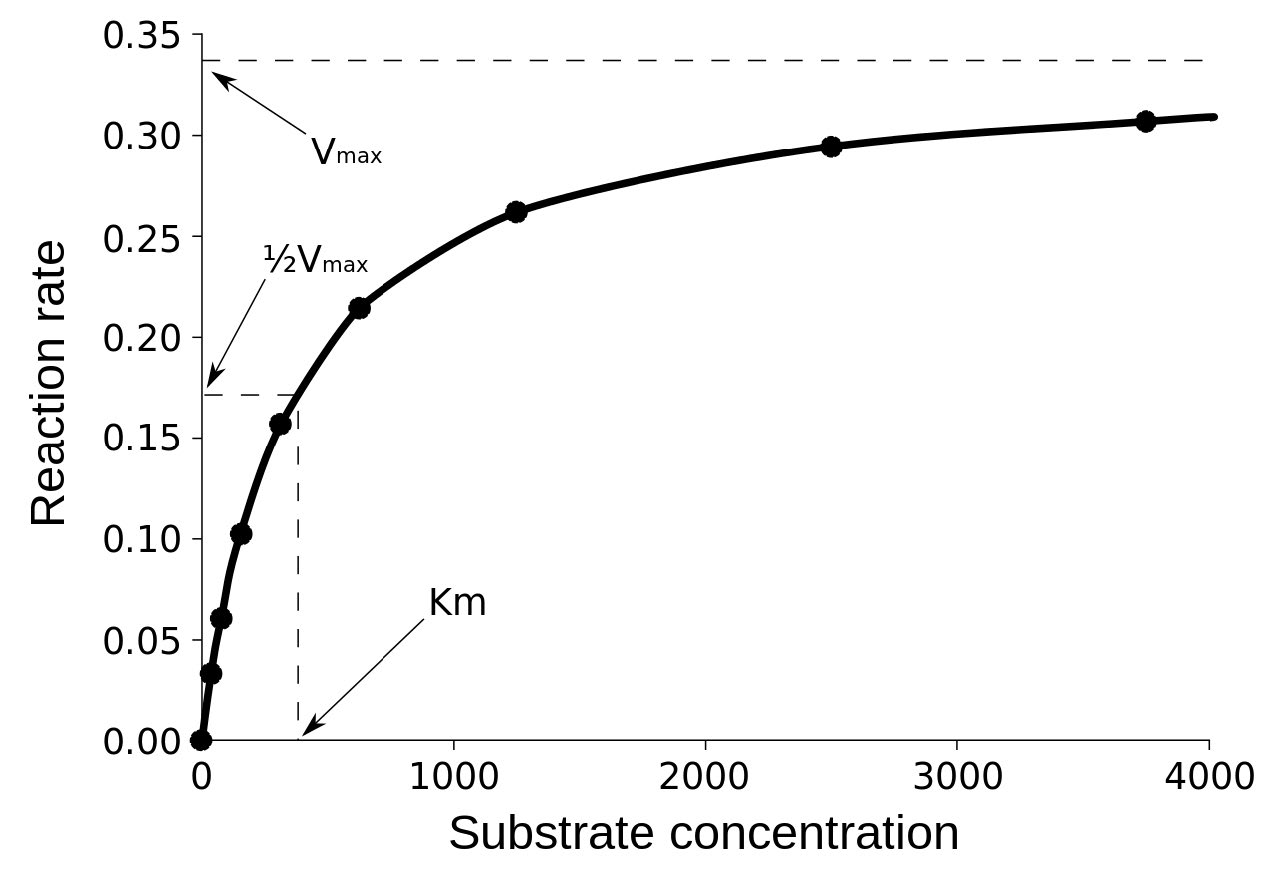
Figure 4.20 - Vmax, Vmax/2, and Km
Kevin Ahern, Indira Rajagopal, and Taralyn Tan, Biochemistry Free For All, Oregon State University, via Biology LibreTexts. · CC BY-NC-SA 4.0 · Original image ↗ · Access for free ↗Km and binding affinity. A smaller Km means less substrate is needed to reach half-maximal rate. Km includes catalytic as well as binding steps; it is not generally the dissociation constant Kd. For E + S ⇌ ES → E + P, Km = (k₋₁ + kcat)/k₁, whereas Kd = k₋₁/k₁. They are approximately equal only when kcat ≪ k₋₁. The source uses affinity as a shorthand; keep this distinction when interpreting a passage.
Separate turnover from enzyme amount
kcat = Vmax/[E]T. Here [E]T counts active catalytic sites; for one active site per enzyme molecule, it equals active enzyme concentration. kcat has units s⁻¹ and describes turnover at saturating substrate.
Catalytic efficiency is kcat/Km, with units M⁻¹ s⁻¹. At low [S], v₀ ≈ (kcat/Km)[E]T[S], so this ratio compares performance when substrate is scarce. Very efficient enzymes can become limited by how fast substrate diffuses to the enzyme.
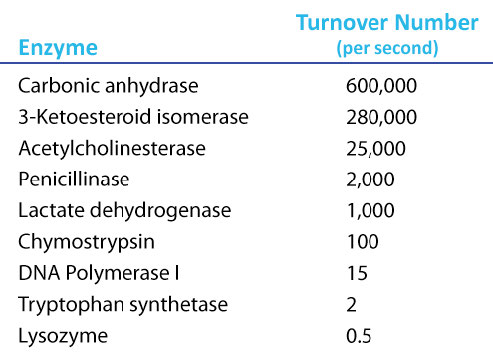
Figure 4.21 - Kcat (turnover number) values for several enzymes. Image by Aleia Kim
Kevin Ahern, Indira Rajagopal, and Taralyn Tan, Biochemistry Free For All, Oregon State University, via Biology LibreTexts. Image by Aleia Kim · CC BY-NC-SA 4.0 · Original image ↗ · Access for free ↗Worked example. Let Vmax = 60 µM/min, Km = 10 µM, and [E]T = 0.20 µM. At [S] = 30 µM, v₀ = 60 × 30/(10 + 30) = 45 µM/min. kcat = 60/0.20 = 300 min⁻¹ = 5 s⁻¹. Convert Km to 1.0 × 10⁻⁵ M: kcat/Km = 5.0 × 10⁵ M⁻¹ s⁻¹.
Read a Lineweaver–Burk plot
Plot 1/v₀ against 1/[S]. The equation is 1/v₀ = (Km/Vmax) × 1/[S] + 1/Vmax. Read the y-intercept as 1/Vmax, the x-intercept as −1/Km, and the slope as Km/Vmax.
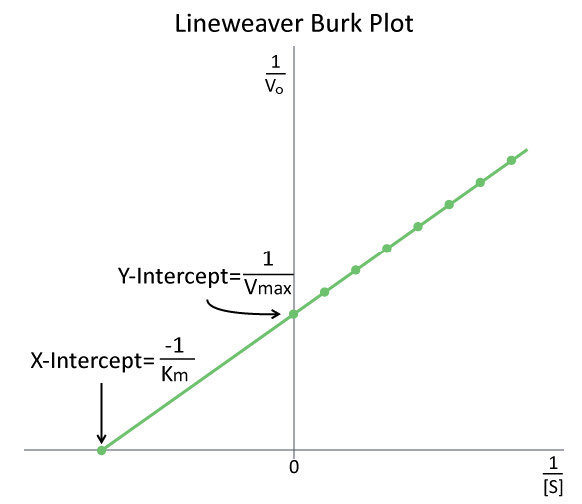
Figure 4.26 - A Lineweaver-Burk plot of 1/V₀ vs 1/[S]. Image by Aleia Kim
Kevin Ahern, Indira Rajagopal, and Taralyn Tan, Biochemistry Free For All, Oregon State University, via Biology LibreTexts. Image by Aleia Kim · CC BY-NC-SA 4.0 · Original image ↗ · Access for free ↗Worked example: intercepts. A y-intercept of 0.020 min/µM gives Vmax = 50 µM/min. An x-intercept of −0.10 µM⁻¹ gives Km = 10 µM. The slope is 10/50 = 0.20 min. Preserve the minus sign when using the x-intercept.
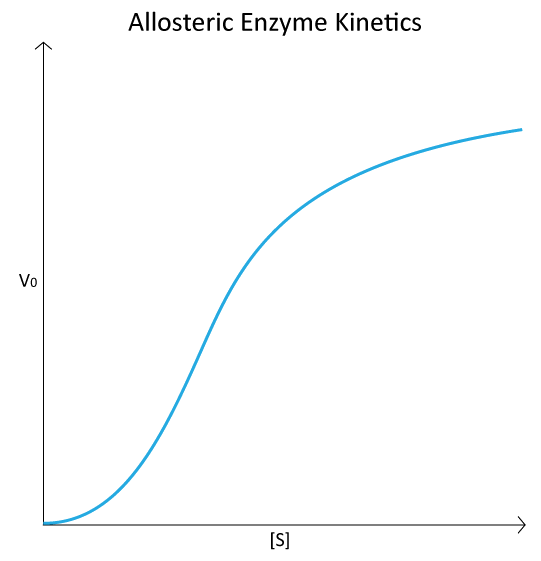
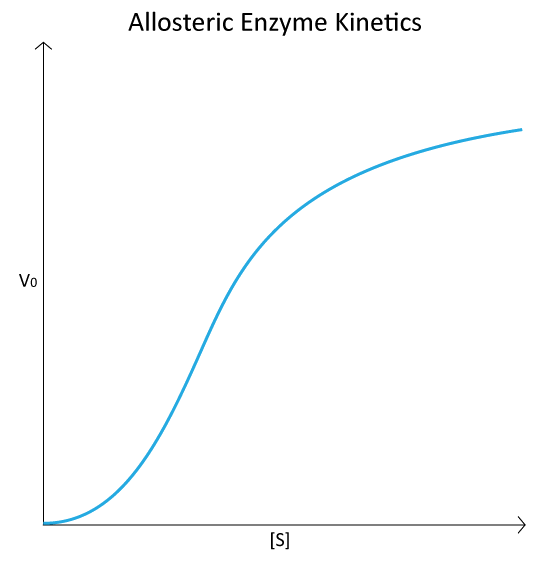
Model limits. Cooperative enzymes can show sigmoidal curves and do not follow the simple Michaelis–Menten equation. Use the model stated in the passage. Reciprocal plots are useful for recognizing patterns but exaggerate measurement error at low [S]; fitting the original rate curve is usually preferable.