Foundation 1 · 1A · Proteins and amino acids

and

Sources ↗

change the route and speed of a ; they do not change its overall or .

Lower the barrier, keep the endpoints

are biological ; most are . A provides an alternative with a lower activation barrier. It participates in intermediate steps but is regenerated by the end of the .

This plot shows that a catalyst decreases the activation energy for a reaction but does not change the Gibbs free energy.
lower

Figure 6.15 Enzymes lower the reaction's activation energy but do not change the reaction's free energy.

Mary Ann Clark, Matthew Douglas, and Jung Choi, Biology 2e, OpenStax. · CC BY-NC-SA 4.0 · Original image ↗ · Access for free ↗

A graph is shown with the label, “Extent of reaction,” appearing in a right pointing arrow below the x-axis and the label, “Energy,” in an upward pointing arrow just left of the y-axis. Approximately one-fifth of the way up the y-axis, a very short, somewhat flattened portion of both a red and a blue curve are shown. This region is labeled “Reactants.” A red concave down curve extends upward to reach a maximum near the height of the y-axis. From the peak, the curve continues downward to a second horizontally flattened region at a height of about one-third the height of the y-axis. This flattened region is labeled, “Products.” A second curve is drawn in blue with the same flattened regions at the start and end of the curve. The height of this curve is about two-thirds the height of the first curve and just right of its maximum, the curve dips low, then rises back and continues a downward trend at a lower height, but similar to that of the red curve. A horizontal dashed straight line extends from the point where both curves start in the “Reactants” region. A double sided arrow extends from the “Products” region at the end of both curves to this horizontal dashed line. This is labeled “capital delta H.” A double sided arrow extends from the dashed horizontal line to the peak of the red concave down curve. This arrow is labeled “E subscript a.” Another double sided arrow extends from the dashed horizontal line to the peak of the blue curve. This arrow is labeled “E subscript a.”
A changes the

Figure 12.19 Reaction diagrams for an endothermic process in the absence (red curve) and presence (blue curve) of a catalyst. The catalyzed pathway involves a two-step mechanism (note the presence of two transition states) and an intermediate species (represented by the valley between the two transitions states).

Paul Flowers, Klaus Theopold, Richard Langley, and William R. Robinson, Chemistry 2e, OpenStax. · CC BY-NC-SA 4.0 · Original image ↗ · Access for free ↗

Read the axis label. The Biology diagram shows and ; the Chemistry diagram labels the difference . Both illustrate unchanged endpoints and a lower activation barrier. and describe different quantities.

Source: Biology 2e §6.5 — Enzyme action · Chemistry 2e §12.7 — Catalysis and reaction diagrams

Bind, catalyze, release

The binds at the ’s , forming an . Specificity depends on the site’s shape and chemical environment: , , and the arrangement of all matter.

A simplified cycle is E + S ⇌ → E + P: E is , S is , is the , and P is . The is available for another cycle after release.

The treats the as a preformed match. adds movement: binding changes the ’s and positions groups to favor the .

In this diagram, a substrate binds the active site of an enzyme and, in the process, both the shape of the enzyme and the shape of the substrate change. The substrate is converted to products that then leave the enzymes active site.
binding and

Figure 6.16 According to the induced-fit model, both enzyme and substrate undergo dynamic conformational changes upon binding. The enzyme contorts the substrate into its transition state, thereby increasing the reaction's rate.

Mary Ann Clark, Matthew Douglas, and Jung Choi, Biology 2e, OpenStax. · CC BY-NC-SA 4.0 · Original image ↗ · Access for free ↗

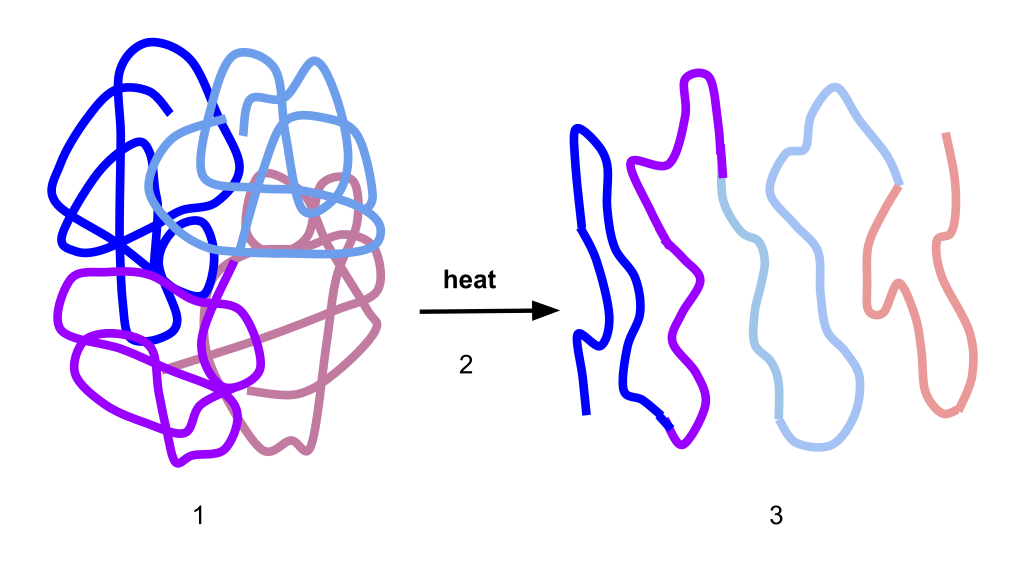
Temperature and affect activity. Temperature changes molecular motion; extreme heat can the . A change can alter active-site even before the overall unfolds.

Source: Biology 2e §6.5 — Enzyme action

Read an energy diagram

For a step, measure the activation barrier from the starting state to the next . A represents a ; a valley between represents a . A catalyzed pathway may have a different number of steps.
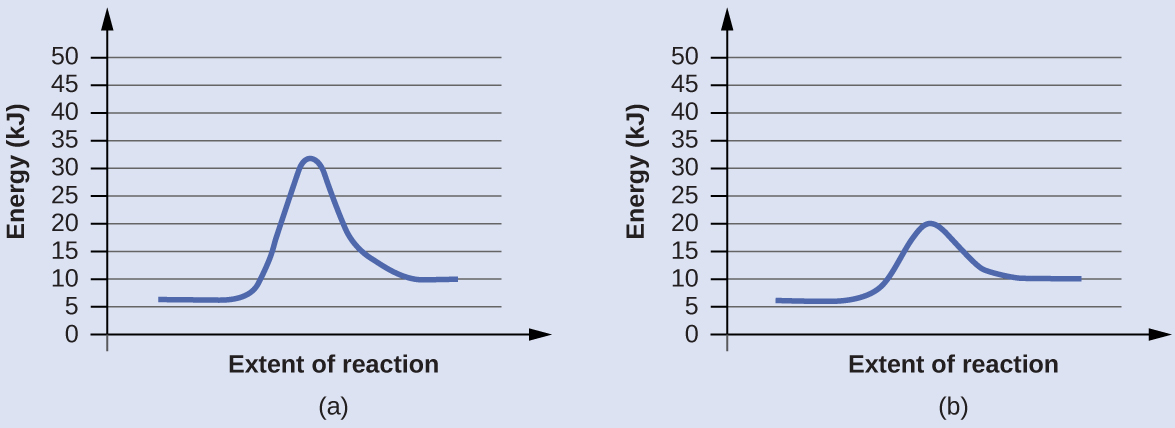
In this figure, two graphs are shown. The x-axes are labeled, “Extent of reaction,” and the y-axes are labeled, “Energy ( k J ).” The y-axes are marked off from 0 to 50 in intervals of five. In a, a blue curve is shown. It begins with a horizontal segment at about 6. The curve then rises sharply near the middle to reach a maximum of about 32 and similarly falls to another horizontal segment at about 10. In b, the curve begins and ends similarly, but the maximum reached near the center of the graph is only 20.
Example 12.15: comparing activation energies Paul Flowers, Klaus Theopold, Richard Langley, and William R. Robinson, Chemistry 2e, OpenStax. · CC BY-NC-SA 4.0 · Original image ↗ · Access for free ↗

Worked example: Figure (a) versus (b). Both diagrams start at 6 and end at 10 . Diagram (a) at 32 , so its is 32 − 6 = 26 . Diagram (b) at 20 , giving 20 − 6 = 14 . Diagram (b) is catalyzed: its barrier is smaller, while the energy difference remains +4 .

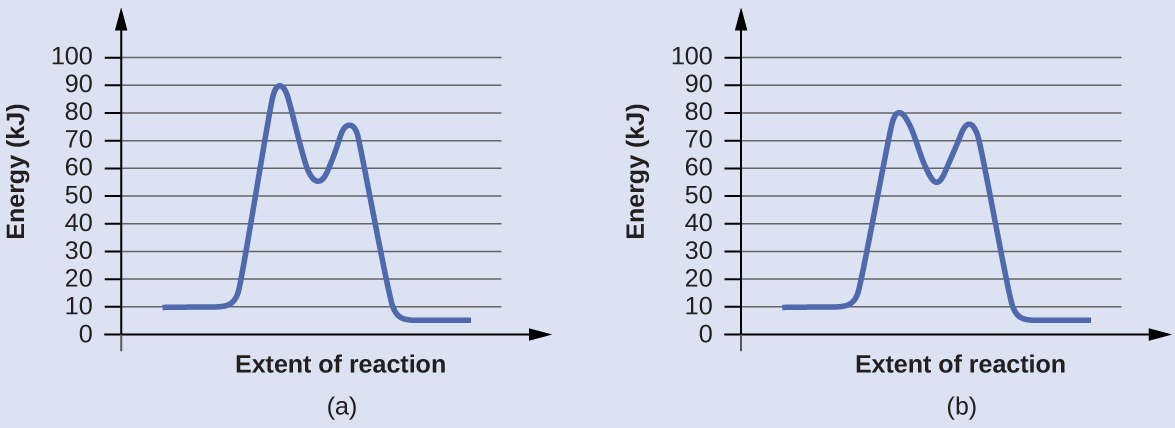
In this figure, two graphs are shown. The x-axes are labeled, “Extent of reaction,” and the y-axes are labeledc “Energy (k J).” The y-axes are marked off from 0 to 100 at intervals of 10. In a, a blue curve is shown. It begins with a horizontal segment at about 10. The curve then rises sharply near the middle to reach a maximum of about 91, then sharply falls to about 52, again rises sharply to about 73 and falls to another horizontal segment at about 5. In b, the curve begins and ends similarly, but the first peak reaches about 81, drops to about 55, then rises to about 77 before falling to the horizontal region at about 5.
Check Your Learning: two-step Paul Flowers, Klaus Theopold, Richard Langley, and William R. Robinson, Chemistry 2e, OpenStax. · CC BY-NC-SA 4.0 · Original image ↗ · Access for free ↗
Check your understanding: two-step pathways

For the first step, diagram (a) has a barrier of about 80 and (b) about 70 ; (b) is the catalyzed pathway. Measure each second-step barrier from its intermediate valley, not from the original : both are about 20 . and inhibition are covered in the next lessons.

Source: Chemistry 2e §12.7 — Catalysis and reaction diagrams

125 terms, alphabetically ordered

Acid · ·

In the Brønsted–Lowry model, a substance that can donate a . Acidic have a higher activity than water.

Read explanation · OpenStax ↗
Activation energy ·

The energy barrier that must overcome to reach a and undergo .

Read explanation · OpenStax ↗
Active site

The region of an that binds its and carries out .

Read explanation · OpenStax ↗
Adenosine triphosphate

An energy-carrying ; its powers many cellular processes, including cycles.

Read explanation · OpenStax ↗
Alpha carbon · ·

The central carbon next to the carboxyl carbon. In a standard it binds an , hydrogen, and .

Read explanation · OpenStax ↗
Amide · · ·

A group containing a carbon bonded to nitrogen. are amide linkages.

Read explanation · OpenStax ↗
Amino acid

A building block containing amino and and a characteristic .

Read explanation · OpenStax ↗
Amino acid residue · ·

The part of an incorporated into a chain. Residue can also describe another building block within a larger .

Read explanation · OpenStax ↗
Amino group · · ·

A nitrogen-containing . A free ’s amino group is typically (NH₃⁺) near physiological ; ’s ring nitrogen is an exception to this formula.

Read explanation · OpenStax ↗
Amphipathic

Having both a region and a region, as in a or .

Read explanation · OpenStax ↗
Aqueous solution ·

A in which water is the .

Read explanation · OpenStax ↗
Atom

The smallest unit of an element that retains its chemical identity; it has a surrounded by .

Read explanation · OpenStax ↗
Biomolecule

A made by or involved in living systems, including , , , and .

Read explanation · OpenStax ↗
Blotting ·

Transfer of separated or to a so a specific target can be detected.

Read explanation · Thermo Fisher ↗
Brønsted–Lowry base · · · · · · · · · · ·

In the Brønsted–Lowry model, a substance that can accept a . Basic solutions have lower activity than water.

Read explanation · OpenStax ↗
Carbohydrate

A class of including sugars and their , used for energy storage, structure, and recognition.

Read explanation · OpenStax ↗
Carbonyl group · ·

A carbon double-bonded to oxygen, C=O; present in and many other .

Read explanation · OpenStax ↗
Carboxyl group · ·

An , COOH. In free it is usually to COO⁻ near physiological .

Read explanation · OpenStax ↗
Catalyst · ·

A substance that speeds a by providing a pathway with lower and is regenerated rather than consumed overall.

Read explanation · OpenStax ↗
Chemical compound ·

A substance containing of two or more different chemically combined in a definite composition.

Read explanation · OpenStax ↗
Chemical element

A substance defined by having the same number of , such as carbon or oxygen.

Read explanation · OpenStax ↗
Chemical reaction ·

A process that rearranges and chemical bonds, converting into .

Read explanation · OpenStax ↗
Chromatin

The complex of and associated , including , in .

Read explanation · OpenStax ↗
Chromatographic peak · ·

A rise and fall in detector signal as one or more components pass through the detector; a peak does not guarantee a single pure .

Read explanation · Agilent ↗
Chromosome ·

An organized with associated that carries . A replicated chromosome has two .

Read explanation · OpenStax ↗
Codon

A sequence of three that specifies an or a stop signal.

Read explanation · OpenStax ↗
Concentration

The amount of a substance in a specified volume or mass of mixture.

Read explanation · OpenStax ↗
Conformation ·

A spatial arrangement accessible by rotations and other motions that do not require breaking .

Read explanation · NCBI Bookshelf ↗
Covalent bond · ·

A bond in which share pairs. and are covalent.

Read explanation · OpenStax ↗
Cysteine ·

An with a . Two cysteines can form a .

Read explanation · OpenStax ↗
Denaturation · ·

Loss of a ’s , often with . This usually preserves the chain’s .

Read explanation · NCBI Bookshelf ↗
Deoxyribonucleic acid

The that stores genetic information used to specify and sequences.

Read explanation · OpenStax ↗
Deprotonation

Removal of a from a or group; this changes its by minus one.

Read explanation · OpenStax ↗
Detergent

An substance that can associate with both water and material; detergents can disrupt or interactions.

Read explanation · Thermo Fisher ↗
Disulfide bond · · ·

A covalent sulfur–sulfur bond formed by of two , which can stabilize structure.

Read explanation · NCBI Bookshelf ↗
DNA replication

Copying so genetic information can be passed to daughter cells. Each guides a complementary new strand.

Read explanation · OpenStax ↗
Electric charge · · ·

An electrical property that can be positive or negative. Opposite charges attract and like charges repel; net charge is the sum of all charges on a particle.

Read explanation · OpenStax ↗
Electron

A negatively subatomic particle. Electron sharing and transfer determine much of chemical bonding.

Read explanation · OpenStax ↗
Endergonic

Having a positive under the stated conditions. Progress requires an energy input or coupling to a favorable process.

Read explanation · OpenStax ↗
Endothermic

Having a positive . The process absorbs heat at constant pressure when only pressure–volume work occurs.

Read explanation · OpenStax ↗
endpoint

Observed indicator or instrument change used to stop a .

Read explanation · OpenStax ↗
Enthalpy

A quantity whose change equals heat exchanged at constant pressure when only pressure–volume work occurs.

Read explanation · OpenStax ↗
Enthalpy change · ·

The difference in between and . At constant pressure with only pressure–volume work, it equals the heat transferred to the system.

Read explanation · OpenStax ↗
Entropy

A measure related to the number of accessible microscopic arrangements and the dispersal of energy.

Read explanation · OpenStax ↗
Enzyme

A biological that speeds a without being consumed. Most enzymes are .

Read explanation · OpenStax ↗
Enzyme–substrate complex · · ·

The bound association of an and its during a cycle. Often abbreviated ES in schemes.

Read explanation · OpenStax ↗
Equilibrium

A state where opposing processes occur at equal rates, so macroscopic or other properties remain constant.

Read explanation · OpenStax ↗
Equilibrium constant

A ratio of to activities at , each raised to its stoichiometric coefficient. At a fixed temperature, a does not change this ratio.

Read explanation · OpenStax ↗
Eukaryote ·

An organism whose cells have a -enclosed ; animals, plants, fungi, and protists are eukaryotes.

Read explanation · OpenStax ↗
Exergonic

Having a negative under the stated conditions. Such a is favorable but may require to proceed quickly.

Read explanation · OpenStax ↗
FACT complex ·

A -associated complex that helps machinery traverse and supports reorganization.

Read explanation · OpenStax ↗
Functional group

A group of whose chemical behavior gives a characteristic and properties.

Read explanation · OpenStax ↗
Gene

A sequence that contributes to a functional or , together with the information needed to express it.

Read explanation · OpenStax ↗
Gene expression

Production of a functional from a , including and, for -coding , .

Read explanation · NCBI Bookshelf ↗
Gibbs free energy · ·

A quantity used to predict whether a process is favorable at constant temperature and pressure. A negative change favors the forward process.

Read explanation · OpenStax ↗
Gibbs free energy change · ·

The change in during a process. At constant temperature and pressure, a negative value favors the forward under the stated conditions; it does not specify speed.

Read explanation · OpenStax ↗
Histone

A -associated rich in . Core histones form the around which nucleosomal wraps.

Read explanation · OpenStax ↗
Hydrogen ion · ·

A positively hydrogen species. H⁺ denotes a , which is hydrated in water; its activity determines .

Read explanation · OpenStax ↗
Hydrolysis

Breaking a chemical bond by adding water. hydrolysis separates .

Read explanation · OpenStax ↗
Hydrophilic

Interacting favorably with water, typically because a group is or .

Read explanation · OpenStax ↗
Hydrophobic

Interacting poorly with water. often gather in a ’s interior.

Read explanation · OpenStax ↗
Hydroxide ion ·

The negatively OH⁻. Basic contain a higher hydroxide ion activity than water at the same temperature.

Read explanation · OpenStax ↗
Induced fit

A model in which binding changes an ’s , bringing groups into an arrangement that promotes .

Read explanation · OpenStax ↗
Ion · ·

An or with a net because its numbers of and do not balance.

Read explanation · OpenStax ↗
Kilojoule ·

A unit of energy equal to 1,000 joules. Energy changes are often reported per , in kJ/mol.

Read explanation · NIST ↗
Kinetics

The study of and the factors and mechanisms that control them. A favorable may still proceed slowly.

Read explanation · OpenStax ↗
linkage

A tendency of nearby on the same to be inherited together.

Read explanation · OpenStax ↗
Lipid

A broad class of largely or , including fats, , and steroids.

Read explanation · OpenStax ↗
Lock-and-key model

A simplified model of specificity in which an ’s is already complementary to the before binding.

Read explanation · OpenStax ↗
locus

The specific position of a or other feature.

Read explanation · OpenStax ↗
Logarithm · · ·

The exponent needed to obtain a number from a chosen fixed number. For decimal logarithms, log₁₀(100) = 2 because 10² = 100; uses the negative decimal logarithm of activity.

Read explanation · OpenStax ↗
Loss of function

or elimination of a ’s normal activity.

Read explanation · NCBI Bookshelf / Sinauer Associates ↗
Membrane · · · ·

A thin boundary or sheet. Cell membranes are bilayers containing ; membranes are synthetic supports that hold or for detection.

Read explanation · OpenStax ↗
Messenger RNA ·

An that carries coding information used by to synthesize a .

Read explanation · OpenStax ↗
mole

Amount containing exactly 6.02214076 × 10²³ specified entities.

Read explanation · OpenStax ↗
Molecular chaperone · ·

A that assists other in folding or prevents , without specifying their sequence.

Read explanation · NCBI Bookshelf ↗
Molecule

Two or more joined by . A molecule may be electrically or carry a .

Read explanation · OpenStax ↗
Native structure · · ·

A ’s functional folded arrangement under its normal conditions.

Read explanation · NCBI Bookshelf ↗
Neutral

Having no net . For a , neutral instead means equal and activities; its is about 7 at 25 °C.

Read explanation · OpenStax ↗
Nitrogenous base · · ·

A nitrogen-containing ring component of ; its pairing interactions help specify sequences.

Read explanation · OpenStax ↗
Nonpolar ·

Lacking a substantial separation of . Nonpolar groups generally interact poorly with water.

Read explanation · OpenStax ↗
Nucleic acid

A of , such as or , used in information storage, expression, and other cellular functions.

Read explanation · OpenStax ↗
Nucleosome

The basic unit of : wrapped around a .

Read explanation · OpenStax ↗
Nucleotide

A joined to a sugar and one or more .

Read explanation · OpenStax ↗
Nucleus ·

A -enclosed compartment containing most of a cell’s .

Read explanation · OpenStax ↗
Octamer

A complex made of eight . A core contains eight .

Read explanation · OpenStax ↗
Oxidation ·

Loss of or an increase in oxidation state. Oxidizing two can form a .

Read explanation · OpenStax ↗
Peptide

A chain of joined by ; the term commonly describes chains shorter than a typical .

Read explanation · OpenStax ↗
Peptide bond ·

A covalent between the carboxyl carbon of one and the amino nitrogen of the next.

Read explanation · OpenStax ↗
pH

A measure of , defined as the negative of activity. Lower pH means greater ; pH influences .

Read explanation · OpenStax ↗
Phosphate group ·

A phosphorus-containing group bonded to oxygens; phosphate groups occur in , , and modified .

Read explanation · OpenStax ↗
Phospholipid

An with a -containing region and tails; a major component of cellular .

Read explanation · OpenStax ↗
Polar

Having an uneven distribution of . Polar groups often interact favorably with water.

Read explanation · OpenStax ↗
Polymer

A large made from many linked molecular building blocks.

Read explanation · OpenStax ↗
Polypeptide

A chain of connected by . A functional can contain one or several such chains.

Read explanation · OpenStax ↗
Proline ·

An whose loops back to the nitrogen, restricting rotation and often creating bends.

Read explanation · OpenStax ↗
Protein

One or more folded chains that perform biological roles such as , transport, signaling, or structural support.

Read explanation · OpenStax ↗
Protein aggregation · ·

Association of into larger clusters, often when exposed surfaces of unfolded stick together.

Read explanation · NCBI Bookshelf ↗
Protein backbone ·

The repeating nitrogen–alpha-carbon– chain of a , excluding its variable .

Read explanation · OpenStax ↗
Proton

A positively subatomic particle. In – chemistry, donating a proton means transferring a .

Read explanation · OpenStax ↗
Protonation

Addition of a to an , , or ; this changes its by plus one.

Read explanation · OpenStax ↗
R group · ·

The variable side chain attached to an ’s . It determines identity, , , and chemical behavior.

Read explanation · OpenStax ↗
Rate-determining step ·

A step that strongly limits the overall rate of a ; in simple sequential mechanisms, it is the slowest step.

Read explanation · OpenStax ↗
Reactant

A starting substance transformed during a .

Read explanation · OpenStax ↗
Reaction intermediate · ·

A species formed in one step and consumed in another. It occupies a local energy minimum between .

Read explanation · OpenStax ↗
Reaction mechanism · ·

The sequence of elementary steps by which become , including any .

Read explanation · OpenStax ↗
Reaction product ·

A substance formed by a .

Read explanation · OpenStax ↗
Reaction rate · ·

How quickly are consumed or form, usually expressed as a change per unit time.

Read explanation · OpenStax ↗
Reduction

Gain of or a decrease in state. Reducing a restores two .

Read explanation · OpenStax ↗
Ribonucleic acid ·

A with roles in , regulation, and ; carries -coding information.

Read explanation · OpenStax ↗
Ribosome ·

A complex of and that translates into a .

Read explanation · OpenStax ↗
Sister chromatid

One of the two copies of a produced by . An intact sister chromatid can supply a template for accurate repair.

Read explanation · Biology LibreTexts / Oregon State University ↗
Solubility ·

The amount of a substance that can dissolve in a under specified conditions. Soluble means able to dissolve; insoluble means only very slightly soluble in that .

Read explanation · OpenStax ↗
Solute

A dissolved component of a .

Read explanation · OpenStax ↗
Solution

A homogeneous mixture in which are dissolved in a .

Read explanation · OpenStax ↗
Solvent

The component of a that dissolves other substances, usually the component present in the greatest amount.

Read explanation · OpenStax ↗
Substrate

A that an binds and chemically transforms.

Read explanation · OpenStax ↗
Subunit ·

An individual chain within a containing multiple chains.

Read explanation · OpenStax ↗
Template strand · · ·

A preexisting strand whose sequence guides complementary nucleic- synthesis.

Read explanation · OpenStax ↗
Thermodynamics ·

The study of energy, , and . It helps determine whether a process is favorable, while concerns how fast it occurs.

Read explanation · OpenStax ↗
Thiol group · · · ·

A sulfur bonded to hydrogen, –SH. thiols can form through .

Read explanation · OpenStax ↗
Titration

Gradually adding a of known to another to measure its amount or – behavior.

Read explanation · OpenStax ↗
Transcription

Synthesis of using a template.

Read explanation · OpenStax ↗
Transition state

A fleeting, high-energy arrangement at a barrier. It is an energy maximum along the path, rather than a stable .

Read explanation · OpenStax ↗
Translation ·

Synthesis of a on a using the sequence of in .

Read explanation · OpenStax ↗

Biology 2e §6.5 — Enzyme action

OpenStax · Biology 2e §6.5 — Enzyme action ↗
Opening explanation and Enzyme Active Site and Substrate Specificity, including Induced Fit and Enzyme Function. Enzyme regulation is outside this selection.

A substance that helps a to occur is a , and the special that catalyze biochemical are . Almost all are , comprised of chains, and they perform the critical task of lowering the activation energies of chemical inside the cell. do this by binding to the , and holding them in such a way as to make the chemical bond-breaking and bond-forming processes take place more readily. It is important to remember that do not change the 's . In other words, they do not change whether a is (spontaneous) or . This is because they do not change the ' or ' . They only reduce the required to reach the (Figure 6.15).

This plot shows that a catalyst decreases the activation energy for a reaction but does not change the Gibbs free energy.
lower

Figure 6.15 Enzymes lower the reaction's activation energy but do not change the reaction's free energy.

Mary Ann Clark, Matthew Douglas, and Jung Choi, Biology 2e, OpenStax. · CC BY-NC-SA 4.0 · Original image ↗ · Access for free ↗

and Specificity

The chemical to which an binds are the ’s . There may be one or more , depending on the particular . In some , a single- breaks down into multiple . In others, two may come together to create one larger . Two might also enter a , both become modified, and leave the as two . The location within the where the binds is the ’s . This is where the “action” happens. Since are , there is a unique combination of (also , or ) within the . Different properties characterize each . These can be large or small, weakly or basic, or , positively or negatively , or . The unique combination of , their positions, sequences, structures, and properties, creates a very specific chemical environment within the . This specific environment is suited to bind, albeit briefly, to a specific chemical (or ). Due to this jigsaw puzzle-like match between an and its (which adapts to find the best fit between the and the ), are known for their specificity. The “best fit” results from the shape and the ’s attraction to the . There is a specifically matched for each and, thus, for each ; however, there is flexibility as well.

The that are so perfectly suited to provide specific environmental conditions also means that they are subject to local environmental influences. It is true that increasing the environmental temperature generally increases , -catalyzed or otherwise. However, increasing or decreasing the temperature outside of an optimal range can affect chemical bonds within the in such a way that they are less well suited to bind . High temperatures will eventually cause , like other biological , to , a process that changes the substance's natural properties. Likewise, the local environment's can also affect function. have their own or basic properties that are optimal for . These are sensitive to changes in that can impair the way bind. are suited to function best within a certain range, and, as with temperature, extreme environmental values ( or basic) can cause to .

and Function

For many years, scientists thought that - binding took place in a simple “” fashion. This model asserted that the and fit together perfectly in one instantaneous step. However, current research supports a more refined view scientists call (Figure 6.16). This model expands upon the by describing a more dynamic interaction between and . As the and come together, their interaction causes a mild shift in the ’s structure that confirms an ideal binding arrangement between the and the 's . This ideal binding maximizes the ’s ability to catalyze its .

Link to Learning

View an animation at this website.

When an binds its , it forms an . This complex lowers the 's and promotes its rapid progression in one of many ways. On a basic level, promote chemical that involve more than one by bringing the together in an optimal orientation. The appropriate region ( and bonds) of one is juxtaposed to the other 's appropriate region with which it must react. Another way in which promote is by creating an optimal environment within the for the to occur. Certain chemical might proceed best in a slightly or environment. The chemical properties that emerge from the particular arrangement of within an create the perfect environment for an ’s specific to react.

You have learned that the required for many includes the energy involved in manipulating or slightly contorting chemical bonds so that they can easily break and allow others to reform. Enzymatic action can aid this process. The can lower the by contorting in such a way as to facilitate bond-breaking, helping to reach the . Finally, can also lower activation energies by taking part in the itself. The can provide certain or chemical groups that actually form with as a necessary step of the process. In these cases, it is important to remember that the will always return to its original state at the 's completion. One of ' hallmark properties is that they remain ultimately unchanged by the they catalyze. After an catalyzes a , it releases its (s).

In this diagram, a substrate binds the active site of an enzyme and, in the process, both the shape of the enzyme and the shape of the substrate change. The substrate is converted to products that then leave the enzymes active site.
binding and

Figure 6.16 According to the induced-fit model, both enzyme and substrate undergo dynamic conformational changes upon binding. The enzyme contorts the substrate into its transition state, thereby increasing the reaction's rate.

Mary Ann Clark, Matthew Douglas, and Jung Choi, Biology 2e, OpenStax. · CC BY-NC-SA 4.0 · Original image ↗ · Access for free ↗

Chemistry 2e §12.7 — Catalysis and reaction diagrams

OpenStax · Chemistry 2e §12.7 — Catalysis and reaction diagrams ↗

Opening explanation through Example 12.15 and its Check Your Learning exercise. Later sections on homogeneous and heterogeneous catalysts are outside this selection.

Among the factors affecting rates discussed earlier in this chapter was the presence of a , a substance that can increase the without being consumed in the . The concepts introduced in the previous section on provide the basis for understanding how are able to accomplish this very important function.

Figure 12.19 shows diagrams for a chemical process in the absence and presence of a . Inspection of the diagrams reveals several traits of these . Consistent with the that the two diagrams represent the same overall , both curves begin and end at the same energies (in this case, because are more energetic than , the is ). The , however, are clearly different. The uncatalyzed proceeds via a one-step mechanism (one observed), whereas the catalyzed follows a two-step mechanism (two observed) with a notably lesser . This difference illustrates the means by which a functions to accelerate , namely, by providing an alternative with a lower . Although the catalyzed for a needn’t necessarily involve a different number of steps than the uncatalyzed mechanism, it must provide a path whose is faster (lower Ea).

A graph is shown with the label, “Extent of reaction,” appearing in a right pointing arrow below the x-axis and the label, “Energy,” in an upward pointing arrow just left of the y-axis. Approximately one-fifth of the way up the y-axis, a very short, somewhat flattened portion of both a red and a blue curve are shown. This region is labeled “Reactants.” A red concave down curve extends upward to reach a maximum near the height of the y-axis. From the peak, the curve continues downward to a second horizontally flattened region at a height of about one-third the height of the y-axis. This flattened region is labeled, “Products.” A second curve is drawn in blue with the same flattened regions at the start and end of the curve. The height of this curve is about two-thirds the height of the first curve and just right of its maximum, the curve dips low, then rises back and continues a downward trend at a lower height, but similar to that of the red curve. A horizontal dashed straight line extends from the point where both curves start in the “Reactants” region. A double sided arrow extends from the “Products” region at the end of both curves to this horizontal dashed line. This is labeled “capital delta H.” A double sided arrow extends from the dashed horizontal line to the peak of the red concave down curve. This arrow is labeled “E subscript a.” Another double sided arrow extends from the dashed horizontal line to the peak of the blue curve. This arrow is labeled “E subscript a.”
A changes the

Figure 12.19 Reaction diagrams for an endothermic process in the absence (red curve) and presence (blue curve) of a catalyst. The catalyzed pathway involves a two-step mechanism (note the presence of two transition states) and an intermediate species (represented by the valley between the two transitions states).

Paul Flowers, Klaus Theopold, Richard Langley, and William R. Robinson, Chemistry 2e, OpenStax. · CC BY-NC-SA 4.0 · Original image ↗ · Access for free ↗

Example 12.15

Diagrams for Catalyzed

The two diagrams here represent the same : one without a and one with a . Estimate the for each process, and identify which one involves a .
In this figure, two graphs are shown. The x-axes are labeled, “Extent of reaction,” and the y-axes are labeled, “Energy ( k J ).” The y-axes are marked off from 0 to 50 in intervals of five. In a, a blue curve is shown. It begins with a horizontal segment at about 6. The curve then rises sharply near the middle to reach a maximum of about 32 and similarly falls to another horizontal segment at about 10. In b, the curve begins and ends similarly, but the maximum reached near the center of the graph is only 20.
Example 12.15: comparing activation energies Paul Flowers, Klaus Theopold, Richard Langley, and William R. Robinson, Chemistry 2e, OpenStax. · CC BY-NC-SA 4.0 · Original image ↗ · Access for free ↗

Activation energies are calculated by subtracting the energy from the energy.
diagram (a):Ea=32kJ−6kJ=26kJ diagram (b):Ea=20kJ−6kJ=14kJ

The catalyzed is the one with lesser , in this case represented by diagram b.

Check Your Learning

diagrams for a chemical process with and without a are shown below. Both involve a two-step mechanism with a rate-determining first step. Compute activation energies for the first step of each mechanism, and identify which corresponds to the catalyzed . How do the second steps of these two mechanisms compare?

In this figure, two graphs are shown. The x-axes are labeled, “Extent of reaction,” and the y-axes are labeledc “Energy (k J).” The y-axes are marked off from 0 to 100 at intervals of 10. In a, a blue curve is shown. It begins with a horizontal segment at about 10. The curve then rises sharply near the middle to reach a maximum of about 91, then sharply falls to about 52, again rises sharply to about 73 and falls to another horizontal segment at about 5. In b, the curve begins and ends similarly, but the first peak reaches about 81, drops to about 55, then rises to about 77 before falling to the horizontal region at about 5.
Check Your Learning: two-step Paul Flowers, Klaus Theopold, Richard Langley, and William R. Robinson, Chemistry 2e, OpenStax. · CC BY-NC-SA 4.0 · Original image ↗ · Access for free ↗

Answer:

For the first step, Ea = 80 for (a) and 70 for (b), so diagram (b) depicts the catalyzed . Activation energies for the second steps of both mechanisms are the same, 20 .